Conceptual Model of PM2.5 Episodes in the Midwest - Lake Michigan Air Directors Consortium - LADCO PM Data Analysis Workgroup January 2009
←
→
Page content transcription
If your browser does not render page correctly, please read the page content below
Lake Michigan Air Directors Consortium

Conceptual Model
of PM2.5 Episodes in
the Midwest

LADCO PM Data Analysis Workgroup
January 2009
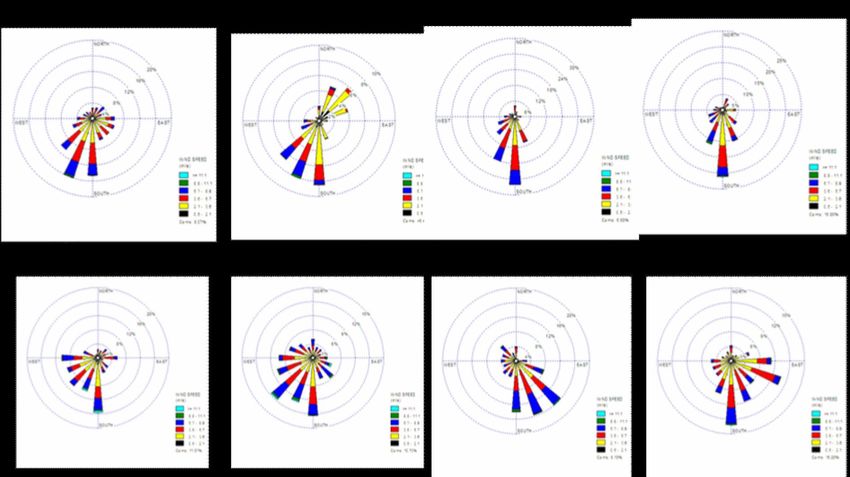
Table of Contents
Executive Summary ..............................................................................................1
Introduction ...........................................................................................................2
Current Conditions and Trends .............................................................................2
Temporal and Spatial Patterns of PM2.5...............................................................7
PM2.5 Composition .............................................................................................12
Source Apportionment.........................................................................................16
PM2.5 Sensitivity to Changes in Precursor Concentrations ................................18
Meteorological Analyses .....................................................................................20
Wind Roses.........................................................................................................20
CART Analysis ....................................................................................................23
Trajectory Analysis ..............................................................................................29
Synoptic Meteorology..........................................................................................32
Conclusions.........................................................................................................35
Control Recommendations..................................................................................36
References..........................................................................................................36
Supplemental Material.........................................................................................38
Figures
th
Fig. 1 98 Percentile PM2.5 Concentrations, 20052007 .....................................4
Fig. 2 Trends in 98th Percentiles, LADCO States, 19992007 ..............................4
Fig. 3 Linear Least Squares and Theil Trends of PM2.5 Values
Greater than the 90th Percentile at Wisconsin SE Headquarters
Site (Milwaukee)....................................................................................................5
Fig. 4 Theil Trends in 98th Percentile Values , 19992007, at PM2.5 Sites...........5
Fig. 5 Frequency of Elevated PM2.5 Concentrations by City ...............................8
Fig. 6 Frequency of Elevated PM2.5 Concentrations by Month
(Southern Cities) ...................................................................................................9
Fig. 7 Frequency of Elevated PM2.5 Concentrations by Month
(Northern Cities)..................................................................................................10
Fig. 8 DayofWeek Variation in High PM2.5 Concentrations
(Northern Cities)..................................................................................................11
Fig. 9 PM2.5 Composition on Episode and Nonepisode Days in
Urban Areas (2005).............................................................................................12
Fig. 10 Ratio of Bulk Species Concentrations on High Days to All
Days at Allen Park, MI.........................................................................................13
Fig. 11 PM2.5 Composition on Summer 2005 Episode and
Nonepisode Days................................................................................................14
ii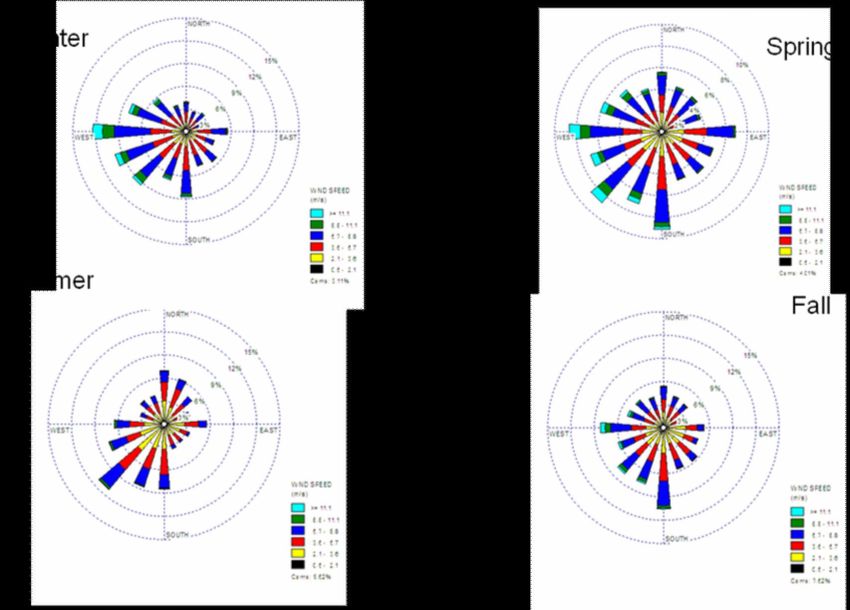
Fig. 12 PM2.5 Composition on Winter 2005 Episode and
Nonepisode Days.................................................................................................. 14
Fig. 13 UrbanRural Comparison of Major PM2.5 Components ........................... 15
Fig. 14 PMF Contributions at (a) Allen Park, MI, and (b) Dearborn, MI ............... 17
Fig. 15 Ratios of Metal Concentrations on High Days to All Days ....................... 18
Fig. 16 Locations of Ammonia Monitoring Sites ................................................... 19
Fig. 17 Isopleths of mean predicted PM2.5 mass concentrations
from SCAPE model results for Mayville, Wisconsin .............................................. 20
Fig. 18 Seasonal Wind Roses for Indianapolis..................................................... 21
Fig. 19 EpisodeDay Wind Roses for 8 Urban Areas ........................................... 22
Fig. 20 Chicago CART Tree ................................................................................. 27
Fig. 21 Distribution of Chicago Episode Days among CART Nodes .................... 28
Fig. 22 Timeline of Chicago Episodes, by Node................................................... 28
Fig. 23 Trends in Chicago HighConcentration Nodes ......................................... 29
Fig. 24 Back Trajectory Analysis of High Sulfate Source Regions
and High Nitrate Source Regions.......................................................................... 31
Fig. 25 September 4, 2004 – Surface Weather Map ............................................ 33
Fig. 26 AIRNow PM2.5 Maps – September 5 & 6, 2004 ...................................... 34
Fig. 27 Sulfate & Nitrate Concentrations – Indianapolis, IN –
September 26, 2004............................................................................................. 35
Tables
Table 1 Annual Trend in Pm2.5 Values above 90th Percentile (ug/m3/year). ....... 6
Table 2 Valid Monitoring Days and High Pm2.5 Days, by Urban Area................. 7
Table 3 Coherence of High PM2.5 Days across the Detroit Network ................... 11
Table 4 Variables included in CART Analysis ...................................................... 24
iii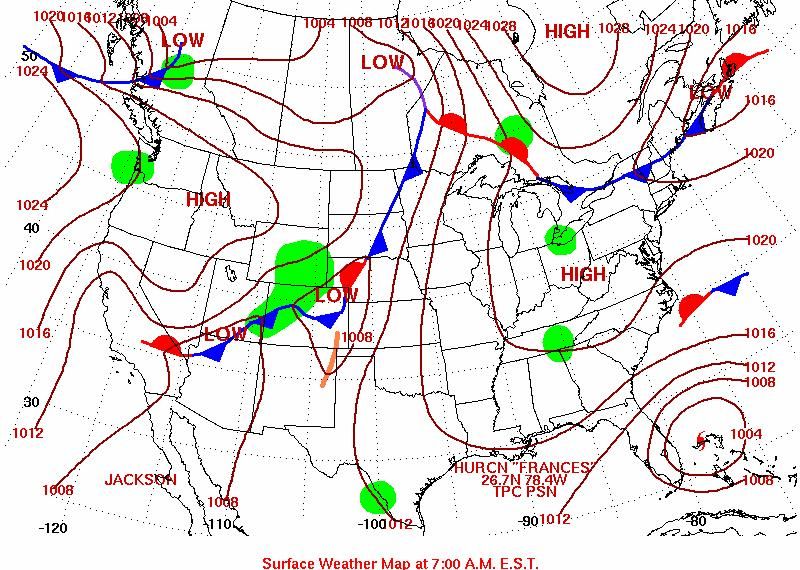
A Conceptual Model of PM2.5 Episodes in the Midwest
Draft Report of the LADCO PM Data Analysis Workgroup1
Executive Summary
Nonattainment of the 24hr PM2.5 ambient air quality standard is a widespread problem
across the LADCO states, with 57 of 126 monitors exceeding the standard in 2005
2007. This study examined ambient PM2.5 and meteorological data from 19992007
along with several draft or published studies of LADCO projects for clues to the nature
of elevated PM2.5 episodes in the LADCO 5state region. Despite the varied analyses,
the results were remarkably consistent. PM2.5 episodes generally occur across broad
geographic areas involving multiple cities and states. The composition of PM2.5
indicates that regional sources are the primary contributors during episodes.
Ammonium sulfate is always elevated during episodes regardless of season.
Wintertime PM2.5 during episodes often is strongly enriched in ammonium nitrate,
especially at the northern sites in the region. Organic carbon is elevated during both
summer and winter episodes, although to a lesser degree than sulfate and nitrate. In
contrast, components of PM2.5 that are typically associated with industrial sources
(metals and crustal species) are not significantly enriched during episodes.
High daily concentrations are driven by specific meteorological conditions, not by a
sudden increase in emissions from sources. Episodes are characterized by stagnant air
masses accompanied by high pressure, slow wind speeds, high relative humidity, and
southerly winds. The longer these conditions persist, the higher concentration build up,
until a new weather system arrives with cleaner air.
While PM2.5 concentrations have declined across the region since 1999,
meteorologically adjusted trends indicate that these changes may be driven more by
yeartoyear variations in meteorology than by changes in emissions. Sensitivity
analyses indicate that reductions in SO2 emissions would be effective at reducing
PM2.5 concentrations yearround across the region. Wintertime decreases of both
ammonia and NOx would be effective, with most sites responding slightly more to
ammonia reductions than to NOx. Organic carbon reductions would also be effective
both regionally and locally.
1
Contributors: Bill Adamski, WDNR; Michele Boner, IDEM; Brian Callahan, IDEM; Michael Compher,
USEPA R5; Jim Haywood, MDEQ; Cynthia Hodges, MDEQ; Donna Kenski, LADCO; Sam Rubens, Akron
AQMD; Bart Sponseller, WDNR.,
1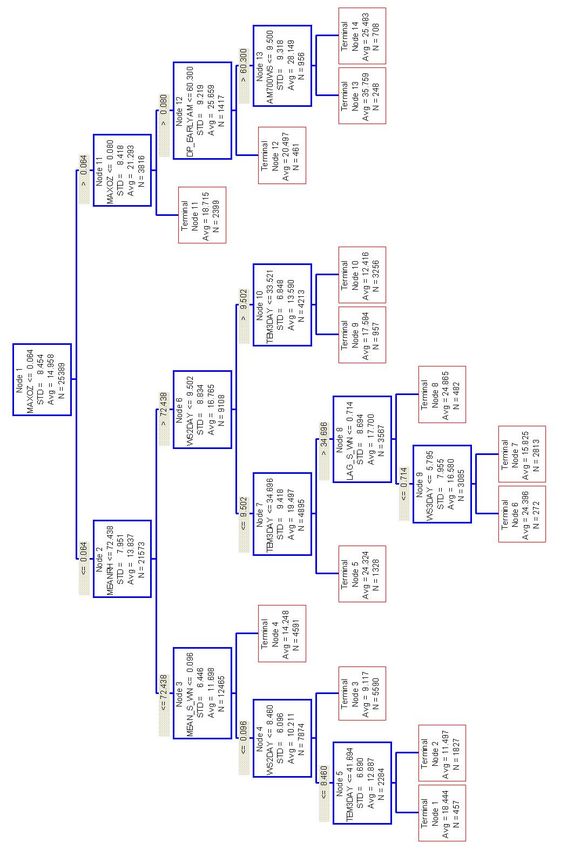
Introduction
In September 2006, U.S. Environmental Protection Agency (EPA) lowered the 24hour
PM2.5 National Ambient Air Quality Standard (NAAQS) from 65 ug/m3 to 35 ug/m3.
Unlike the annual standard, which averages all measurements of PM2.5 over the entire
year, the form of the daily standard is a 98th percentile. Its target is extreme events, or
episodes, in which concentrations are significantly higher than average. As states begin
to plan how they can meet the tighter standard, information about PM2.5 episodes
becomes increasingly important. This report is an effort to collect and organize
information about PM2.5 episodes in the Midwest in order to improve our understanding
of the behavior of PM2.5 and the factors that are most influential to the development of
high concentrations. In this report, we summarize current concentrations and trends,
spatial and temporal variability, composition, urbanrural differences, source
contributions, and meteorological factors associated with PM episodes. The analyses
focus on major urban areas in the LADCO region. The message that emerges from
these various analyses is surprisingly consistent. With the exception of a handful of
sites in the region that are close to large industrial facilities, PM2.5 episodes in the
Midwest are largely a function of meteorological conditions that occur on a regional
scale. Episodic concentrations generally occur across broad geographic regions,
involve multiple cities and states, and are characterized by similar meteorology and
similar PM2.5 composition. Thus efforts to lower concentrations during these
meteorological conditions will be most effective if they target the regional pollutants that
lead to ammonium sulfate, ammonium nitrate, and organic carbon particle formation.
Current Conditions and Trends
To set the stage for the analyses to follow, the current values of the 98th percentile
PM2.5 concentrations for 20052007 are shown in Fig. 1. All points in red or purple are
sites that are currently exceeding the 24hr PM2.5 NAAQS. These nonattainment sites
total 57 of 126 monitors reporting complete data for the period. All of our major urban
areas except Minneapolis fail to meet the standard, as well as a number of sites that fall
outside the urban centers, especially in Indiana and Ohio. Nonattainment of the daily
NAAQS is clearly a widespread regional problem. Bringing these areas into compliance
with the standard will require equally widespread and wideranging control measures.
Trends in PM2.5 concentrations were examined several ways. States began measuring
PM2.5 in 1999 to meet the requirements of the new PM2.5 standard promulgated in
1997, so the sampling record is only 8 or 9 years for most sites. Establishing
statistically significant trends for a dataset that includes a high degree of variability, as
most ambient air measurements do, requires a long period of measurements. Trends
2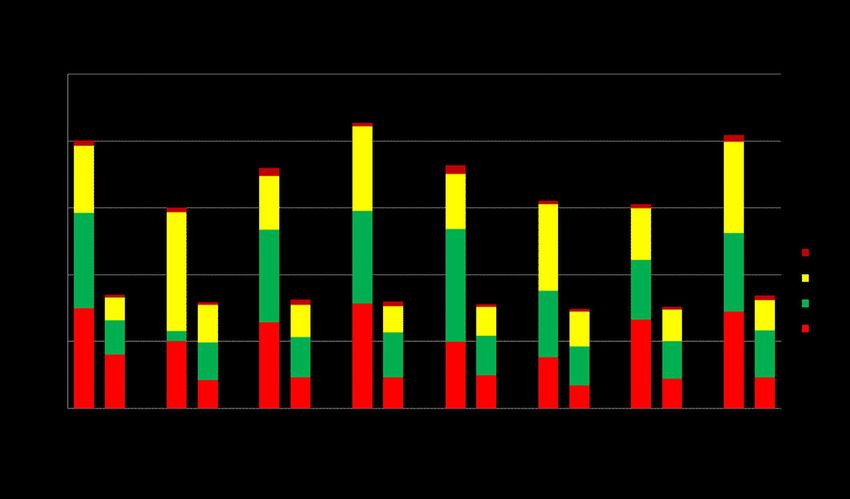
presented here should be considered a preliminary assessment; definitive statements
on longterm trends require a more comprehensive data record. However, the data so
far are encouraging, in both the downward direction of the trend and in the consistency
among sites.
Figure 2 shows trends in the 98th percentile values at a subset of sites in the region that
have recorded data for the entire 9 years from 1999 to 2007. Concentrations have
declined steadily, except for a sharp increase in 2005 and a slight uptick in 2007.
Trends at individual sites were calculated for the 98th percentile and for all values higher
than the 90th percentile. The 98th percentile trends were highly unstable and not a
reliable indicator of true data trends. Trends developed from values higher than the 90th
percentile, in contrast, were very stable and remarkably consistent from site to site.
Figure 3 shows the trend at one site in Wisconsin as an example. Change in PM
concentration over time was calculated from both a linear regression (blue line in Fig. 3)
and a Theil regression (red line in Fig. 3), which is the nonparametric equivalent of
linear regression. The nonparametric test is preferable here because it is less sensitive
to outliers and does not assume that the data are normally distributed. Trends were
very similar for both calculations. Fig. 4 shows the direction and magnitude of trends for
all the sites. Trends were downward at all sites and varied in magnitude from 0.03
ug/m3/yr at Chiwaukee Prairie in Wisconsin to 1.57 ug/m3/yr at Wyandotte in Michigan.
The average decline was 0.51 ug/m3/year and 21 of the 55 sites examined had
statistically significant trends, as indicated in Table 1. Trend plots for all sites are
included in the supplemental material. The consistency in direction of trends around the
region strongly points to similar forces at work on all sites, rather than local influences.
3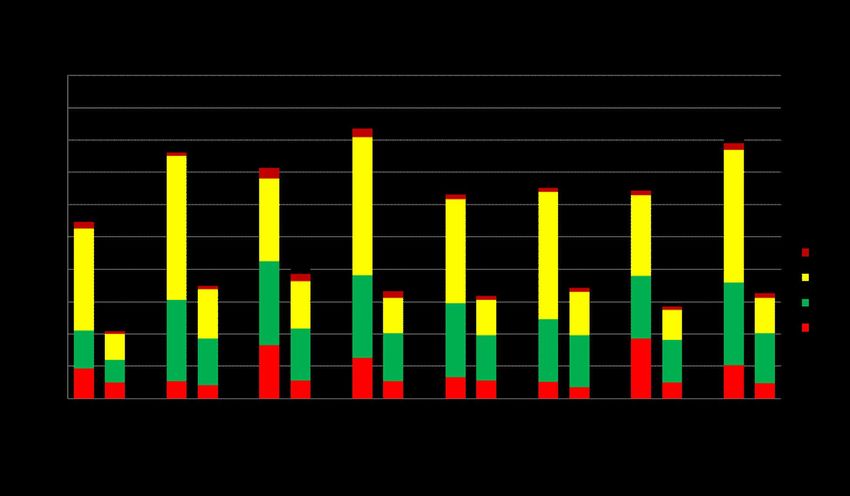
Fig. 1 98th Percentile PM2.5 Concentrations, 20052007
Figure 2 Trends in 98th Percentiles, LADCO States, 19992007
4
Figure 3. Linear Least Squares and Theil Trends of PM2.5 Values Greater than the 90th
Percentile at Wisconsin SE Headquarters Site (Milwaukee)
Fig. 4 Theil Trends in 98th Percentile Values , 19992007, at PM2.5 Sites
5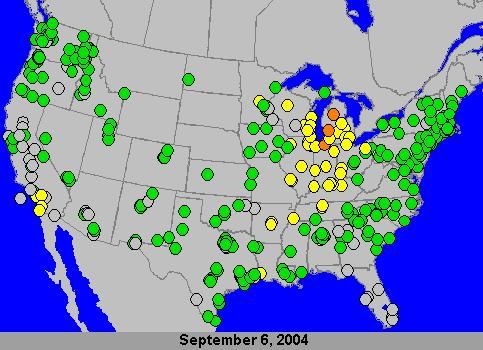
Table 1 Annual Trend in Pm2.5 Values above 90th Percentile (ug/m3/year). Highlighted
cells are statistically significant.
Annual Annual
change in change in
90%ile 90%ile
PM2.5 PM2.5
Site (ug/m3) Site (ug/m3)
ILSE Police Sta. 0.89 MIFort Street 1.10
ILMayfair Pump Sta 0.39 MILinwood 0.76
ILBlue Island 0.31 MIDearborn 0.86
ILSummit 0.36 MIWyandotte 1.57
ILNorthbrook 0.30 MNRichfield 1.12
ILGranite City 0.06 MNMinneapolis City Hall 0.83
ILWood River 0.05 MNSt Paul, Red Rock Rd 0.89
INNew Albany MNSt Paul, Ramsey Hlth
(Louisville) 0.37 Ctr 0.56
INFranklin Sch. 0.22 MNSt. Paul, 6th St. 0.44
INGary, Ivanhoe Sch. 0.62 MOArnold Tenbrook 0.46
INHammondPurdue 0.27 MOW. Alton 0.37
INHammond, Clark HS 0.50 MOClayton 0.43
INIndianapolis, Mann Rd 0 MOSTLBlair St 0.76
INWashington Park 0.36 MOSTLMargaretta 0.61
INIndianapolis, Lawrence
North HS 0.21 MOSTL2nd & Mound 0.47
INSchool 90 0.20 OHCleveland, St. Tikhon 1.07
OHCleveland, E.
INSchool 15 0.31 14th&Orange 0.90
INIndiana Dunes 0.26 OHCincinnati, HCDOES 0.21
INPorter Cty Water Plant 0.32 OHCincinnati, Norwood 0.61
KYShepherdsville 0.73 OHCincinnati, St. Bernard 0.44
KYLouisville,
37th&Southern 0.86 WIChiwaukee Prairie 0.03
KYWyandotte Park 0.73 WIMilw. Hlth Ctr 0.51
KYCovington 0.36 WIDNR SER HQ 0.41
MINew Haven 0.25 WIMilw., Virginia FS 0.70
MIOak Park 0.57 WIFAA, Milwaukee 0.41
MIPort Huron 0.19 WIFire Dept, Milw. 0.39
MIAllen Park 0.78 WIWaukesha 0.36
Average decrease regionwide = 0.51 ug/m3
6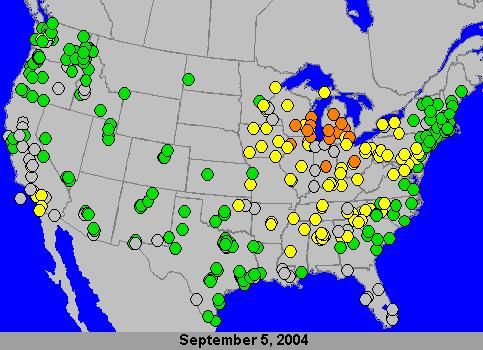
Temporal and Spatial Patterns of PM2.5
In order to examine temporal and spatial patterns of PM2.5 events, a dataset of PM2.5
high days was developed following the methodology proposed by Turner (2008). First
the dataset of all 24hour federal reference method PM2.5 measurements was reduced
to valid days, which are defined as days when a minimum of 70% of sites in the metro
region reported valid observations. The total valid days in each of the metro areas
analyzed here are reported in Table 2. Next a set of citywide high days was
developed, consisting of valid monitoring days on which a minimum of 60% of all FRM
PM2.5 concentrations in the urban area were greater than a threshold value. This
analysis examined threshold values of 25, 30, and 35 ug/m3. Table 2 lists the number
of days over the 30 ug/m3 threshold.
The frequency of elevated concentrations by city is shown in Fig. 5 for the 3 thresholds.
Spatial patterns were consistent regardless of which threshold was chosen. In general,
the eastern sites in the study region (Cleveland, Detroit, Cincinnati, Louisville,
Indianapolis) had the most days of high PM2.5 at all increments and the highest
percentage of high PM days. The eastern cities may be influenced more by their
proximity to emissions from industrial sources in the Ohio River Valley, which largely
forms the southern boundary of the region.
Table 2 Valid Monitoring Days and High Pm2.5 Days, by Urban Area
Valid Metrowide % Valid Days 24hr PM2.5
Monitoring high PM2.5 Classified as Design Value,
Days, 9907 days High 0507 (ug/m3)
Cleveland 943 60 6.4 42
Cincinnati 1033 61 5.9 41
Louisville 886 53 6.0 40
Indianapolis 1070 59 5.5 40
St Louis 1033 52 5.0 39
Detroit 991 73 7.4 43
Gary IN 1073 42 3.9 40
Chicago 1033 58 5.6 40
Milwaukee 1081 43 4.0 41
Minneapolis 974 15 1.5 27
(a)
Source: US EPA (www.epa.gov/air/airtrends/values.html)
7Ten Midwestern Metro Areas
Total # of Days During 19992007
MetroWide Ave 24 Hr PM2.5 Concentrations
> 35 ug/m3, > 30 ug/m3, > 25 ug/m3
180 164 166
145 145
150 133 135
# of Calendar Days
120 105 102
83 77 75
90 73 72 67 70
60 40 40 43 42 42 34 43
29 32 30
30 18 17 15 18
6
0
Cincinnati,
Indianapolis,
Chicago, IL
St. Louis,
Cleveland,
Gary, IN
Paul, MN
Milwaukee,
Louisville,
Detroit, MI
MplsSt.
MO
KY
OH
OH
WI
IN
Metro Area
Total Days: (9907): Metro Daily Av PM2.5 > 35 ug/m3
Total Days: (9907): Metro Daily Av PM2.5 > 30 ug/m3
Total Days: (9907): Metro Daily Av PM2.5 > 25 ug/m3
Figure 5. Frequency of Elevated PM2.5 Concentrations by City
Seasonal patterns of high PM2.5 concentrations also exhibit some geographic
differences, as shown in Figs. 6 (southern cities) and 7 (northern cities). Metro areas in
the south and central portions of the LADCO region experience the greatest number of
days with high PM2.5 levels during the warm months of June through September.
These cities are likely to experience the warmest temperatures of the urban areas
examined here. Warm temperatures and high humidity promote the formation of
secondary particulates, especially sulfates, which typically peak in warm weather.
Urban areas in the northern parts of the LADCO region exhibit a bimodal distribution of
high PM2.5 concentrations, with peaks in both the winter and summer (Fig. 7). Cooler
temperatures in these cities promote secondary nitrate formation in the winter (see
following section on PM2.5 composition).
Dayofweek differences are shown for the northern cities in Fig. 8. When present, day
ofweek differences can indicate the influence of industrial sources, which often operate
on a distinct weekly schedule. Traffic volumes can also influence these weekday
differences. In the cities shown in Fig. 8, Monday and Sunday had the fewest high
PM2.5 days, but only by a small margin. Assuming that the meteorological conditions
favoring high PM2.5 occur uniformly on all days of the week, these data suggest that
the relationship between known source emission patterns and high PM2.5 events is
weak. The southern cities showed even fewer differences.
8A measure of how coherent PM2.5 measurements are across each urban area was
developed by looking at the number of days per site above the 35 ug/m3 threshold that
are also defined as metrowide episode days, expressed as a percent. A high
percentage (80100%) indicates that most of a site’s high PM2.5 days occurred when
other sites in the metro area also experienced high concentrations, indicating that the
driving factor behind the elevated concentrations is occurring on a relatively large scale.
Lower percentages indicate that a site’s high PM2.5 days were occurring at times when
other nearby sites did not experience high concentrations, and possibly indicates the
influence of nearby local sources. For most sites, these percentages were above 80%.
The coherence measure is given for Detroit sites in Table 3. Dearborn, a site frequently
identified as strongly influenced by local sources, has a coherence measure of 73%; all
other sites are above 80%. Results for other cities are given in the supplemental
material. In these cities as well, sites with coherence measures below 80% were
typically industrial (e.g., 2 sites in Granite City, IL, St. Tikhon in Cleveland) or very near
highways (e.g., Ramsey Health Center in Minneapolis, Mayfair Pumping Station in
Chicago).
Cleveland, Cincinnati, Louisville, Indianapolis, St. Louis
("Southern / Central" Midwest Metro Areas): 19992007
Combined Total # of Days Per Month of Year
MetroWide Ave 24 Hr PM2.5 Concentrations
> 35 ug/m3, > 30 ug/m3, > 25 ug/m3
118 114
120
93 97
100
# of Calendar Days
80
62
54 52
60 50 50
40 38 39
40 33 30 29
24 23 27
21 20 22 21
17
20 1216 10 11 13
7 4 6 6 7
1 4 2
0
Jan Feb Mar Apr May Jun Jul Aug Sep Oct Nov Dec
Month of Year 1999 2007
Total Days: Month of Yr (9907): Metro Daily Av PM2.5 > 35 ug/m3
Total Days: Month of Yr (9907): Metro Daily Av PM2.5 > 30 ug/m3
Total Days: Month of Yr (9907): Metro Daily Av PM2.5 > 25 ug/m3
Figure 6. Frequency of Elevated PM2.5 Concentrations by Month (Southern and
Central Cities)
9Detroit, Gary, Chicago, Milwaukee, MinneapolisSt. Paul
("Northern" Midwest Metro Areas): 19992007
Combined Total # of Days Per Month of Year
MetroWide Ave 24 Hr PM2.5 Concentrations
> 35 ug/m3, > 30 ug/m3, > 25 ug/m3
80
64
57 55
60 52 53
# of Calendar Days
46 45
42
40 35
31 29 29 31
25 27 27
22 20 20
18 16 17 18
20 13 14 15
11 10 10
8 8
46 2 4 4
0
Jan Feb Mar Apr May Jun Jul Aug Sep Oct Nov Dec
Month of Year 1999 2007
Total Days: Month of Yr (9907): Metro Daily Av PM2.5 > 35 ug/m3
Total Days: Month of Yr (9907): Metro Daily Av PM2.5 > 30 ug/m3
Total Days: Month of Yr (9907): Metro Daily Av PM2.5 > 25 ug/m3
Figure 7. Frequency of Elevated PM2.5 Concentrations by Month (Northern Cities)
10Detroit, Gary, Chicago, Milwaukee, MinneapolisSt.Paul
("Northern" Midwest Metro Areas): 19992007
Combined Total # of Days Per Day of Week
MetroWide Ave 24 Hr PM2.5 Concentrations
3 3 3
> 35 ug/m , > 30 ug/m , > 25 ug/m
99
100
81 81
73 76
# of Calendar Days
80 66
60 48 44
49
39 40
34
40 27 28
19 20 18 17
20 12 11 12
0
Mon Tue Wed Thu Fri Sat Sun
Day of Week 1999 2007
Total Days: Day of Week (9907): Metro Daily Av PM2.5 > 35 ug/m3:
Total Days: Day of Week (9907): Metro Daily Av PM2.5 > 30 ug/m3:
Total Days: Day of Week (9907): Metro Daily Av PM2.5 > 25 ug/m3:
Figure 8. DayofWeek Variation in High PM2.5 Concentrations (Northern Cities)
Table 3. Coherence of High PM2.5 Days across the Detroit Network
Days > 35
Days > 35 ug/m3 on metro Coherence
AQS ID Site Name ug/m3 wide episodes Measure (%)
261630001 Allen Park 33 33 100
261630015 6921 West Fort 41 43 95
261630016 6050 Linwood 37 37 100
261630019 E Seven Mile Rd 26 29 90
261630025 38707 Seven Mile Rd 26 28 93
261630033 Dearborn 52 71 73
261630036 3625 Biddle Ave 29 36 81
261630038 Newberry 7 7 100
261630039 2000 W. Lafayette 3 3 100
11PM2.5 Composition
Data from the Speciation Trends Network (STN) were examined to compare the
composition of PM2.5 on episode days to nonepisode days. Mass was reconstructed
according to protocols developed by the IMPROVE program. Total PM2.5 mass on
episode days is generally about twice the mass on nonepisode days. Of that, 40 to
50% is ammonium sulfate. Organic carbon accounts for the next highest proportion of
mass (2530%), and ammonium nitrate makes up most of the rest (Fig. 9). The relative
proportions of these species on episode days are different from nonepisode days.
Ammonium sulfate increases most (between 2.5 and 3.5 times its nonepisode
concentrations). Ammonium nitrate increases by a factor of 1.5 to 2.5, while organic
carbon increases by 1.5 to 2. Other components of PM2.5 (elemental carbon, soil) are
only modestly higher, usually enriched by less than 1.5 times the nonepisode
concentrations (Fig.10). These findings were consistent for each urban area examined.
The composition data were also examined by season; see Figs. 11 and 12 for summer
(JulSep) and winter (JanMar) plots, respectively. Ammonium sulfate dominates
summer PM2.5 at all sites, contributing half to twothirds of the mass on episode days,
usually at least double its mass on nonepisode days. Organic carbon concentrations
are also significant, but
Fig. 9 PM2.5 Composition on Episode and Nonepisode Days in Urban Areas (2005)
12increase only slightly on summer episode days compared to nonepisode days, which is
somewhat surprising given that the warm, humid conditions that promote conversion of
SO2 to sulfate also favor secondary formation of organic carbon particles. Ammonium
nitrate is negligible in the summer, and crustal material and elemental carbon increase
proportionally to total mass on episode days. During the winter, ammonium nitrate
plays a much more important role, generally contributing as much or more to PM2.5
mass than ammonium sulfate. Comparing episode to nonepisode days, ammonium
nitrate and ammonium sulfate are about equally enriched during the winter. Organic
carbon contributes significant mass in both summer and winter, although the increase
from nonepisode days to episode days is smaller than for sulfate or nitrate.
Differences among the urban areas were slight, with some cities’ particles dominated
more by sulfate and others more by nitrate. Overall, the compositional similarities
among the urban areas support the idea that high PM2.5 episodes are often regional
events, influenced by regional sources of sulfate, nitrate, and organic carbon. More
detailed results for individual cities, by year and season, are given in the supplemental
material.
Fig. 10 Ratio of Bulk Species Concentrations on High Days to All Days at Allen
Park, MI (source: Wade 2008).
13Fig. 11. PM2.5 Composition on Summer 2005 Episode and Nonepisode Days
Fig. 12. PM2.5 Composition on Winter 2005 Episode and Nonepisode Days
14Indiana Urban/Rural Speciations
2006/2007
12
10
8
Conc., ug/m3
6
4
2
0
2
EC Nitrate OC Soil Sulfate EC Nitrate OC Soil Sulfate
Episode Nonepisode
Darker bars are urban speciated monitor (Washington Park), Lighter bars are rural speciated monitor
(Mechanicsburg) average
Fig 13. UrbanRural Comparison of Major PM2.5 Components
Urban and rural PM2.5 composition was compared in another analysis with similar
results. For each urban area studied, a rural monitor was identified to serve as an
indicator of the regional background concentrations of PM2.5 entering the city. The
difference between this rural background monitor and the urban monitor concentrations
for each PM2.5 component species was calculated and plotted to estimate the urban
source contribution to PM2.5. Figure 13 shows results for Indianapolis. Results for
other cities are given in the supplemental material. For each species, the lighter part of
the bar indicates the rural background concentration and the darker part of the bar
indicates the urban contribution added to the background. Soil and elemental carbon
make negligible contributions to total mass (although elemental carbon has significant
health impacts so it cannot be ignored). Nitrate concentrations are actually higher at the
rural background site than in the urban area. The urban area contributes about 10% of
the total sulfate, and about 25% of organic carbon. These proportions do not change
significantly from episode to nonepisode days.
These comparisons are another indication that control measures for the 24hour
NAAQS would probably be most effective if they targeted regional ammonium sulfate,
ammonium nitrate, and organic carbon, because the background concentrations of
those species are elevated before they even enter the urban areas. The comparatively
small urban increment added to the high background concentrations is often enough to
push concentrations above the 35 ug/m3 standard. Controlling local urban sources of
organic carbon could also be effective, since OC dominates the small urban increment.
15Source Apportionment
Sonoma Technology conducted a source apportionment of Speciation Trends Network
(STN) data for six sites, two each in Detroit, Cleveland, and Chicago (Wade, 2008).
Using Positive Matrix Factorization, source contributions were estimated for each of the
six sites for all data available through 2006. Source estimates for high PM2.5 days
were then compared with estimates for average days, for the entire data record and
also by season. High days were split into two subsets, those with PM2.5 between 30
and 35 ug/m3, and those with PM2.5 greater than 35 ug/m3. STN composition (bulk
species and metals) was also compared on high days and all days.
Figure 14 shows the PMF contributions for Allen Park, a suburban Detroit site, and
Dearborn, a site a few miles away in a heavily industrial area of Detroit. The Allen Park
PMF results indicate that the sources contributing most on high days are secondary
sulfates and secondary nitrates, just as shown in the previous sections. The other
source categories identified in the PMF modeling increased only slightly on high PM2.5
days. These results imply that regional sources of ammonium sulfate and ammonium
nitrate are the most influential factors on high concentration days at Allen Park. In
contrast, the Dearborn PMF results show less influence of sulfate and nitrate on high
days (compared to Allen Park) and much more influence from local sources. In
particular, contributions for a local zinc source and a local steel source approximately
triple on high days.
The metals data for Dearborn are shown in Fig 15 as a ratio of high day concentration
to average day concentration. Ratios greater than 1 indicate species that are enriched
on high days. Especially for the highest days (>35 ug/m3), metals concentrations are
usually 2.5 to 3 times higher than concentrations on average days. Dearborn is strongly
influenced by local sources that contribute disproportionate amounts of several metal
species, unlike its neighboring site at Allen Park, which shows impacts mostly from
regional sulfate and nitrate. Results for the other cities and sites were similar to Allen
Park, in that industrial sources contributed proportionally less on highconcentration
days than on average days.
1645 Mixed Ind.
40 Steel
Ind. Zn
Concentration (µg/m )
35 Soil
3
OM
30
EC
25 Sec. Sulfate
Sec. NO3
20
15
10
5
0
All Days 3035 >35
Concentration Range of Total PM 2.5 (µg/m3)
(a) Allen Park
45 Ind. Lead
40 Steel
Ind. Zinc
Concentration (µg/m )
35 Soil
3
OM
30
EC
25 Sec. SO4
Sec. NO3
20
15
10
5
0
All Days 3035 >35
Concentration Range of Total PM 2.5 (µg/m3)
(b) Dearborn
Fig. 14 PMF Contributions at (a) Allen Park, MI, and (b) Dearborn, MI (source:
Wade 2008).
17Fig. 15 Ratios of Metal Concentrations on High Days to All Days (source: Wade
2008).
PM2.5 Sensitivity to Changes in Precursor Concentrations
Reducing ambient PM2.5 can be accomplished by reducing concentrations of its
precursor gases SO2, NOx, and NH3, but the relationship between particulates and
gases is complex and nonlinear. Blanchard (2008) conducted a sensitivity study to
analyze the response of PM2.5 to changes in ambient concentrations of sulfate, nitric
acid, and ammonia at 15 sites in the LADCO/Cenrap ammonia monitoring network (Fig.
16). At these sites, the mean predicted PM2.5 mass decreased by:
· 0.8 to 3.6 ug/m3 in response to modeled 50% reductions of sulfate
· 0.4 to 1.8 ug/m3 in response to modeled 50% reductions of total nitrate
· 0.4 to 2.6 ug/m3 in response to modeled 50% reductions of total ammonia
Combined reductions of sulfate and total nitrate were approximately additive, whereas
combined reductions of total nitrate and total ammonia were not. For example, Fig. 17
shows the sensitivity of PM2.5 to sulfate, nitrate, and ammonia reductions for the
Mayville, Wisconsin, site. Complete results for all sites are given in Blanchard (2008).
Reductions were seasonally and geographically sensitive. Sulfate reductions are most
effective in the summer, while nitrate and ammonia reductions are most effective in the
winter. At Bondville IL and sites to the east, ammonia reductions are more effective
than nitrate. At Mayville WI and sites to the west, nitrate reductions are as effective or
more effective than reductions of ammonia. The geographic differences arise because
of the varying concentrations of precursor gases across the region. Ammonia
18concentrations tend to be highest in the north and west, and consequently PM2.5 is less
sensitive to changes in ammonia concentrations there; similarly, nitrate concentrations
tend to be highest in the south and east of the region, reducing the sensitivity of PM2.5
to changes in nitrate concentration there. These results suggest that sulfate controls
would be effective across the Midwest. Ammonia and nitrate controls would have
varying effectiveness, depending on the existing concentrations of precursors in a
particular location. This study did not address the potential for transported precursors to
impact PM2.5 concentrations in distant regions.
Sites
IMPROVE
Meteorological
Midwest Network
STN
Great River Bluffs MN
Mayville WI
Allen Park MI
Blue Mounds MN
Lake Sugema IA
Quaker City OH
Bondville IL
Indianapolis IN
Athens OH
Reserve KS Cincinnati OH
Pleasant Green MO
Mammoth Cave KY
Seiling OK Cherokee Nation OK
Holdenville OK
Fig. 16 Locations of Ammonia Monitoring Sites (LADCO/Cenrap sites shown as red
diamonds; other sites used for comparison of speciated PM and meteorological
measurements). Source: Blanchard 2008.
19Wisconsin Mayville
150 + + + + + + 150 + + + + + +
11 14
15
125 + + + + + + 125 + + + + + +
14 13
Mean Total Nitrate (%)
Mean Total Nitrate (%)
100 + + + + 13 + + 100 + + + + + +
12
11 12
10 10
75 + + + + + + 75 + + + + + +
9
50 + + + + + + 50 + + + + + +
8 11
25 + + + + + + 25 + + + + + +
0 0
0 25 50 75 100 125 150 0 25 50 75 100 125 150
Mean Sulfate (%) Mean Total Ammonia (%)
Fig 17. Isopleths of mean predicted PM2.5 mass concentrations from SCAPE model
results for Mayville, Wisconsin. Ammonia concentrations were fixed at current levels
(left) and sulfate concentrations were fixed at current levels (right). Source: Blanchard
2008.
Meteorological Analyses
Previous analyses have shown that high PM2.5 concentrations are often associated
with specific meteorological conditions. This association was explored in several ways:
1) wind roses, 2) CART analysis, 3) back trajectory analysis, and 4) synoptic conditions
analysis. Each of these is described below, and complete results for each urban area
are in the supplemental material.
Wind Roses
Wind roses were developed from National Weather Service observations made at local
airports in each urban area. The Lakes Environmental program, WRPlot View, was
used to generate the plots for annual and seasonal summaries of wind speed and
direction. Seasonal roses for Indianapolis are shown in Fig. 18. Winds are
predominantly from the west and south most of the year, with stronger and more varied
winds present in the spring. Wind roses were also generated for the predefined set of
episode days described earlier. This plot for Indianapolis is shown in Fig. 19 along with
the episode day roses for the other urban areas.
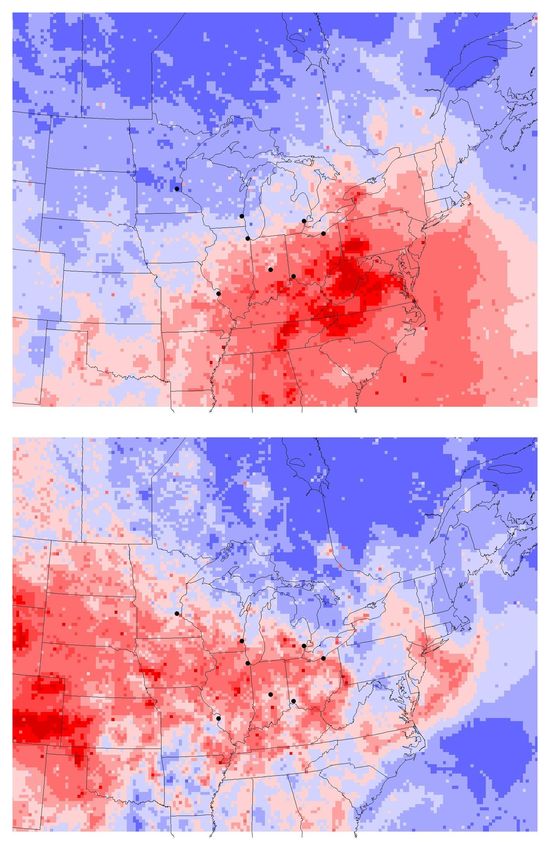
The episode rose for Indianapolis is distinguished by southerly winds at slower speeds
than are typical for most of the year. It shares these characteristics with most of the
20other urban areas examined. This similarity among widely separated sites is a possible
indication that the episode days are driven by regional meteorology more than local
emission conditions. Minneapolis and St. Louis, the westernmost sites, have a more
southeasterly component to episode winds, which is consistent with regional flow from
the more industrialized areas east of them.
Figure 18. Seasonal Wind Roses for Indianapolis
21Figure 19 EpisodeDay Wind Roses for 8 Urban Areas
22CART Analysis
Another way to quantify the relationship between multiple meteorological variables and
PM2.5 is Classification and Regression Tree (CART) analysis. This technique, also
known as binary recursive partitioning, was developed in 1984 by Breiman and
Friedman. It has several advantages as a tool for data mining and predictive modeling.
The tree produced represents a model or decision tree in which each node (branch) is
determined by splitting the dataset on the basis of the one variable that results in the
best separation as defined by values of the dependent variable (in this case, PM2.5
concentration). The splitting rule is expressed in natural language – for example, is
temperature less than 75ºF – so the output trees are easy to interpret. At every branch,
every variable is tested for its usefulness in further splitting. This exhaustive search for
splitters can make CART computationally intensive.
A CART analysis (regression tree) was applied to the 19992007 PM2.5 and
meteorology data for the 8 targeted Midwestern urban areas. The purpose was twofold:
(1) to categorize specific PM2.5conducive conditions for each city, and (2) assess
PM2.5 trends, using the CART bins as meteorologically adjusted results. The
application of the regression tree was straightforward, using CART software from
Salford Systems. Emphasis was on finding trees that were able to distinguish the
extreme PM2.5 days and also several subsets of moderately high PM2.5 days. Low
PM2.5 conditions were of less interest. The model was constrained to include at least
200 days in each terminal node, in order to have a more robust distribution of days
across the years. Trees were developed using a randomly selected 80% subset of the
data (the learning subset) and tested using the remaining 20% (the test subset).
The average daily 24hour concentration at these monitors, by city, was used as the
dependent variable. Meteorological variables included temperature; dewpoint;
pressure; relative humidity; solar radiation; cloud cover; morning and afternoon mixing
height; wind direction (as northsouth and eastwest component vectors); wind speed;
lake breeze indicator where relevant; day of week; temperature increase or decrease
from previous day; pressure increase or decrease from previous day; previousday
temperature, pressure, wind speed, wind direction, and ozone; and 2day and 3day
average wind speed and temperature. The years from 19992007 were modeled for
each city. Trends in PM2.5 concentrations were then examined by comparing the
change in average bin concentrations in an effort to control for the effect of
meteorological variability.
PM2.5 data were extracted from EPA’s Air Quality System for the Consolidated
Metropolitan Statistical Area (CMSA) associated with each city. Meteorological data
23were collected from National Weather Service TDL hourly observation tapes. In each city the primary airport data were used to represent daily conditions for all monitors. Meteorological and air quality variables used in the model are listed in Table 4. Table 4 Variables included in CART analysis Meteorological parameter Variable name Solar radiation, MJ/m2/day solar Cloud cover, % clouds Mixing height, morning (12Z) and afternoon (00Z), m ammixht, pmmixht Conditions aloft: am700temp, am850temp, morning and afternoon (12Z, 0Z) temperature at 850 am700ws, am850ws, and 700 mb (deg C); am700_s_wn, am700_w_wn (>0 is wind from wind speed at 850 and 700 mb (knots); south or west, 0 is wind from south wind direction (u,v components) or west,
terminal node 13 are all characterized by ozone concentrations greater than 0.080 ppm,
morning dewpoints greater than 60°F, and morning wind speeds aloft less than 9.5
knots. One characteristic of the CART methodology is that variables can be used
multiple times in the decision tree, as ozone is here. In Chicago, of the 25,389 sitedays
analyzed (in the 80% learning subset), 248 met the Node 13 meteorological criteria and
they had an average PM2.5 concentration of 35.8 µg/m3. This node represents
summer episodes with a strong photochemical component.
Regional similarities were apparent when comparing the relative importance of
meteorological variables from city to city. Extended 3day periods of slow wind speeds
were the most important factor in high PM2.5 across the region. Ozone was important
in summer episodes, especially in Chicago and St. Louis. High relative humidity and
dewpoints were important yearround. Southerly wind flow was important in most cities,
although St. Louis episodes have a more easterly component. Temperature, mixing
height, stability, and winds aloft were other variables that ranked high in importance.
Not all of these variables appear as splitters in every tree; the relative importance of
each variable is assessed based on its importance over all possible nodes and splits. In
any one node, only one variable will be the best splitter although another may be a
close second best (a good surrogate). The secondbest variable may be a good
surrogate for numerous splits without ever being selected as the best primary splitter.
Its usefulness as a surrogate for multiple splits leads to its higher importance.
Once the model was established for each city, the distribution of PM2.5 concentrations
among all nodes was examined with a series of box plots as shown in Fig. 21 for
Chicago. This figure is based on the entire sample, not the 80% learning sample. Node
13 is typical of summer episode days and is characterized by high ozone, high morning
dewpoints, and low wind speeds aloft. Node 5 is typical of winter episodes and is
characterized by high humidity and prolonged low wind speeds and temperatures.
Another useful plot for examining the CART results is shown in Fig. 22. This timeline
shows the identified episode days by time, colorcoded by node. It is easy to see which
nodes (i.e., which meteorological conditions) occur most frequently and what the range
of concentrations is during those events. For example, node 5 is the most frequent,
occurring several times each winter.
The groups of meteorologically similar days identified by the CART model were
examined next for trends over the 19992007 period. Because each node shares
similar characteristics, any change in concentration over the period is assumed to be
due to changes in emissions rather than to changes in meteorology. Only high
concentration nodes (>20 ug/m3) were examined. Figure 23 shows the trends for the
25Chicago nodes; trends for other cities are given in the supplemental material. In most
cities, trends were flat or slightly downward. Occasional strong trends (for example,
Chicago nodes 6 and 13) can usually be attributed to nodes that have fewer days than
average, and consequently more unstable trends.
26Fig. 20 Chicago CART Tree
27Figure 21. Distribution of Chicago Episode Days among CART Nodes. Boxes are
labeled with the % episode days in the node (>30% in red), the total number of days in
the node (>30% in red), and the number of episode days in the node (>100 in red). Box
width is scaled to total days in node.
Figure 22. Timeline of Chicago Episodes, by Node
28Figure 23. Trends in Chicago HighConcentration Nodes
Trajectory Analysis
Back trajectories are another way to explore the meteorology associated with high
concentrations of PM2.5. A trajectory tracks the position of a parcel of air as it is
transported by the wind. By tracking air parcels sampled at a monitor back in time, we
gain information about where the air originated and what sources it passed over on its
path to the monitor. Collecting trajectories for many samples and looking at them
together as an ensemble can reveal patterns over time that indicate which source
regions influence a monitor at particular times of the year or, in this case, during high
PM2.5 concentration events.
Back trajectories were calculated using HYSPLIT Version 4 (NOAA, 2008) for samples
collected at speciation monitors in the eight urban areas from 20002007. Hourly
endpoints from the back trajectories were plotted using ARCGIS. Each endpoint (1 per
hour, 72 per trajectory) has a concentration associated with it that corresponds to the
measured species recorded at STN monitor on the trajectory start date. No attempt is
made to distribute concentrations along the trajectory. Each hourly endpoint of a
trajectory shares the same concentration as the start date. The ARCGIS Spatial
Analyst extension was used to grid this concentration data for PM2.5 and its component
29species using a grid size of approximately 20 km and an inverse distance weighting
algorithm. These gridded concentrations are shown for ammonium sulfate and nitrate
in Fig. 24. The plots are displayed in increments of standard deviation from the mean to
better distinguish areas of higher concentration. Darker red colors indicate higher
concentrations and darker blue colors indicate lower concentrations.
Distinct patterns emerge from this analysis. On days when sulfate concentrations were
high, air masses were most likely to travel through the Ohio River Valley, the Pittsburgh
area, central West Virginia, central Tennessee, central Virginia, or eastern Virginia and
North Carolina. These areas have high numbers of coalburning power plants that emit
SO2. In contrast, on days when nitrate concentrations were high, air masses were most
likely to come from west of the LADCO region, passing through Illinois, southwestern
Minnesota, Iowa, and states further west. These regions coincide with areas of high
ammonia emissions from agriculture. For both sulfate and nitrate, the back trajectory
analysis reveals areas that are distant from the monitors but that likely contribute
significantly to elevated concentrations of these PM2.5 components.
30Fig. 24 Back Trajectory Analysis of High Sulfate Source Regions (top) and High Nitrate
Source Regions (bottom). Darker red colors indicate higher concentrations and darker
blue colors indicate lower concentrations.
31Synoptic Meteorology
The largescale synoptic conditions during four regionwide episodes were analyzed in
detail as part of this analysis. The four episodes were September 26, 2004; January
28February 7, 2005; June 2330, 2005, and December 1722, 2007. Each of these
episodes was accompanied by elevated PM2.5 concentrations in all 8 of the urban
areas examined in this report. Although they occurred at different times of the year and
the PM2.5 composition consequently varied among the episodes, there were notable
similarities in meteorology. In particular, each was characterized by a high pressure
system that tended to persist longer than usual, creating stagnant conditions and often
strong inversions that allowed pollutant concentrations to build up under the limited
mixing height. These high pressure systems also tend to slowly pull warmer, moist air
from the southeast (the Ohio River Valley and further southeast). Suppressed
atmospheric mixing and warm moist air constitute an ideal recipe for promoting both
sulfate formation in the summer and nitrate formation in the winter. The September
2004 episode is discussed in more detail below; complete descriptions of this and the
other three episodes are given in the supplemental material.
In early September 2004, a combination of meteorological factors resulted in a late
summer Midwestern fine particle episode that caused elevated fine particle levels from
states along the Mississippi River to Ohio. On September 1, a strong Canadian surface
high pressure (1029 mb) system moved southeastward from Ontario toward New
England nudging tropical storm Gaston into the North Atlantic. Surface temperatures
were in the mid 70s to low 80s ºF throughout the Midwest and winds were light and
variable. A surface high over the Oklahoma panhandle associated with a weak ridge
situated over the Plain states induced warm air advection from the Southwest leading to
temperatures exceeding 90 ºF by the end of the multiday episode. A surface low over
southern Alberta hinged a stationary front extending from the center of the low to central
Wisconsin. During the next two days, the Canadian surface high continued sliding to the
southeast. Winds remained light and variable. By Friday, September 3, the surface high
was situated just off the New England coast and the surface low was located near the
ManitobaOntario border. The 500 mb ridge remained over the central Canadian
provinces and continued tilting westward. In addition, Frances, a category 3 hurricane
with winds of ~ 125 mph, pushed westward into the Bahamas.
This placed the Midwest solidly in the surface low’s warm sector. Stagnating
Midwestern surface conditions, enhanced by the presence of Hurricane Frances, led to
increasing fine particle concentrations throughout the Midwest. Average 24hr fine
particle concentrations ranging from the mid20s µg/m3 to nearly 50 µg/m3 in the
Midwest. Hurricane Frances acted as a blocking mechanism and inhibited the forward
32progression of weather systems over North America. Surface high temperatures
remained in the low to mid80s ºF in the Midwest for the remainder of the episode and
very little precipitation fell. During the same period, 850 mb temperatures averaged
between 57 64 ºF and winds were light and variable at that level.
On September 4, the surface high was located over southern Ohio, and the ridge,
having moved eastward, was firmly centered over the Great Lakes (Figure 25). The
surface low retrograded northwestward into northern Manitoba province. The associated
stationary front sagged along the USCanadian border just north of the Great Lakes.
Hurricane Frances, now a category 2 hurricane, was located over Grand Bahama Island
off the Florida coast. It made landfall during the late night hours of September 4. The
presence of Frances prevented the surface high from proceeding further eastward. The
high over Ohio slowly advected warm, moist subtropical air into the Midwest. Dew
points climbed into the midtoupper 60s ºF throughout the region. On this date, several
Midwestern FRM monitoring sites measured fine particle concentrations in the USG
range. Concentrations ranged from 24.0 µg/m3 in Des Moines, IA to as high as 43.3
µg/m3 in Indianapolis, IN.
Figure 25
September 4, 2004 – Surface Weather Map
NOAA Daily Weather Map http://www.hpc.ncep.noaa.gov/dailywxmap/
33Further intensification of the fine particle episode occurred on September 5 (Figure 26).
Once again monitors throughout the region measured elevated concentrations as warm,
humid conditions prevailed. For most sites, September 5 was the day with the peak
calendar concentrations during this episode. The synoptic surface high pressure system
gave way to the surface low. With the northwestward progression of Hurricane Frances
across the Florida peninsula, the surface high rapidly shifted northeastward to eastern
Quebec while the surface low in Canada progressed to the southern end of Hudson
Bay.
Figure 24
AIRNow PM2.5 Maps – September 5 & 6, 2004
3
Note, at this time, the USG concentration for PM2.5 was 40.5 µg/m and the USG 8hour ozone concentration was 85 ppb.
On September 6, the surface low retrograded southwestward into western Ontario,
however the associated cold front progressed eastward into Wisconsin and Illinois
bringing heavy rains to the Plain states, Minnesota and Iowa. The 500 mb ridge,
followed by a trough over the central U.S, shifted eastward over New England and the
MidAtlantic states. In the Midwest, maximum surface temperatures reached the lowto
mid 80s ºF and low temperatures remained in the mid60s ºF throughout the region.
Hurricane Frances crossed the Florida peninsula and entered the northeastern Gulf of
Mexico as a tropical storm. That evening Frances made a final landfall in the Florida
panhandle. The storm continued moving northwestward until the morning of September
7, where the cold front nudged the weakening tropical system northeastward. The cold
front not only helped shift tropical depression Frances eastward but it ushered in
another Canadian high pressure system bringing cleaner air to the Midwest.
Sulfate and nitrate concentrations were measured in Indianapolis during the episode
(Figure 27). Nitrate concentrations rarely exceeded 2 µg/m3, while sulfate
34concentrations averaged above 10 µg/m3 and peaked at 24.2 µg/m3 on September 5.
Sulfate was clearly driving the elevated PM2.5 concentrations during this episode.
Figure 27
Sulfate & Nitrate Concentrations Indianapolis, IN
September 2 6, 2004
Concentration (ug/m3)
30
25
20
Sulfate
15
Nitrate
10
5
0
00
00
00
00
00
0
0
0
0
0
:0
:0
:0
:0
:0
0:
0:
0:
0:
0:
12
12
12
12
12
Time of Day
Conclusions
· Nonattainment of the 24hour PM2.5 NAAQS is a widespread problem, with 57 of
126 monitors in LADCO states exceeding the standard in 20052007. Most of
the nonattainment monitors are in urban areas.
· Since measurement of PM2.5 began in 1999, concentrations on the highest 90%
days have fallen by about 0.5 ug/m3/year. Trends are consistently downward at
all monitors with long term records. Meteorologicallyadjusted trends (based on
the CART methodology), however, are relatively flat, suggesting that the actual
trends are driven more by yeartoyear variations in meteorology (i.e., occurrence
of meteorologically conducive episodes) than by changes in emissions.
· Episodes of elevated concentrations generally occur across broad geographic
areas, involving multiple cities and states. PM2.5 composition during an episode
is similar across a city or affected area and is driven primarily by higher levels of
ammonium sulfate during all seasons at all sites. Higher levels of ammonium
nitrate is an important component during the winter, especially at northern sites in
the LADCO region. Organic carbon is present in significant concentrations
during both summer and winter episodes.
35· High daily concentrations depend on specific meteorological conditions:
stagnant air masses with high pressure, slow wind speeds, high relative humidity,
and southerly winds. The longer these conditions persist, the higher
concentrations become, until a change in weather patterns brings less polluted
air into the region.
· Local pollution sources can also be important contributors on high PM2.5 days in
heavily industrial locations.
.
Possible Approaches for Decreasing PM2.5 Concentrations during Episode
Conditions
· Regional reductions in SO2 will be effective yearround and at all sites. Based
on LADCO’s latest regional emissions inventory, the largest sources of SO2
emissions are electrical generating units (EGUs) (i.e., about 80%) and other point
sources, such as industrial boilers, refineries, and cement plants (i.e., about
15%).
· Analysis of Midwest NH3 data show that during winter months and on a high
winter PM2.5 day, “…the sensitivity to nitrate is greater than the sensitivity to
sulfate…” and furthermore, “;;;decreases in ammonia yield lower predicted
PM2.5 than decreases in total nitrate at the majority of sites.” This suggests that
regional reductions in NH3 in the winter will be effective.
· Although less effective than NH3 reductions, regional reductions in NOx will be
most effective in the winter and more effective at northern sites. Extending the
NOx reductions to the summer would also produce benefits for ozone.
· Regional reductions in organic carbon mass will be effective yearround.
Because a significant portion of the urban PM2.5 increment (i.e., mass added in
the urban area above the regional background) consists of organic carbon, local
controls on OC will also be effective. Although recent studies indicate that
biogenic sources contribute anywhere from 15% – 30% to total OC in the
summer (and a lesser percentage in the winter), there remains a large fraction of
OC that is controllable.
REFERENCES
Blanchard, C.L., and S. Tanenbaum, Analysis of Inorganic Particulate Matter Formation
in the Midwestern United States, final report for LADCO (Dec. 2008).
Breiman, L., J. Friedman, R. Olshen, and C. Stone, Classification and Regression
Trees, Pacific Grove, CA: Wadsworth (1984).
36You can also read