The Molecular Genetics of Red and Green Color Vision in Mammals
←
→
Page content transcription
If your browser does not render page correctly, please read the page content below
Copyright 1999 by the Genetics Society of America
The Molecular Genetics of Red and Green Color Vision in Mammals
Shozo Yokoyama and F. Bernhard Radlwimmer
Department of Biology, Syracuse University, Syracuse, New York 13244
Manuscript received April 1, 1999
Accepted for publication June 16, 1999
ABSTRACT
To elucidate the molecular mechanisms of red-green color vision in mammals, we have cloned and
sequenced the red and green opsin cDNAs of cat (Felis catus), horse (Equus caballus), gray squirrel (Sciurus
carolinensis), white-tailed deer (Odocoileus virginianus), and guinea pig (Cavia porcellus). These opsins were
expressed in COS1 cells and reconstituted with 11-cis-retinal. The purified visual pigments of the cat,
horse, squirrel, deer, and guinea pig have lmax values at 553, 545, 532, 531, and 516 nm, respectively,
which are precise to within 61 nm. We also regenerated the “true” red pigment of goldfish (Carassius
auratus), which has a lmax value at 559 6 4 nm. Multiple linear regression analyses show that S180A,
H197Y, Y277F, T285A, and A308S shift the lmax values of the red and green pigments in mammals toward
blue by 7, 28, 7, 15, and 16 nm, respectively, and the reverse amino acid changes toward red by the same
extents. The additive effects of these amino acid changes fully explain the red-green color vision in a wide
range of mammalian species, goldfish, American chameleon (Anolis carolinensis), and pigeon (Columba
livia).
M ANY long wavelength- (or red-) sensitive and mid-
dle wavelength- (or green-) sensitive visual pig-
ments absorb light maximally (lmax) at z560 nm and
amino acid changes toward red by the same extents
(Yokoyama and Radlwimmer 1998). More recent anal-
yses show that the lmax values of red and green pig-
530 nm, respectively. It has been shown that the differ- ments of cat (Felis catus), dog (Canis familiaris), goat
ence in the color sensitivities of the two types of pig- (Capra hircus), rabbit (Oryctolagus cuniculus), and rat
ments is due mainly to amino acids AFA (A, F, and A (Rattus norvegicus) are accurately predicted by this “five-
at sites 180, 277, and 285, respectively) in the green sites” rule, but the orthologous pigments of white-tailed
pigment and SYT at the corresponding sites in the red deer (Odocoileus virginianus), gray squirrel (Sciurus caro-
pigment, although amino acids at sites 277 and 285 linensis), guinea pig (Cavia porcellus), and bottlenose
have a larger effect than those at 180 (Yokoyama and dolphin (Tursiops truncatus) differ by z10 nm from the
Yokoyama 1990; Neitz et al. 1991; Chan et al. 1992; predicted values (Radlwimmer and Yokoyama 1998;
Merbs and Nathans 1993; Asenjo et al. 1994). How- Yokoyama and Radlwimmer 1998). A potential prob-
ever, some exceptions to this “three-sites” rule have been lem with this argument is that the lmax values of many
found. That is, having red pigment-specific amino acids of these red and green pigments are estimated indirectly
AYT at the three critical sites, the green pigments in using the flicker photometric electroretinogram (ERG).
mouse, rat, and rabbit have lmax values at z510 nm. An inherent problem with this method is that responses
These extreme blue shifts in the lmax values are fully from rods and different types of cones can contribute
explained by two amino acid changes, H197Y (H → Y to the recorded signals and the separation of a specific
at site 197) and A308S (A → S at site 308; Sun et al. photoreceptor cell type is sometimes difficult (Neitz
1997; Radlwimmer and Yokoyama 1998). Thus, red- and Jacobs 1984).
green color vision appears to be based on amino acids Fortunately, the lmax values of virtually any pigment
at five sites: 180, 197, 277, 285, and 308. can now be measured by expressing specific opsins in
Using the results from the mutagenesis experiments cultured cells, reconstituting them with 11-cis-retinal,
of the human red pigment (Merbs and Nathans 1993; and measuring the lmax values of the purified pigments
Asenjo et al. 1994; Sun et al. 1997) and the mouse green (Yokoyama 1997). Here, using in vitro assays, we have
pigment (Sun et al. 1997), we have suggested that S180A, measured the lmax values of the red and green pig-
H197Y, Y277F, T285A, and A308S shift the lmax values ments of cat (F. catus), horse (Equus caballus), gray squir-
of the pigments toward blue by z7, 28, 10, 16, and 18 rel (S. carolinensis), white-tailed deer (O. virginianus),
nm, respectively, in an additive fashion and the reverse and guinea pig (C. porcellus). Using multiple regression
analysis based on these and other lmax values of mam-
malian pigments, we estimated the magnitudes of the
lmax shifts of the pigments caused by the amino acid
Corresponding author: Shozo Yokoyama, Biological Research Labora-
tories, Department of Biology, Syracuse University, 130 College Pl., changes at sites 180, 197, 277, 285, and 308. The results
Syracuse, NY 13244. E-mail: syokoyam@mailbox.syr.edu show that the additive effects of these amino acid
Genetics 153: 919–932 ( October 1999)920 S. Yokoyama and F. B. Radlwimmer
changes fully explain virtually all observed lmax values using the sequence information obtained by Johnson et al.
of the red and green pigments not only in mammals (1993; Figure 1).
For each set of primers, cDNA was reverse transcribed at
but also in other vertebrates. 428 for 1 hr and at 958 for 5 min, and then PCR was carried
out for 30 cycles at 948 for 45 sec, 558 for 1.5 min, and 728
for 2 min. PCR products were gel isolated and subcloned
MATERIALS AND METHODS into the T-tailed EcoRV-digested Bluescript plasmid vector with
T-overhang attached to 39-ends (Hadjeb and Berkowitz
cDNA cloning and DNA sequencing: Cat (F. catus), horse 1996). Nucleotide sequences of the entire region of the cDNA
(E. caballus), and guinea pig (C. procellus) retinas were obtained clones were determined by cycle sequencing reactions using
from Pel-Freez (Rogers, AR), while gray squirrel (S. caro- the Sequitherm Excell II Long-Read kits (Epicentre Technolo-
linensis) and white-tailed deer (O. virginianus) retinas were gies, Madison, WI) with dye-labeled M13 forward and reverse
isolated from road-killed animals. The goldfish (Carassius aura- primers. Reactions were run on a LI-COR 4200LD automated
tus) retinas were isolated from individuals purchased from a DNA sequencer (LI-COR, Lincoln, NE).
local pet store. Total RNAs were prepared from one retina Expression and spectral analyses of pigments: The PCR-
each by acid thiocyanate-phenol-chloroform extraction amplified cDNAs were subcloned into the EcoRI and SalI re-
(Chomczynski and Sacchi 1987). On the basis of their partial striction sites of the expression vector pMT5 (Khorana et
cDNA sequences (Yokoyama and Radlwimmer 1998) and al. 1988). These plasmids were expressed in COS1 cells by
the 59 and 39 flanking sequences of the orthologous genes of transient transfection. The pigments were generated by
other mammals, the 59- and 39-ends of the red and green incubation with 11-cis-retinal and purified in buffer W1 [50
opsin cDNA fragments of the five mammalian species were mm N-(2-hydroxyethyl) piperazine-N9-2-ethanesulfonic acid
cloned using RT-PCR amplification. Using these sequence (HEPES), pH 6.6, 140 mm NaCl, 3 mm MgCl2, 20% (w/v)
data, complete cDNA fragments were then cloned. glycerol, and 0.1% dodecyl maltoside], as previously described
To obtain the 59-end subclones, two forward primers, F5A (Kawamura and Yokoyama 1998; Yokoyama et al. 1998). UV-
[59-G(G/T)C(T/C)G(G/A)C(G/A)GG(T/C)(G/A/T)(G/ visible spectra were recorded at 208 using a Hitachi (Mountain
T/C)C(G/A)G(G/A)G-39] and F5B [59-GACAGGG(T/C) View, CA) U-3000 dual beam spectrophotometer. Visual pig-
TTT(G/C)(T/C)A(G/C)AGCCATG-39], and two reverse ments were bleached for 3 min using a 60-W standard light
primers, R173 [59-(G/A)(T/C)(G/A)CTGGTGA(G/T/ bulb equipped with a Kodak Wratten no. 3 filter at a distance
C)GTG(G/A)TA(T/C)ACCC-39] and R401 [59-GA(G/ of 20 cm. Data were analyzed using Sigmaplot software (Jandel
C)AC(G/A)GTGTAGCCCTCCA(G/C)(G/A)AC-39], were Scientific, San Rafael, CA).
used. The 59-end subclones of horse and cat cDNAs were Sequence data analyses: The sources of the DNA sequences
obtained using primer sets F5A/R173 and F5B/R173, respec- of the red and green opsin genes of different mammalian
tively, and those of deer, guinea pig, and squirrel using F5A/ species are given in Table 1. Topologies and branch lengths
R401. Similarly, to obtain the 39-end subclones, two forward of the phylogenetic trees were inferred by applying the NJ
method (Saitou and Nei 1987) to the nucleotide and amino
primers, F752 [59-AGCAGCAGAAAGAATCTGAGTC-39] and
acid sequences. The tree topologies were tested by the boot-
F936 [59-AAGTGCCACTATCTACAACC-39], and two reverse
strap method with 1000 replications (Felsenstein 1985). The
primers, R3A [59-T(G/A)G(G/A)(T/C)G(G/C)(G/A)(G/
ancestral sequences of the opsins were inferred by using a
A)(T/C)(G/A)GGT(A/T/C) GGAGGC-39] and R3B [59-
computer program, PAML, based on a likelihood-based Bayes-
TTT(T/C)ACAGGGATGGAGAAGG-39], were used. The 39-
ian method (Yang 1997).
end subclones of horse, cat, and deer cDNAs were obtained
using primers F936/R3B and those of guinea pig and squirrel
using F752/R3A. Using the nucleotide information of the 59-
and 39-end subclones, we then constructed five sets of the RESULTS
species-specific forward and reverse primers (Figure 1). The
forward and reverse primers for goldfish were constructed Phylogenetic relationships of mammalian red and
green pigments: The amino acid sequences of the visual
pigments deduced from the red and green opsin cDNA
sequences of cat (deposited in GenBank with accession
no. AF132040), horse (AF132043), deer (AF132041),
guinea pig (AF132042), and squirrel (AF132044) consist
of 364 amino acids and can be easily aligned with those
of the orthologous pigments from other mammals (Fig-
ure 2). Note that human (P552) pigment is excluded
from Figure 2 because it differs from human (P560)
pigment only by one amino acid, having A180 instead
of S180. Applying the NJ method to both nucleotide and
amino acid sequences of these pigments, the unrooted
phylogenetic trees for the 12 mammalian pigments were
constructed (Figure 3). The comparison of the two NJ
Figure 1.—Oligonucleotide primers for RT-PCR amplifica- trees reveals three common groupings of the pigments
tion of red and green opsin mRNAs. The EcoRI and SalI sites with bootstrap supports at 90–100%: (1) a group con-
are boxed in the forward and reverse primers, respectively,
and were used for cloning into the expression vector pMT5. sisting of the goat, deer, dolphin, horse, and cat pig-
A Kozak sequence (CCACC) was inserted between the EcoRI ments; (2) two human pigments; and (3) two murine
site and the initiation codon to promote translation. pigments (Figure 3). However, neither the evolutionaryColor Vision in Mammals 921
TABLE 1
Mammalian red and green pigments
Absorption spectra
GenBank
Pigment accession no. lmax (nm) Method Reference
Cat (P553) AF132040 553 In vitro This study
555 ERGa Guenther and Zrenner (1993)
Horse (P545) AF132043 545 In vitro This study
Deer (P531) AF132041 531 In vitro This study
537 ERGa Jacobs et al. (1994)
Guinea pig (P516) AF132042 516 In vitro This study
529 ERGa Jacobs and Deegan (1994)
Squirrel (P532) AF132044 532 In vitro This study
543 ERGa Blakeslee et al. (1988)
Goat (P553) U67999 553 In vitro Radlwimmer and Yokoyama (1997)
553 ERGa Jacobs et al. (1998)
Rabbit (P509) AF054235 509 In vitro Radlwimmer and Yokoyama (1998)
523 ERGa Nuboer et al. (1983)
Mouse (P508) AF011389 508 In vitro Sun et al. (1997)
510 ERGa Jacobs et al. (1991)
Rat (P509) AF054241 509 In vitro Radlwimmer and Yokoyama (1998)
510 ERGa Jacobs et al. (1991)
Dolphin (P524) AF055457 524 In vitro Fasick et al. (1998)
Human (P530) K03490 530 In vitro Oprian et al. (1991)
531 MSPb Bowmaker (1990)
Human (P552) M13300c 552 In vitro Merbs and Nathans (1992)
Human (P560) M13300 560 In vitro Oprian et al. (1991)
564 MSPb Bowmaker (1990)
a
Flicker photometric electroretinogram.
b
Microspectrophotometry.
c
See also Winderickx et al. (1992).
relationship among the three groups of pigments nor (P531) pigments (Figure 3B). For example, taking cat
the phylogenetic positions of the rabbit, guinea pig, and (P553) pigment as a reference, dolphin (P524) pig-
squirrel pigments can be established. ment- and deer (P531) pigment-specific branch lengths
Recent molecular phylogenetic analyses of mammals are given by 0.045 6 0.0114 and 0.018 6 0.0071, respec-
based on much more extensive data sets strongly suggest tively. The difference is statistically significant at the
that (1) cat, goat, and deer are closely related with 5% level. However, when the number of nucleotide
each other; (2) rabbit appears to be closely related to substitutions is considered, the difference disappears
primates; (3) guinea pig clusters with cat, goat, deer, (Figure 3A). As we argue later, the validity and biological
and rabbit; and (4) mouse, rat, and squirrel are most significance of the accelerated amino acid substitution
distantly related (e.g., see Cao et al. 1997; Kumar and of dolphin (P524) pigment remains to be seen.
Hedges 1998; Yang et al. 1998). The tree topology in Light absorption profiles: When measured in the
Figure 3A is consistent with the first and third points. dark, the visual pigments of guinea pig, cat, deer, squir-
The results at the organismal level suggest that the evolu- rel, and horse have lmax values at 516 6 1 nm, 553 6
tionary relationship of the mammalian pigments is best 1 nm, 531 6 1 nm, 532 6 1 nm, and 545 6 1 nm,
represented by (((human, rabbit) ((((deer, goat), dol- respectively (Figure 4). The regenerated pigments show
phin), horse) cat)), guinea pig), ((mouse, rat), squir- very similar patterns of absorption spectra and their
rel); see also Yokoyama and Radlwimmer 1998. As we functions are characterized by the lmax values. The
see later in this article, amino acids at sites 180, 197, respective dark-light difference spectra are given by 518,
277, 285, and 308 are important in determining the 552, 531, 534, and 544 nm, all of which are precise to
lmax values of the red and green pigments and the NJ within 61 nm (Figure 4, insets) and are very close to
tree constructed by excluding these five sites is identical the corresponding dark spectra. The lmax value of cat
to that in Figure 3B. (P553) pigment obtained from the in vitro assay is very
It should be pointed out that, when the number of close to the ERG estimate, whereas those of deer (P531),
amino acid substitutions is considered, the branch guinea pig (P516), and squirrel (P532) pigments are
length for dolphin (P524) pigment is much longer than .6 nm lower than the ERG estimates (Table 1). Because
those for the corresponding goat (P553) and deer responses of rods and different types of cones may con-922 S. Yokoyama and F. B. Radlwimmer
Figure 2.—Alignment of
the amino acid sequences of
the red and green pigments
in mammals. The numbers
after P refer to lmax values
obtained from the in vitro
assays. Dots indicate the
identity of the amino acids
with those of the cat pig-
ment. The seven transmem-
brane domains (Hargrave
et al. 1983) are indicated.
The positions of five critical
sites, 180, 197, 277, 285, and
308 are marked by asterisks.
tribute to the recorded signals, the noninvasive ERG from the mutagenesis experiments of Merbs and
results must be interpreted with caution. Compared to Nathans (1993), Asenjo et al. (1994), and Sun et al.
ERG, the visual pigments regenerated using the in vitro (1997). Using lmax values estimated from the in vitro
assay are identical and are expected to provide more assay, we now evaluate the effects of amino acid changes
reliable lmax values. Thus, the lmax values of deer at sites 180, 197, 277, 285, and 308 on the spectral tuning
(P531), guinea pig (P516), and squirrel (P532) pig- of the mammalian red and green pigments.
ments should be reexamined using ERG and other phys- Let us assume that x1, x2, x3, x4, x5, and x6 represent
iological methods such as microspectrophotometry the presence or absence of amino acids S180, H197,
(MSP; e.g., see Bowmaker 1991). Note that the lmax Y277, T285, A308, and those at the remaining sites in
value of horse (P545) pigment using the in vitro assay a pigment, respectively. Similarly, let y1, y2, y3, . . . , yn be
is the only estimate available today. the lmax values of n pigments. Furthermore, let u1, u2,
Mechanism of red-green color vision: We previously u3, u4, u5, and Z be the magnitudes of the lmax shifts
proposed the “five-sites” rule using information only caused by S180A, H197Y, Y277F, T285A, A308S, and theColor Vision in Mammals 923
Figure 2.—(Continued)
amino acids at the other sites as a whole in a pigment, 1 1 0 1 0 1 1 1 1 1 0 1 1
respectively. Then, considering the amino acid composi-
tions of the 13 pigments in Table 2, the following rela- 0 0 1 0 1 0 1 0 1 1 0 0 0
tionships hold: 0 1 0 1 0 0 0 0 0 0 0 0 1
X9 5 0 1 1 0 0 0 0 0 0 0 0 0 1 ,
u1 1 Z 1 e1 5 553
u1 1 u3 1 u4 1 Z 1 e2 5 531 0 0 0 0 0 0 1 1 1 1 0 0 0
1 1 1 1 1 1 1 1 1 1 1 1 1
u2 1 u4 1 Z 1 e3 5 516
and
u1 1 u3 1 Z 1 e4 5 545
e9 5 [e1 e2 e3 . . . e13].
u2 1 Z 1 e5 5 532
If we assume that the random term, e, has a normal
u1 1 Z 1 e6 5 553 distribution with mean 0 and s2I, then the mean (û)
u1 1 u2 1 u5 1 Z 1 e7 5 509 and standard error (ŝ) of u9 5 [u1 u2 u3 u4 u5 Z] are
estimated from
u1 1 u5 1 Z 1 e8 5 524
û 5 (X9X)21 X9y, (3)
u1 1 u2 1 u5 1 Z 1 e9 5 508
ŝ 5 [(X9X)21 SSE/(n 2 p)]1/2, (4)
u1 1 u2 1 u5 1 Z 1 e10 5 509
where
Z 1 e11 5 560
SSE 5 (y 2 Xû)9 (y 2 Xû) (5)
u1 1 Z 1 e12 5 552
(Searle 1971). Note that the estimation of u does not
u1 1 u3 1 u4 1 Z 1 e13 5 530, (1) require the normality assumption of e under the least-
where ei’s (i 5 1, 2, . . . , 13) denote random errors. squares estimation procedure. In these formulas, SSE
This is represented in matrix form as denotes the sum of squares of the deviations of the
observed yi’s from their estimated expected values, while
y 5 X 1 e, (2) n and p denote the number of samples and that of
parameters, respectively. From (3)–(5), û1 5 23 6 3 nm,
where û2 5 221 6 3 nm, û3 5 26 6 3 nm, û4 5 217 6 3 nm,
and û5 5 224 6 3 nm (Table 3). Thus, these estimates
y9 5 [553 531 516 545 532 553 509 524
have large standard errors and are not always consistent
508 509 560 552 530], with the corresponding values 27, 228, 210, 216, and924 S. Yokoyama and F. B. Radlwimmer
Figure 3.—The un-
rooted phylogenetic tree
for the 12 red and green
pigments reconstructed by
applying the NJ method to
the nucleotide sequences
(A) and amino acid se-
quences (B). The numbers
next to the different
branches are clustering per-
centage support generated
by 1000 bootstrap repli-
cates. The bars at the bot-
tom indicate evolutionary
distance measured as the
proportion of nucleotide
(A) and amino acid (B) dif-
ferences per site.
218 nm observed in the mutagenesis experiments using This clearly shows that the estimate û is superior when
human (P560) pigment (Asenjo et al. 1994; Sun et al. dolphin (P524) pigment is excluded from the estima-
1997). tion. When dolphin (P524) pigment is included in the
If we exclude dolphin (P524) pigment in the estima- estimation, SSE1 is 8.49 and dolphin (P524) pigment
tion of u, we obtain û1 5 27 6 1 nm, û2 5 228 6 1 nm, alone explains 31%, 2.64, of the total SSE1 value.
û3 5 27 6 1 nm, û4 5 215 6 1 nm, and û5 5 216 6 Next, let us take human (P530) pigment with AHFAA
1 nm, which show much smaller standard errors (Table as a reference. Then u1, u2, u3, u4, and u5 denote the
3). These estimates are much closer to the correspond- lmax-shifts caused by A180S, H197Y, F277Y, A285T, and
ing observed values in the mutagenesis experiments. A308S, respectively. Excluding dolphin (P524) pigment
The improvement in the estimation procedures with from the estimation, û1, û3, and û4 are given by 7 6 1 nm,
and without dolphin (P524) pigment can be tested by 7 6 1 nm, and 15 6 1 nm, respectively (Table 3). The
estimate û3 is close to 6 nm of the red shift generated
F7,6 5 (SSE1/7)/(SSE2/6), (6)
by the amino acid change F277Y in the mutagenesis
where SSE1 and SSE2 indicate the SSE values for the experiment using human (P530) pigment (Asenjo et
models with and without dolphin (P524) pigment, re- al. 1994). However, û1 and û4 are much higher than
spectively. For the present case, F7, 6 5 20.5 (P , 0.01). the corresponding red shifts caused by single mutationsColor Vision in Mammals 925
Figure 4.—Absorption
spectra of the guinea pig,
cat, deer, squirrel, and
horse pigments in the dark,
and the dark-light differ-
ence spectra (inset).
A180S (2 nm) and A285T (10 nm). At present, the cause S308A, respectively. The û5 value, 16 6 1 nm (Table 3),
of this discrepancy is not clear. It is also not clear why is close to the 18-nm red shift caused by S308A in a
the extents of the lmax shifts generated by amino acid mutagenesis experiment using mouse (P508) pigment
changes at sites 180 and 285 are much smaller in human (Sun et al. 1997).
(P530) pigment than in human (P560) pigment. Simi- When dolphin (P524) pigment is excluded in the
larly, when mouse (P508) pigment with AYYTS is taken estimation, ûi’s have reasonably small standard errors
as a reference, u1, u2, u3, u4, and u5 denote the lmax (Table 3). This strongly suggests that the red and green
shifts generated by A180S, Y197H, Y277F, T285A, and color vision in mammals is controlled mainly by the five926 S. Yokoyama and F. B. Radlwimmer
TABLE 2
Amino acid compositions at five critical sites and lmax values of the mammalian
red and green pigments
lmax (nm)
Pigment 180 197 277 285 308 Expected Expected 2 Observed
Cat (P553) A H Y T A 553a (553)b 0a (0)b
Deer (P531) A H F A A 531 (530) 0 (21)
Guinea pig (P516) S Y Y A A 517 (518) 1 (2)
Horse (P545) A H F T A 546 (547) 1 (2)
Squirrel (P532) S Y Y T A 532 (535) 0 (3)
Goat (P553) A H Y T A 553 (553) 0 (0)
Rabbit (P509) A Y Y T S 509 (508) 0 (21)
Dolphin (P524) A H Y T S 537 (529) 13 (5)
Mouse (P508) A Y Y T S 509 (508) 1 (0)
Rat (P509) A Y Y T S 509 (508) 0 (21)
Human (P560) S H Y T A 560 (556) 0 (24)
Human (P552) A H Y T A 553 (553) 1 (1)
Human (P530) A H F A A 531 (530) 1 (0)
a
Dolphin (P524) pigment is excluded in the estimation.
b
Dolphin (P524) pigment is included in the estimation.
sites. Namely, S180A, H197Y, Y277F, T285A, and A308S E41 and L73 are completely conserved among the red
shift the lmax values of a pigment toward blue by 7, and green pigments in other vertebrates. I91 is com-
28, 7, 15, and 16 nm, respectively, in an additive fashion pletely conserved in RH1, RH2, SWS2, and LWS/MWS
and the reverse changes toward red by the same extents. pigment groups, all of which have diverged prior to the
Note that these estimates are very similar to the pre- evolution of vertebrates (Yokoyama 1997). Q260 is also
viously suggested values 7, 28, 10, 16, and 18 nm in completely conserved among all RH1, RH2, SWS1,
the formulation of the five-sites rule (Yokoyama and SWS2, and LWS/MWS pigment groups in vertebrates.
Radlwimmer 1998). Thus, it is most important to evaluate whether these
With the exception of dolphin (P524), this five-sites and other amino acids of dolphin (P524) actually exist
rule explains the observed lmax values of the mamma- in nature. If these amino acids are validated, then dol-
lian red and green pigments extremely well (Table 2). phin (P524) pigment provides an exciting opportunity
When the five-sites rule is applied to dolphin (P524) to study not only the molecular mechanism of adapta-
pigment, the predicted lmax value is 13 nm higher tion of the pigment to a marine environment but also
than the observed value (Table 2). Fasick et al. (1998) a new genetic mechanism of red-green color vision.
obtained the lmax value of dolphin (P524) pigment Evolution of the mammalian red-green color vision:
using the dark-light difference spectrum in their in vitro Our analyses show that the five-sites rule explains the
assay. Because the values of the dark and dark-light lmax values of virtually all extant red and green pig-
difference can disagree (Kawamura and Yokoyama ments in mammals. This implies that it also applies to
1998), it is of interest to evaluate the absorption spec- the ancestral red and green pigments. Thus, it is of
trum in the dark and see how well the two spectra interest to study the evolution of red-green color vision
coincide. As we see in the goldfish red pigment (discus- of the mammalian ancestors.
sion), there is also some possibility that unwanted To infer the amino acid sequences of visual pigments
amino acid changes might have been introduced during of ancestral organisms, we consider a composite tree
the cloning of the opsin cDNA, leading to an erroneous topology of the mammalian red and green pigments
lmax value. If this occurred, the five-sites rule should inferred by tree topologies in Figure 3 and the organis-
not apply to the mutant pigment. As we already saw, mal tree in Figure 5. Given this tree topology, the amino
dolphin (P524) pigment has a higher rate of amino acid acid sequences for all ancestral pigments were inferred
substitution compared to other pigments. The cause of by using the Dayhoff model of amino acid substitution
this accelerated evolutionary rate is not understood. (Dayhoff et al. 1978; Figure 5). When the empirical
This high rate may reflect an adaptive evolution of this substitution model (Jones et al. 1992) and equal input
pigment to a unique marine environment. Or, some of model are used, virtually identical ancestral amino acid
the amino acid changes might have been introduced sequences are obtained (results not shown). According
by spurious mutations. Mutations involved in either of to Figure 5, the mammalian ancestral pigment had a
these cases may include E41D, L73P, I91M, and Q260R. lmax value at 531 nm. Interestingly, this ancestral phe-Color Vision in Mammals 927
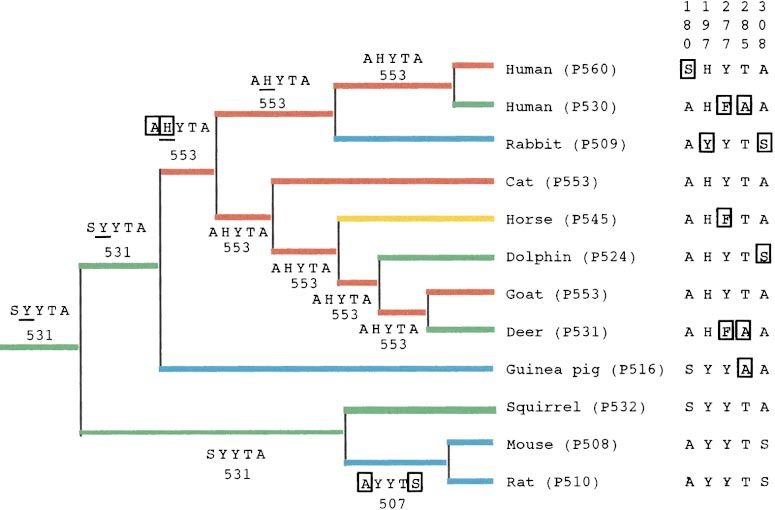
Figure 5.—A composite tree
topology of the mammalian
red and green pigments and
ancestral amino acids at sites
180, 197, 277, 285, and 308.
The numbers after P refer to
lmax values obtained from the
in vitro assays, whereas the
numbers beside branches are
predicted values from the five-
sites rule. The ancestral amino
acids that have a probability of
90% or less are underlined.
The rectangles indicate amino
acid substitutions. In the esti-
mation, the red pigments of
American chameleon (U08-
131) and chicken (M62903)
were also used as the outgroup.
notype can still be seen in the extant squirrel (P532) Guinea pig (P516) appears to have achieved its pres-
pigment. The red color vision at a lmax at 553 nm ent green color sensitivity from the original mammalian
appears to have been achieved initially in the pigment ancestral green pigment by a single amino acid substitu-
in the common ancestor of primates (human), Lago- tion T285A. The extreme blue shift in a lmax value of
morpha (rabbit), Carnivora (cat), Perissodactyla rabbit (P509) pigment evolved from the red pigment
(horse), Cetacea (dolphin), and Artiodactyla (goat and with a lmax at 553 nm by H197Y and A308S, whereas
deer) by two amino acid substitutions S180A and Y197H those of the two murine pigments evolved from the
(Figure 5). Today, this red color vision can be seen in ancestral green pigment by S180A and A308S (Figure
cat (P553) and goat (P553) pigments. Human (P560) 5). Thus, the evolution of red-green color vision in mam-
pigment achieved further red shift in the lmax by an mals indicates that the extant color vision has been
additional amino acid substitution A180S. The green achieved often by independent amino acid substitutions
color sensitivities of human (P530) and deer (P531) at only a few sites.
pigments were achieved by Y277F and T285A (see also
Nei et al. 1997) and dolphin (P524) pigment by A308S.
DISCUSSION
Horse (P545) pigment achieved its present blue-shifted
lmax from the ancestral red pigment by a single amino Red-green color vision in primates: Hominoids and
acid substitution Y277F. Old World monkeys have two X-linked genes encoding
TABLE 3
The effects of amino acid changes at sites 180, 197, 277, 285, and 308 on the lmax-shifts
Estimator (nm)
Amino acids Z û1 û2 û3 û4 û5
SHYTA
Mammalian pigments
(n 5 13) 556 6 2 23.0 6 2.9 221.1 6 2.5 26.0 6 2.9 217.0 6 2.6 224.4 6 2.9
Mammalian pigments
(n 5 12)a 560 6 1 27.3 6 0.7 228.4 6 0.8 27.2 6 0.6 215.1 6 0.6 215.6 6 1.0
Vertebrate pigments
(n 5 18)a 560 6 0.4 27.2 6 0.6 228.0 6 0.8 26.8 6 0.7 215.9 6 0.6 216.0 6 1.1
AHFAA (n 5 12)a 530 6 0.4 7.3 6 0.7 228.4 6 0.8 7.2 6 0.6 15.1 6 0.6 215.6 6 1.0
AYYTS (n 5 12)a 509 6 0.4 7.3 6 0.7 28.4 6 0.8 27.2 6 0.6 215.1 6 0.6 15.6 6 1.0
a
Dolphin (P524) is excluded from the estimation.928 S. Yokoyama and F. B. Radlwimmer
the red and green opsins. With the exception of New pigment has a lmax value at 552 nm (Merbs and
World (NW) monkeys, it appears that all mammalian Nathans 1992), which is virtually identical to the pre-
species have only one locus that encodes either red dicted value, 553 nm, from the five-sites rule (Table 2).
or green opsins (Radlwimmer and Yokoyama 1997, Color vision in nonmammalian species: To date, the
1998). Most NW monkeys also have one red-green opsin in vitro estimates for the lmax values of the orthologous
locus (however, see Jacobs et al. 1996), but this locus pigments in nonmammalian species are available only
is polymorphic and contains three different alleles for goldfish (C. auratus) and American chameleon (An-
(Mollon et al. 1984; Neitz et al. 1991; Hunt et al. 1998). olis carolinensis). Although they have the same amino
In these species, all males are red-green color blind, acid SHYTA at the five critical sites, the goldfish and
but females are either color blind or trichromatic de- American chameleon red pigments have lmax values
pending on the allelic compositions. Using ERG and at 525 nm (Johnson et al. 1993) and 561 nm (Kawa-
MSP, three different allelic pigments have been identi- mura and Yokoyama 1998), respectively. Thus, the
fied in capuchin monkey (Cebus nigrivittatus; P537, P550, American chameleon red pigment is consistent with the
and P562: Jacobs and Neitz 1987a), in marmoset mon- five-sites rule, but the goldfish red pigment is not.
key (Callithrix jacchus jacchus; P543, P556, and P563; Many freshwater fishes and amphibians utilize either
Travis et al. 1988; Tovee et al. 1992), in squirrel monkey 11-cis-retinal (vitamin A1 aldehyde) or 11-cis-3, 4-dehy-
(Saimiri sciureus; P533–P538, P544–P551, and P559– droretinal (vitamin A2 aldehyde) as a chromophore
P565; Mollon et al. 1984; Jacobs and Neitz 1987b; and (e.g., see Dartnall and Lythgoe 1965). In general,
Jacobs et al. 1993), and in tamarin monkey (Saguinus visual pigments with 11-cis-3, 4 dehydroretinal (A2-pig-
mystax; P545, P557, and P562; Jacobs et al. 1987). All ments) absorb longer wavelengths than those with 11-
12 alleles have been sequenced at the nucleotide level. cis-retinal (A1-pigments; Dartnall and Lythgoe 1965;
Unfortunately, the lmax values of these pigments have Whitmore and Bowmaker 1989). The relationship be-
not been determined directly using the in vitro assay. tween the lmax value of the A1-pigment (L1) and that
Thus, the relevance of the five-sites rule cannot be dis- of the A2-pigment (L2) is given roughly by empirical
cussed for these data yet. formulas L2WB 5 (L1/52.5)2.5 1 250 (Whitmore and
To obtain direct information on the lmax values of Bowmaker 1989) and L2H 5 104/[(104/L1) 2 0.367 2
the red and green pigments in NW monkeys, we isolated 0.05054{(104/L1) 2 23.347}2] (Harosi 1994; see also
the three allelic opsin cDNAs from the marmoset retina Kawamura and Yokoyama 1998). Almost all the gold-
by RT-PCR using two primers: 59-AGGGCTGAATTCCA fish pigments are A2-types, with A1-pigments represent-
CCATGGCCCAGCAGTGGAG-39 (forward) and 59-GGC ing only 4% of the entire pigment population in the
AGAGTCGACGCAGGTGACACCGAGGACA-39 (reverse; retina (Palacios et al. 1998).
see Shyue et al. 1998). Using these opsin cDNAs, we Using the in vitro assay, Johnson et al. (1993) regener-
regenerated the three allelic pigments using the in vitro ated two green and one red A1-pigments with lmax
assay (S. Kawamura, F. B. Radlwimmer and S. Yokoy- values at 505 nm [goldfish (P505)], 511 nm [goldfish
ama, unpublished data). Our analyses show that marmo- (P511)], and 525 nm [goldfish (P525)]. These pigments
set pigments with AHYAA, AHYTA, and SHYTA have represent two evolutionarily distinct groups. The first
the lmax values at 540, 553, and 562 nm, respectively. two pigments belong to the RH2 pigment group,
These lmax values agree well with the MSP estimates. whereas the third pigment is orthologous to the mam-
Furthermore, the three lmax values are very close to malian red and green pigments and belongs to the
the corresponding predicted values 538, 553, and 560 LWS/MWS pigment group (Yokoyama 1997). Palac-
nm from the five-sites rule. ios et al. (1998) measured the spectral sensitivities of
In human (P530) and human (P560) pigments, cone photoreceptor cells of goldfish by recording mem-
amino acids S and Y at site 116, I and T at 230, A and brane photocurrents with suction pipette electrodes.
S at 233, and Y and F at 309 have minor effects on They found three major groups of photoreceptor cells
the fine tuning of their color sensitivities (Asenjo et al. with lmax values at 623 6 7 nm, 537 6 5 nm, and
1994). Although the compositions of amino acids are 447 6 8 nm and two rare types with lmax values at 356
not the same, the triallelic pigments of NW monkey are and 574 nm (see also Table 4). Goldfish (P505) and
also polymorphic at 116, 230, and 233. However, such goldfish (P511) A1-pigments are expected to operate
polymorphic amino acids at 116, 233, and 309 are found as A2-pigments with lmax values at 530–540 nm, which
only among the primate red and green pigments (Fig- correspond to the A2-pigments with lmax values at 537
ure 2). Thus, the effects of these polymorphic amino nm found by Palacios et al. (1998; Table 4). Thus,
acids on red-green color vision are irrelevant in many under normal circumstances, goldfish (P505) and gold-
other species. One interesting feature of human (P560) fish (P511) pigments have green sensitivities. Goldfish
pigment is that the population survey shows that 62% (P525) pigment can have a lmax value at z565 nm as
of the red pigment consists of SHYTA, a typical human an A2-pigment, which may correspond to a rare type of
(P560) pigment, but 38% of the allelic red pigment A2-pigment with a lmax value at 574 nm (Palacios et
consists of AHYTA (Winderickx et al. 1992). The latter al. 1998; Table 4). However, as we see next, the existenceColor Vision in Mammals 929
TABLE 4
Absorption spectra of the goldfish red and green pigments
A2-pigment
A1-pigment (nm) Reference L2WB (nm) L2H (nm) Observeda (nm)
505 Johnson et al. (1993) 537 532 537
511 Johnson et al. (1993) 546 541 537
525b Johnson et al. (1993) 566 563 574
559 This study 620 624 623
L2WB 5 (L1/52.5)2.5 1 250 (Whitmore and Bowmaker 1989) and L2H 5 104/[(104/L1) 2 0.367 2
0.05054{(104/L1) 2 23.347}2] (Harosi 1994), where L1 is the lmax value of the pigment with 11-cis-retinal
(see also Kawamura and Yokoyama 1998).
a
Palacios et al. (1998).
b
This pigment could not be found in this study.
of goldfish (P525) pigment in nature is questionable respond to 284 in the goldfish red pigment. When it is
and needs to be reexamined. measured in the dark, this goldfish pigment has a lmax
The “true” goldfish red pigment: To date, no one value at 559 6 4 nm, while its dark-light difference
has cloned the “true” goldfish red pigment. To clone spectrum is given by 561 6 2 nm (Figure 6). When
the goldfish red opsin cDNA, we constructed forward goldfish (P559) pigment is reconstituted with 11-cis-3,
and reverse primers using sequence information from 4 dehydroretinal, the corresponding A2-pigment is ex-
the goldfish (P525) cDNA (Johnson et al. 1993; Figure pected to have a lmax value at z620 nm (Table 4),
1). Using these primers, we cloned an opsin cDNA from which corresponds to the goldfish red A2-pigment with
a goldfish retina by RT-PCR amplification. The pigment a lmax at 623 6 7 nm found by Palacios et al. (1998).
regenerated using the in vitro assay has SHYTA at the Thus, we have cloned the true goldfish red pigment.
five critical sites, just like the goldfish (P525) pigment, The lmax value of goldfish (P559) pigment is again
but it differs from goldfish (P525) pigment by one explained nicely by the five-sites rule.
amino acid. That is, compared to C287 in goldfish It should be noted that C287 has not been found in
(P525) pigment, this pigment has F287. Note that, be- any other red and green pigments in a wide variety
cause of the difference in the pigment lengths, the sites of vertebrates, including marine lamprey (Petromyzon
287 in the human red and green pigments actually cor- marinus; S. Yokoyama and H. Zhang, unpublished re-
sult), Mexican cavefish (Astyanax fasciatus), killifish (Ory-
zias latipes), African clawed frog (Xenopus laevis), gecko
(Gekko gekko), American chameleon (A. carolinensis),
chicken (Gallus gallus), and pigeon (C. livia; S. Kawa-
mura, N. S. Blow and S. Yokoyama, unpublished re-
sults), and mammals. Furthermore, we sequenced the
entire coding regions of one red and two green pig-
ments of five river dwelling, six Micos cave, and five
Pachon cave fishes of Astyanax fasciatus (Yokoyama et
al. 1995) and could not find C287. The two cave fish
populations were derived from the river fish population
during the last 1 million years (Avise and Selander
1972; Chakraborty and Nei 1974; Wilkens 1988).
Thus, these cave fish populations are much older than
different goldfish varieties.
These observations strongly suggest that C287 may
not actually exist and might have been introduced dur-
ing the cloning process of the red opsin cDNA. To check
this possibility, we cloned the red opsin cDNAs from six
additional morphologically different breeds of goldfish
Figure 6.—Absorption spectrum of the goldfish red pig- by RT-PCR using the primers given in Figure 1. This
ment in the dark and the dark-light difference spectrum survey reveals only synonymous nucleotide polymor-
(inset). phisms at a small number of sites (Table 5). The critical930 S. Yokoyama and F. B. Radlwimmer
TABLE 5 tected in equal frequencies. However, as already indi-
DNA polymorphism among the goldfish red cDNA opsins cated, the frequency of the variant types is 2/20 (Palac-
ios et al. 1998) and is significantly ,0.5. Thus, it is
Site unlikely that any allelic forms of goldfish (P559) pig-
ments are contained in the rare photoreceptor cells.
Individual 135 276 600 851a
The third possibility that a MWS pigment may exist in
1b T C T G goldfish has not yet been explored. In the LWS/MWS
2 C T C T group, gene duplication of the ancestral LWS and MWS
3 C T C T opsin genes predates the speciation between Mexican
4 C C C T cavefish and goldfish, suggesting that goldfish can pos-
5 C C C T
sess at least one MWS gene (Register et al. 1994). Hav-
6 T C T T
7 T C T T ing all other necessary retinal pigments in place, it is
8 C C C T not unreasonable to assume that such extra pigments
a
may be expressed less abundantly. Thus, MWS pigments
This site corresponds to the second position of the codon appear to be viable candidates for the pigments in the
284, where TGT and TTT encode cysteine and phenylalanine,
respectively. rare photoreceptor cells with a lmax value at 574 nm.
b
Johnson et al. (1993). To study the existence of such pigments, more detailed
analyses of the opsin genes in the goldfish genome are
required.
The five-sites rule in vertebrates: Recently, we also
nucleotide G at site 851 found in a red opsin cDNA studied the lmax value of the visual pigments in pigeon
identified by Johnson et al. (1993) cannot be found in (Columba livia; S. Kawamura, N. S. Blow and S. Yoko-
the present polymorphism survey. This may mean that yama, unpublished results). Our analyses show that the
the frequency of nucleotides G at this site in a goldfish pigeon red pigment with SHYTA has a lmax value at
population is very low. However, it is more likely that 559 nm that is virtually identical to the predicted value
the nucleotide G at site 851 was introduced during the of 560 nm from the five-sites rule. Thus, the red pig-
process of cloning of the goldfish red opsin cDNA, possi- ments of goldfish, American chameleon, pigeon, and
bly due to the error-prone reverse transcriptase activity marmoset all with SHYTA at the five critical sites show
at the time of cDNA library construction. the lmax values at 559–562 nm, which are virtually
If goldfish (P525) pigment does not exist, how can identical to that of human (P560) pigment. The lmax
we explain the rare goldfish photoreceptor cells with values of marmoset (P554) and human (P552) pigments
a lmax value at 574 nm? Three possibilities can be with AHYTA are very close to those of cat (P553) and
considered. First, because the goldfish retina contains goat (P553) pigments with the identical amino acids at
a small population of A1-pigments, the rare photorecep- the five sites (Table 2). The lmax value of the third
tor cells may arise because goldfish (P559) pigments allelic pigment with AHYAA in marmoset (540 nm) is
contain 11-cis-retinal rather than 11-cis-3, 4-dehydroreti- also close to the predicted value, 538 nm, by the five-
nal. Second, some goldfish pigments may be encoded sites rule. Thus, when marmoset (P540), marmoset
by a polymorphic allele of goldfish (P559) opsin gene, (P553), and marmoset (P562), goldfish (P559), chame-
as implicated by Johnson et al. (1993). Third, goldfish leon (P561), and pigeon (P559) pigments are added in
may have green pigments that belong to the LWS/MWS the estimation, the ûi values inferred (vertebrate pig-
group in addition to those in the RH2 group, just like ments, Table 3) are virtually identical to those obtained
Mexican cavefish (Register et al. 1994). previously.
The spectral sensitivities of the two rare photorecep- These observations show that the spectral sensitivities
tor cells are explained much better by A2-pigments than of virtually all red and green pigments in vertebrates
by A1-pigments (Palacios et al. 1998). Thus, 11-cis-reti- known today are fully compatible with the five-sites rule.
nal does not appear to be the cause of the rareness However, it should be cautioned that only a small num-
of the photoreceptor cells. The genetic polymorphism ber of the lmax values of the red and green pigments
hypothesis for the rare photoreceptor cells is also prob- in nonmammalian species have been measured using
lematic. It turns out that the rare photoreceptor cells the in vitro assays. Thus, the generality of the five-sites
are isolated from two retinas of a single fish, each of rule for the red-green color vision in vertebrates remains
which contains the red-sensitive photoreceptor cells as to be seen. The five-sites rule for red-green color vision
well (Palacios et al. 1998). Now, suppose that these in mammals may require further modification in its
rare cells contain variant visual pigments, allelic forms detail, but its validity is strongly supported by the exist-
of goldfish (P559) pigments, such as goldfish (P525) ing data.
pigments. Then, this specific goldfish has to be heterozy- Comments by Drs. Tom Starmer, Ruth Yokoyama, and two anony-
gous at the red opsin gene locus and the wild-type and mous reviewers were greatly appreciated. This work was supported by
variant types of red photoreceptor cells should be de- National Institutes of Health grant GM-42379.Color Vision in Mammals 931
LITERATURE CITED coileus virginianus) and fallow deer (Dama dama). J. Comp. Physiol.
A 174: 551–557.
Asenjo, A. B., J. Rim and D. D. Oprian, 1994 Molecular determi- Jacobs, G. H., M. Neitz, J. F. Deegan and J. Neitz, 1996 Trichro-
nants of human red/green color discrimination. Neuron 12: matic color vision in New World monkeys. Nature 382: 156–158.
1131–1138. Jacobs, G. H., J. F. Deegan and J. Neitz, 1998 Photopigment basis
Avise, J. C., and R. K. Selander, 1972 Evolutionary genetics of cave- for dichromatic color vision in cows, goats, and sheep. Vis. Neu-
dwelling fishes of the genus Astyanax. Evolution 26: 1–19. rosci. 15: 581–584.
Blakeslee, B., G. H. Jacobs and J. Neitz, 1988 Spectral mechanisms Johnson, R., K. B. Grant, T. C. Zankel, M. F. Boehm, S. L. Merbs
in the tree squirrel retina. J. Comp. Physiol. 162: 773–780. et al., 1993 Cloning and expression of goldfish opsin sequences.
Bowmaker, J. K., 1990 Cone visual pigments in monkeys and human, Biochemistry 32: 208–214.
pp. 19–30 in Advances in Photoreception: Proceedings Symposium on Jones, D. T., W. R. Taylor and J. M. Thornton, 1992 The rapid
Frontiers of Visual Science. National Academy Press, Washington, generation of mutation data matrices from protein sequences.
DC. Comput. Appl. Biosci. 8: 275–282.
Bowmaker, J. K., 1991 The evolution of vertebrate visual pigments Kawamura, S., and S. Yokoyama, 1998 Functional characterization
and photoreceptors, pp. 63–81 in Evolution of the Eye and Visual of visual and nonvisual pigments of American chameleon (Anolis
Systems, edited by J. R. Cronly-Dillon and R. L. Gregory. CRC carolinensis). Vision Res. 38: 37–44.
Press, Boca Raton, FL. Khorana, H. G., B. E. Knox, F. Nasi, R. Swanson and D. A. Thomp-
Cao, Y., N. Okada and M. Hasegawa, 1997 Phylogenetic position son, 1988 Expression of a bovine rhodopsin gene in Xenopus
of guinea pig revisited. Mol. Biol. Evol. 14: 461–464. oocytes: demonstration of light-dependent ionic currents. Proc.
Chakarborty, R., and M. Nei, 1974 Dynamics of gene differentia- Natl. Acad. Sci. USA 85: 7917–7921.
tion between incompletely isolated populations of unequal sizes. Kumar, S., and S. B. Hedges, 1998 A molecular timescale for verte-
Theor. Popul. Biol. 5: 460–469. brate evolution. Nature 392: 917–920.
Chan, T., M. Lee and T. P. Sakmar, 1992 Introduction of hydroxyl Merbs, S. L., and J. Nathans, 1992 Absorption spectra of human
bearing amino acids causes bathochromic spectral shifts in rho- cone pigments. Nature 356: 433–435.
dopsin. Amino acid substitutions responsible for red-green color Merbs, S. L., and J. Nathans, 1993 Role of hydroxyl-bearing amino
pigment spectral tuning. J. Biol. Chem. 267: 9478–9480. acids in differentially tuning the absorption spectra of the human
Chomczynski, P., and N. Sacchi, 1987 Single-step method of RNA red and green cone pigments. Photochem. Photobiol. 58: 706–
isolation by acid guanidinium thiocyanate-phenol-chloroform ex- 710.
traction. Anal. Biochem. 162: 156–159. Mollon, J. D., J. K. Bowmaker and G. H. Jacobs, 1984 Variations
Dartnall, H. J. A., and J. N. Lythgoe, 1965 The spectral clustering of color vision in a New World primate can be explained by a
of visual pigments. Vision Res. 5: 45–60. polymorphism of retinal photopigments. Proc. R. Soc. Lond. Ser.
Dayhoff, M. O., R. M. Schwartz and B. C. Orcutt, 1978 A model B 222: 373–399.
of evolutionary change in proteins, pp. 345–352 in Atlas of Protein Nei, M., J. Zhang and S. Yokoyama, 1997 Color vision of ancestral
Sequence and Structure, Vol. 5, Suppl. 3, edited by M. O. Dayhoff. organisms of higher primates. Mol. Biol. Evol. 14: 611–618.
National Biomedical Research Foundation, Washington, DC. Neitz, J., and G. H. Jacobs, 1984 Electroretinogram measurements
Fasick, J. I., T. W. Cronin, D. M. Hunt and P. R. Robinson, 1998 of cone spectral sensitivity in dichromatic monkeys. J. Opt. Soc.
The visual pigments of the bottlenose dolphin (Turniops trunca- Am. 1: 1175–1180.
tus). Vis. Neurosci. 15: 643–651. Neitz, M., J. Neitz and G. H. Jacobs, 1991 Spectral tuning of
Felsenstein, J., 1985 Confidence limits on phylogenies: an ap- pigments underlying red-green color vision. Science 252: 971–
proach using the bootstrap. Evolution 39: 783–791. 974.
Guenther, E., and E. Zrenner, 1993 The spectral sensitivity of Nuboer, J. F. W., W. M. Vannuys and J. F. Wortel, 1983 Cone
dark- and light-adapted cat retinal ganglion cells. J. Neurosci. 13: systems in the rabbit retina revealed by ERG-null-detection. J.
1543–1550. Comp. Physiol. A 151: 347–351.
Hadjeb, N., and G. A. Berkowitz, 1996 Preparation of T-overhang Oprian, D. D., A. B. Asenjo, N. Lee and S. L. Pelletier, 1991 De-
vectors with high PCR product cloning efficiency. Biotechniques sign, chemical synthesis, and expression of genes for the three
20: 20–22. human color vision pigments. Biochemistry 30: 11367–11372.
Hargrave, P. A., J. H. McDowell, D. R. Curtis, J. K. Wang, E. Palacios, A. G., F. J. Varela, R. Srivastava and T. J. Goldsmith,
Jaszczack et al., 1983 The structure of bovine rhodopsin. Bio- 1998 Spectral sensitivity of cones in the goldfish, Carassius aura-
phys. Struct. Mech. 9: 235–244. tus. Vision Res. 38: 2135–2146.
Harosi, F. I., 1994 Analysis of two spectral properties of vertebrate Radlwimmer, F. B., and S. Yokoyama, 1997 Cloning and expression
visual pigments. Vision Res. 34: 1359–1369. of the red visual pigment gene of goat (Capra hircus). Gene 198:
Hunt, D. M., K. S. Dulai, J. A. Cowing, C. Julliot, J. D. Mollon 211–215.
et al., 1998 Molecular evolution of trichromacy in primates. Radlwimmer, F. B., and S. Yokoyama, 1998 Genetic analyses of the
Vision Res. 38: 3299–3306. green visual pigments of rabbit (Oryctolagus cuniculus) and rat
Jacobs, G. H., and J. F. Deegan, 1994 Spectral sensitivity, photopig- (Rattus norvegicus). Gene 218: 103–109.
ments, and color vision in the guinea pig (Cavia porcellus). Behav. Register, E. A., R. Yokoyama and S. Yokoyama, 1994 Multiple
Neurosci. 10: 993–1004. origins of the green-sensitive opsin genes in fish. J. Mol. Evol.
Jacobs, G. H., and J. Neitz, 1987a Polymorphism of the middle 39: 268–273.
wavelength cone in two species of South American monkey: Cebus Saitou, N., and M. Nei, 1987 The neighbor-joining method: a new
apella and Callicebus moloch. Vision Res. 27: 1263–1268. method for reconstructing phylogenetic trees. Mol. Biol. Evol.
Jacobs, G. H., and J. Neitz, 1987b Inheritance of color vision in a 4: 406–425.
New World monkey (Saimiri sciureus). Proc. Natl. Acad. Sci. USA Searle, S. R., 1971 Linear Models. John Wiley & Sons, New York.
84: 2545–2549. Shyue, S.-K., S. Boissinot, H. Schneider, I. Sampaio, M. P. Schnei-
Jacobs, G. H., J. Neitz and M. Crognale, 1987 Color vision poly- der et al., 1998 Molecular genetics of spectral tuning in New
morphism and its photopigment basis in a callitrichid monkey World monkey color vision. J. Mol. Evol. 46: 697–702.
(Saguinus fuscicollis). Vision Res. 27: 2089–2100. Sun, H., J. P. Macke and J. Nathans, 1997 Mechanisms of spectral
Jacobs, G. H., J. Neitz and J. F. Deegan, 1991 Retinal receptors tuning in the mouse green cone pigment. Proc. Natl. Acad. Sci.
in rodents maximally sensitive to ultraviolet light. Nature 353: USA 94: 8860–8865.
655–656. Tovee, M. J., J. K. Bowmaker and J. D. Mollon, 1992 The relation-
Jacobs, G. H., J. Neitz and M. Neitz, 1993 Genetic basis of polymor- ship between cone pigments and behavioural sensitivity in a New
phism in the color vision of platyrrhine monkeys. Vision Res. 33: World monkey (Callithrix jacchus jacchus). Vision Res. 32: 867–878.
269–274. Travis, D. S., J. K. Bowmaker and J. D. Mollon, 1988 Polymor-
Jacobs, G. H., J. F. Deegan, J. Neitz, B. P. Murphy, K. V. Miller phism of visual pigments in a callitrichid monkey. Vision Res.
et al., 1994 Electrophysiological measurements of spectral 28: 481–490.
mechanisms in the retinas of two cervids: white-tailed deer (Odo- Whitmore, A. V., and J. K. Bowmaker, 1989 Seasonal variation in932 S. Yokoyama and F. B. Radlwimmer
cone sensitivity and short-wave absorbing visual pigments in the Yokoyama, S., 1997 Molecular genetic basis of adaptive selection:
rudd Scadinius erythrophthalmus. J. Comp. Physiol. A 166: 103–115. examples from color vision in vertebrates. Annu. Rev. Genet. 31:
Wilkens, H., 1988 Evolution and genetics of epigean and cave Astya- 311–332.
nax fasciatus (Characidae, Pisces). Evol. Biol. 23: 271–367. Yokoyama, S., and F. B. Radlwimmer, 1998 The “five-sites” rule
Winderickx, J., D. T. Lindsey, E. Sanocki, D. Y. Teller, A. G. and the evolution of red and green color vision in mammals.
Motulsky et al., 1992 Polymorphism in red photopigment un- Mol. Biol. Evol. 15: 560–567.
derlies variation in color matching. Nature 356: 431–433. Yokoyama, S., A. Meany, H. Wilkens and R. Yokoyama, 1995 Initial
Yang, Z., 1997 PAML: a program package for phylogenetic analysis mutational steps toward loss of opsin gene function in cavefish.
by maximum likelihood. Comput. Appl. Biosci. 13: 555–556. Mol. Biol. Evol. 12: 527–532.
Yang, Z., R. Nielsen and M. Hasegawa, 1998 Models of amino acid Yokoyama, S., F. B. Radlwimmer and S. Kawamura, 1998 Regener-
substitution and applications to mitochondrial protein evolution. ation of ultraviolet pigments of vertebrates. FEBS Lett. 423: 155–
Mol. Biol. Evol. 15: 1600–1611. 158.
Yokoyama, R., and S. Yokoyama, 1990 Convergent evolution of the
red- and green-like visual pigment genes in fish, Astyanax fasciatus, Communicating editor: A. G. Clark
and human. Proc. Natl. Acad. Sci. USA 87: 9315–9318.You can also read