Evaluation of camera trap sampling designs used to determine change in occupancy rate and abundance of feral cats
←
→
Page content transcription
If your browser does not render page correctly, please read the page content below
Evaluation of camera trap sampling
designs used to determine change in
occupancy rate and abundance of feral
cats

Alan Robley, Andrew Gormley, Luke Woodford, Michael
Lindeman, Bernard Whitehead, Ray Albert, Michael Bowd
and Aileen Smith
2010

Arthur Rylah Institute for Environmental Research

Technical Report Series No. 201

Arthur Rylah Institute for Environmental Research Technical Series No. 201

Evaluation of camera trap sampling designs used to
determine change in occupancy rate and abundance
                   of feral cats

 Alan Robley, Andrew Gormley, Luke Woodford, Michael Lindeman, Bernard
          Whitehead, Ray Albert, Michael Bowd and Aileen Smith

                  Arthur Rylah Institute for Environmental Research
                     123 Brown Street, Heidelberg, Victoria 3084

                                 In partnership with

                               The Glenelg Ark Project

                                      April 2010

                 Arthur Rylah Institute for Environmental Research
                   Department of Sustainability and Environment
                                Heidelberg, Victoria
Report produced by: Arthur Rylah Institute for Environmental Research Department of Sustainability and Environment PO Box 137 Heidelberg, Victoria 3084 Phone (03) 9450 8600 Website: www.dse.vic.gov.au/ari © State of Victoria, Department of Sustainability and Environment 2010 This publication is copyright. Apart from fair dealing for the purposes of private study, research, criticism or review as permitted under the Copyright Act 1968, no part may be reproduced, copied, transmitted in any form or by any means (electronic, mechanical or graphic) without the prior written permission of the State of Victoria, Department of Sustainability and Environment. All requests and enquires should be directed to the Customer Service Centre, 136 186 or email customer.service@dse.vic.gov.au Citation: Robley, A., Gormley, A., Woodford, L., Lindeman, M., Whitehead, B., Albert, R., Bowd, M., and Smith, A. (2010). Evaluation of camera trap sampling designs used to determine change in occupancy rate and abundance of feral cats. Arthur Rylah Institute for Environmental Research Technical Report No. 201. Department of Sustainability and Environment, Heidelberg, Victoria. ISSN 1835-3827 (print) ISSN 1835-3835 (online) ISBN 978-1-74242-494-1 (print) ISBN 978-1-74242-495-8 (online) Disclaimer: This publication may be of assistance to you but the State of Victoria and its employees do not guarantee that the publication is without flaw of any kind or is wholly appropriate for your particular purposes and therefore disclaims all liability for any error, loss or other consequence which may arise from you relying on any information in this publication. Front cover photo: Feral cat captured on camera at Anglesea (Alan Robley) Authorised by: Victorian Government, Melbourne Printed by: PRINTROOM 77 St Georges Rd, Preston 3072
Contents
List of tables and figures................................................................................................................. iv
Acknowledgements............................................................................................................................v
Summary............................................................................................................................................1
1        Introduction.............................................................................................................................3
2        Methods....................................................................................................................................5
2.1      Study site...................................................................................................................................5
2.2      Paired camera surveys, 2008.....................................................................................................5
2.3      Single camera surveys, 2009.....................................................................................................6
2.4      Feral cat control, LGNP-south..................................................................................................8
2.5      Occupancy estimation...............................................................................................................8
2.6      Power analysis ........................................................................................................................10
2.7      Feral cat abundance.................................................................................................................10
3        Results ....................................................................................................................................12
3.1      Difference in occupancy rate — paired cameras, 2008 ..........................................................12
3.2      Difference in occupancy rate — single camera, 2009 ............................................................12
3.3      Detection probabilities for occupancy modelling ...................................................................14
         3.3.1          Paired cameras, 2008...............................................................................................14
         3.3.2          Single camera, 2009 ................................................................................................14
3.4      Power analysis ........................................................................................................................15
3.5      Feral cat abundance and control .............................................................................................16
4        Discussion ..............................................................................................................................18
References ........................................................................................................................................21
Appendix 1 .......................................................................................................................................23

                                                                                                                                                    iii
List of tables and figures
List of tables
Table 1. Estimated probability of site occupancy for species detected at LGNP-south and LGNP-
north sites and the probability that site occupancy is higher in the treated site. SE shown in
parentheses. ............................................................................................................................ 12
Table 2. Details of feral cats removed during the control operation. .............................................. 13
Table 3. Details of the model outcomes ranked according to lowest DIC. ...................................... 13
Table 4. Detection probabilities in 2009 by combinations of camera and bait-holder type from
model psi(.)p(camera+bait holder)......................................................................................... 15
Table 5. Estimates of abundance for each area from the best model, along with standard deviation.17
Table A1. Model scores for each model of feral cat abundance in Lower Glenelg National Park –
south....................................................................................................................................... 23
Table A2. Model scores for each model of feral cat abundance in Lower Glenelg National Park –
north. ...................................................................................................................................... 23
List of figures
Figure 1. Location of the Lower Glenelg National Park-south and north sites used in this study. .... 5
Figure 2. Location of 72 paired cameras at LGNP-south (n = 42) and LGNP-north (n = 30). .......... 6
Figure 3. Location of 49 single cameras set up at LGNP-south before and after feral cat control. ... 7
Figure 4. Bait holders used in this study: (a) small wire cage, (b) PVC tube..................................... 7
Figure 5. Location of Victor 1.5 soft jaw traps set in LGNP-south in October 2009......................... 8
Figure 6. Occupancy rate for feral cats before and after control, and the treatment effect of control
on occupancy from model ψ(pd)p(camera). Bars are 95% credible intervals........................ 13
Figure 7. Cumulative mean detection probabilities for feral cats in 2008 using Reconyx (solid line)
and TrailMac (dashed line) cameras. ..................................................................................... 14
Figure 8. Cumulative mean detection probabilities for feral cats at LGNP-south in 2009 using
Reconyx (solid line) and Scout Guard (dashed line) cameras................................................ 14
Figure 9. Results of the power analysis for detecting change in occupancy rate for feral cat control.15
Figure 10. Relationship between the coefficient of variation (CV) and cumulative detection
probability for different levels of occupancy rate, for 22 sites (left) and 49 sites (right). ..... 16
Figure 11. Estimated probability of abundance of feral cats and LGNP-south and LGNP-north.... 17
ivAcknowledgements
Our thanks to Justin Cook (DSE), Julie Quinn (DEWHA) and Guy Ballard (DPI, NSW) for their
support and assistance in this project. We particularly thank Don Pratt (DSE) and the field staff of
Glenelg Ark for the use of their remote cameras and assistance in the field. Micaela Main and
Michael Johnston also assisted in the field. The Department of Environment, Water, Heritage and
the Arts (DEWHA) funded this project (contract no. 48592). The project was also partly funded by
the Glenelg Ark project (DSE), and the Department of Primary Industries, Armidale NSW
provided vehicles and invaluable assistance during the project. Work was conducted under DSE
AEC permit 05/09.
vEvaluation of camera trap sampling designs to determine changes in feral cat populations
Summary
Although many agencies and organisations commit resources to managing feral cats, there remains
a high degree of uncertainty about our ability to accurately and precisely estimate the relative or
absolute abundance of feral cats, or the kill rates obtained in control operations.
In 2007 the Commonwealth Department of Environment, Water, Heritage and the Arts (DEWHA)
commissioned the Arthur Rylah Institute for Environmental Research (ARIER) to undertake
research to evaluate detection methods and sampling designs used to determine the abundance of
feral cats (Felis catus) that have established wild populations in Australia. Stage one of the project,
undertaken at Anglesea in Victoria in September 2007, investigated the detection probability of
cage traps, leghold traps, a DNA sampling device, heat-in-motion activated digital cameras and
sand plots (Robley et al. 2008). This required the capture of feral cats, fitting GPS data-logging
collars, mapping their areas of activity and monitoring their encounter with the various devices.
Digital cameras provided the most robust detection data for feral cats. Modelling of control
efficacy determined that the probability of correctly concluding that a cat population had decreased
was highest for the highest level of monitoring (49 cameras for 20 nights, set at one camera per
2 km2).
An attempt was made to validate the use of heat-in-motion digital cameras in the Grampians
National Park in central western Victoria in February 2008, but no feral cats were captured. A
second attempt was made to validate the approach at Anglesea in March 2008, but only one feral
cat was captured. Further development of the protocol was attempted as part of a research project
investigating the interactions between wild dogs (Canis familiaris), Red Foxes (Vulpes vulpes),
feral cats and Spot-tailed Quolls (Dasyurus maculatus) in Tuggolo State Forest, New South Wales
(Robley 2009a). But although six feral cats were captured, collared and released, none were
detected on the digital cameras.
In July 2008 in south-western Victoria we assessed two different spatial configurations of cameras
as part of the further development of the camera monitoring protocol. In the first configuration,
cameras were set in pairs at selected sites. In the second configuration, one camera was set but at
more sites. Using the first configuration, we compared site occupancy rates of feral cats where the
number of foxes had been reduced (using FoxOff® baiting over the previous five years) to a paired
site where no fox control had taken place (Robley et al. 2009b). We applied the second
configuration to assess differences in occupancy of feral cats before and after a control operation
on the site with the highest level of feral cat occupancy.
We used a Bayesian modelling approach and a mark–recapture model to assess whether there was
a difference in levels of site occupancy and abundance of feral cats between sites where foxes had
been reduced compared to a site where they had not. We used only the Bayesian modelling
approach to assess differences before and after control as insufficient feral cats were detected to
undertake a mark-recapture estimate during this phase.
Both camera configurations provided robust estimates of occupancy (ψ) for feral cats. We were
able to assess a difference in occupancy rate between sites with a history of fox control (ψ = 0.69 ±
0.10 SE) and without (ψ = 0.50 ± 0.13 SE), but not before (ψ = 0.53 ± 0.129 SE) and after (ψ =
0.45 ± 0.137 SE) a lethal cat control operation (because only four cats were killed). We estimated
that, for the given sampling effort (1 camera at 49 sites for 28 days), we would have only been able
to measure a significant change had there been a reduction in occupancy of 44% — much more
than was achieved by the control operation (15%).
The site-level daily detection probabilities for the paired configuration (p = 0.077) and the single
configuration (p = 0.060) were similar, but a comparison between two different brands of camera
Arthur Rylah Institute for Environmental Research Technical Report No 201 1Evaluation of camera trap sampling designs used to determine change in occupancy rate and abundance of feral cats and other cameras showed that detection probabilities varied markedly. There was also a relationship between camera and bait-holder type: wire cage bait-holders with Reconyx cameras had a high detection rate. For a daily detection probability of 0.05, the post control occupancy rate would not have to exceed 0.3 to detect a change with 80% power. Uncertainty about the estimated rate of occupancy is related to detection probability, the level of occupancy itself, and the number of sites sampled. We used the coefficient of variation to assess the difference in precision of occupancy rates. While the overall detection probability at 22 sites with two cameras set for 21 days was higher (81%), than at the 49 sites with a single camera set for 28 days (73%), the occupancy estimate was more precise with a greater number of sites. By comparing the two camera configurations and using different camera and bait holder types, we have shown that the camera protocol is flexible and — importantly — that care needs to be taken in the application of this tool in the field. Camera performance is a critical factor, as well as the physical set-up of the camera in the field. The monitoring protocol is able to detect changes in the abundance of feral cats resulting from control poerations, however the ability to kill cats is limited by the currently available tools, such as cage trapping, which is labour intensive and time consuming. We have demonstrated that the combination of heat-in-motion activated digital cameras and statistical techniques that have been developed for the unbiased estimation of rates of occupancy under conditions of imperfect detection (MacKenzie et al. 2002, Tyre et al. 2003) can robustly determine differences in feral cat populations in temperate eucalypt woodlands and forests. We have also demonstrated that digital cameras can be used to identify individual cats, so that feral cat abundance can be determined. These methods can be used to assess changes in feral cat populations over time, and to assess the success of feral cat control operations. 2 Arthur Rylah Institute for Environmental Research Technical Report No. 201
Evaluation of camera trap sampling designs used to determine change in occupancy rate and abundance of feral cats

1 Introduction
Feral cats (Felix catus) probably became established in Australia soon after the arrival of
Europeans, and wild populations now occupy most parts of the mainland, Tasmania and some
offshore islands (Abbott 2002). Cats kill a wide range of native wildlife (reviewed in Robley et al.
2004), and for this reason are thought to reduce the distribution and abundance of many native
species, especially on islands. Predation by feral cats is listed as a known or perceived threatening
process for 58 native species under the Australian Government’s Environment Protection and
Biodiversity Conservation Act 1999.
Although many agencies and organisations commit resources to managing feral cats (Reddiex et
al. 2004), there remains a high degree of uncertainly about the ability to accurately and precisely
estimate the relative or absolute abundance of feral cats, or the kill rates obtained in control
operations. This limits the ability of policy-makers and managers to judge the effectiveness of
control operations or justify the investment of resources in further operations.
Determining the success of feral cat control operations is problematic. Commonly used monitoring
techniques (e.g., spotlighting, scat counts and sand-plot monitoring) for indexing changes in
populations of other carnivores such as Red Foxes (Vulpes vulpes) or Dingos (Canis lupus dingo)
are either inaccurate or limited (in their application to feral cats) to islands or sandy environments
(Mahon et al. 1998, Edwards et al. 2000, Saunders and McLeod 2007). Feral cats tend not to look
towards spotlights and do not preferentially use roads or tracks (Mahon et al. 1998, Edwards et al.
2000). The proportion of toxic baits taken is also commonly used to report the success of fox and
wild dog control operations. The cues used by cats to locate food are visual and auditory rather
than olfactory, so buried baits are seldom taken by a feral cat, which significantly limits the use of
bait take in monitoring feral cats in eastern Australia where these baits must be buried (Seebeck
and Clunie 1997, DEWHA 2008).
In 2007 the Commonwealth Department of Environment, Water, Heritage and the Arts (DEWHA)
commissioned the Arthur Rylah Institute for Environmental Research (ARIER) to undertake
research to evaluate detection methods and sampling designs used to determine the abundance of
feral cats that have established wild populations in Australia. Stage one of the project was
undertaken at Anglesea, Victoria, in September 2007 and investigated the detection probability of
cage traps, leghold traps, a DNA sampling device, heat-in-motion activated digital cameras and
sand plots (Robley et al. 2008). This required feral cats to be captured, fitted with GPS data-logger
collars and monitor their interactions with the various devices. Digital cameras provided the most
robust detection data for feral cats, with a per camera daily detection probability of 0.013. Data
collected from digital cameras at Anglesea was used to simulate various monitoring intensities and
their ability to correctly identify a 50% decrease in cat abundance, i.e. the efficacy of control. Of
the nine monitoring intensities modelled, all indicated a post-control decrease in cat abundance.
The potential to correctly conclude that the cat population had decreased was highest for the
highest level of monitoring (49 cameras for 20 nights set at one camera per 2 km2), which was
correct 85% of the time. In February 2008 an attempt was made to validate this approach in the
Grampians National Park in central-western Victoria, where habitat and local knowledge
suggested that feral cat abundance was sufficient to expect the capture of feral cats. However,
despite 945 trap nights, no feral cats were caught. A second attempt was made to validate the
approach at Anglesea in March 2008 (852 trap nights), but only one feral cat was trapped.
In May 2008 the project continued with the aim of firstly continuing the development of the
camera monitoring protocol, and secondly to assess its ability to measure a change in cat
abundance following a control operation.

                      Arthur Rylah Institute for Environmental Research Technical Report No 201                       3
Evaluation of camera trap sampling designs used to determine change in occupancy rate and abundance of feral cats Further development of the protocol was attempted in collaboration with a New South Wales Department of Primary Industries research project investigating the interactions between wild dogs (Canis lupus familiaris / Canis lupus dingo), foxes, feral cats and Spotted-tailed Quolls (Dasyurus maculatus) in Tuggolo State Forest, approximately 150 km south-east of Armidale, New South Wales. A combination of leghold and cage traps were set continuously for 22 days (755 leghold trap nights and 220 cage trap nights), resulting in six feral cats being caught. Following the capture, collaring (with GPS-data loggers) and release of the feral cats, 39 heat-in-motion cameras were deployed for an average of 28 days at a density of one camera per 1.7 km2. The variation in this from the protocol resulted from limited access in rugged terrain. No feral cats were detected on the digital cameras in that study. Further details are provided in Robley (2009a). This report outlines the results of a further study undertaken to assess how detection probabilities vary with different camera types and spatial arrangements’ of cameras. In south-western Victoria we assessed two different spatial configurations of cameras: (1) cameras set in pairs over fewer sites, and (2) a single camera set at a greater number of sites. We first compared site occupancy of feral cats at a site where foxes had been reduced using FoxOff® baiting over the previous five years to a paired site where no fox control had taken place (Robley et al. 2009b). We hypothesised that feral cat occupancy rates would be higher on sites with a reduced number of foxes. Having estimated the occupancy rate of feral cats at these sites, we applied the second camera configuration to assess differences in occupancy rates before and after a control operation on the site with the highest rate of feral cat occupancy. We report on the results of these activities and provide recommendations for applying the camera monitoring protocol. 4 Arthur Rylah Institute for Environmental Research Technical Report No. 201
Evaluation of camera trap sampling designs used to determine change in occupancy rate and abundance of feral cats

2 Methods
2.1 Study site
The study site was located in south-western Victoria (141°15′39″E, 38°07′39″S) between the
township of Portland and the Victoria – South Australia border, and within the Glenelg Ark
Project area (Fig. 1). The Glenelg Ark project is a large-scale, continuous fox baiting initiative
using buried FoxOff® baits across 100 000 ha of state forest and national park. Within this area are
three monitoring sites that receive continuous fox control (treatment), and three areas that receive
no fox control (non-treatment). We conducted this project in one of these paired sites, the Lower
Glenelg National Park – south (LGNP-south, 8954 ha; treatment) and north (LGNP-north, 4659
ha; non-treatment) which are physically separated by the Glenelg River.

      SA

                                                                                  #

                              LGNP-North

             LGNP-South

           LEGEND
        Treatment Areas
             TMA
             NTMA
             Roads
        Land Tenure
             Parks and Reserves
             State Forest
             Softwood Plantation                                           Portland     0      5      10 Km
             Other Public Land

Figure 1. Location of the Lower Glenelg National Park-south and north sites used in this study.
TMA – Treatment (fox control) Monitoring Areas, NTMA – Non-treatment Monitoring Areas.
Solid black line – outline of Glenelg Ark project area.

2.2 Paired camera surveys, 2008
We compared occupancy rates for feral cats at the Lower Glenelg National Park – south and north
sites in July 2008 using heat-in-motion digital cameras (Fig. 2). A pool of 72 cameras was
available: 35 Reconyx RapidFire ProPC90s1 and 37 TrailMacs2. In LGNP-south we deployed 42
cameras (19 Reconyx and 23 TrailMac) at 22 sites and in LGNP-north we deployed 30 cameras
(14 Reconyx and 16 TrailMac) at 15 sites (Fig. 2). Two cameras of the same type were located

1
    Reconyx, Holmen, Wisconsin, USA
2
    Trailsense Engineering, Middletown, Delaware, USA

                          Arthur Rylah Institute for Environmental Research Technical Report No 201                      5
Evaluation of camera trap sampling designs used to determine change in occupancy rate and abundance of feral cats
within a randomly selected 1 km2 grid as insurance against a single camera failure. Cameras were
operated for an average of 21 days.
Reconyx cameras record 3.1 mega-pixel colour images during daylight and 3.1 mega-pixel infra-
red images at night. These cameras were set to record three images as fast as possible once motion
was detected and to keep recording images until motion ceased. TrailMac game trail cameras
recorded a six mega-pixel colour image and use a white flash according to lighting conditions.
Images are recorded 30 seconds after motion is detected until motion ceases. All images were time
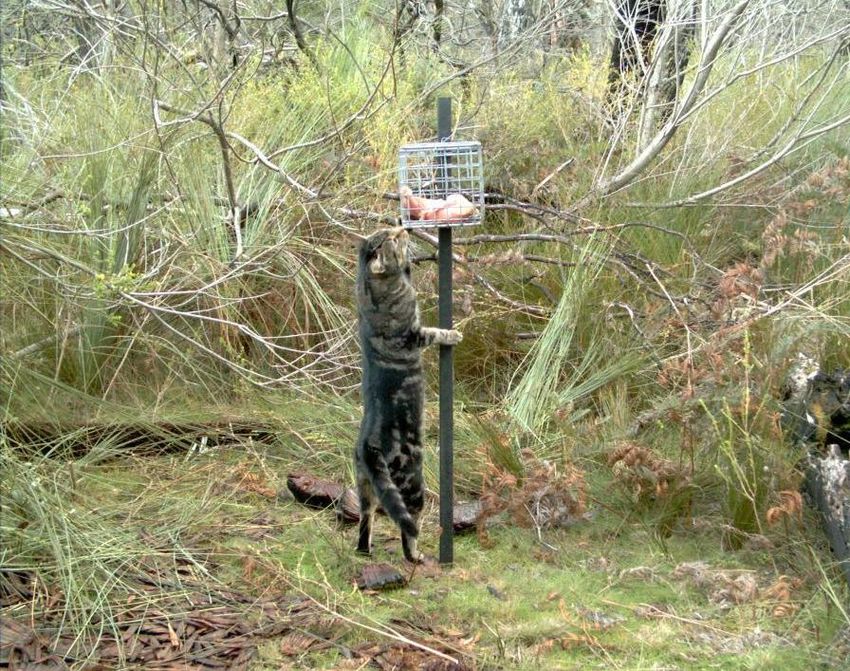
and date stamped. A small wire cage (15 × 15 cm) containing a fresh chicken maryland, 1 or 2
pilchards and tuna oil was fixed to the top of a 1.5 m stake and placed 3 m in front of each camera.
Where necessary, vegetation was cleared from the field of view of the camera to reduce false
triggering of the camera and improve image identification.
#
# #
#
#
# #
#
#
# #
# # #
#
# # #
#
# # # #
#
# # # #
# # # #
# # ##
# # #
# #
# #
#
# # #
# #
# # #
#
#
#
# # #
# #
#
# # #
# #
# #
#
# #
LEGEND
# LGNP-south #
# LGNP-north
Roads
Land Tenure
Parks and Reserves
State Forest N
Softwood Plantation 0 3 6 Km
Other Public Land
Figure 2. Location of 72 paired cameras at LGNP-south (n = 42) and LGNP-north (n = 30).
2.3 Single camera surveys, 2009
Before-control occupancy surveys were conducted at LGNP-south in September 2009 and after-
control occupancy surveys in November 2009. Either a single Reconyx camera (n = 20) or a single
Scout Guard SG550V3 camera (n = 29) was placed at a randomly selected location within a 2 km2
grid (Fig. 3). Cameras were operated on average for 28 days.
3
HCO, Norcross, Georgia, USA
6 Arthur Rylah Institute for Environmental Research Technical Report No. 201Evaluation of camera trap sampling designs used to determine change in occupancy rate and abundance of feral cats
#
#
# #
# #
#
# # # #
#
# #
#
# #
#
# # ## #
#
# # # #
# #
#
# #
#
#
# #
#
# #
# # # # #
#
LEGEND
#
# #
Camera locations #
Roads
Lower Glenelg National
Park - South
Land Tenure
Parks and Reserves
State Forest N
Softwood Plantation 0 3 6 Km
Other Public Land
Figure 3. Location of 49 single cameras set up at LGNP-south before and after feral cat control.
Reconyx cameras operated as described above. Scout Guard cameras recorded a 3.1 megapixel
colour image during the day and a 3.1 megapixel infra-red image at night. Images were recorded
within two seconds of motion being detected, and recording continued until motion ceased. All
images were time and date stamped.
Two bait holder types were used in this survey — either a small wire cage as used in 2008, or a
PVC pipe (25 cm long × 90 mm diameter) capped at both ends and with numerous holes drilled
into the sides (Fig. 4a, b). Each bait holder contained a fresh chicken maryland, 1 or 2 pilchards
and some tuna oil, and was fixed to the top of a 1.5 m stake placed 3 m in front of each camera.
Figure 4. Bait holders used in this study: (a) small wire cage, (b) PVC tube.
Arthur Rylah Institute for Environmental Research Technical Report No 201 7Evaluation of camera trap sampling designs used to determine change in occupancy rate and abundance of feral cats
2.4 Feral cat control, LGNP-south
A professional pest control contractor (Outfoxed Pest Control, Ivanhoe, Victoria) was employed to
trap feral cats in October 2009 from LGNP-south. Seventy-two Victor number 1.5 rubber jaw traps
were set along roads and tracks throughout LGNP-south (Fig. 5). Traps were operated
continuously for 20 days, giving 1368 trap nights. Traps were checked every 24 hours and reset
after rain or being set off by target or non-target animals. Captured feral cats were euthenised at
the point of capture. Each cat had its weight, sex, and reproductive condition recorded.
#
% %
% % %
%
%
% %
% %
% %
% %
% %
%
% % %
%
% %
% % %
% %
% %
% % % %
% %
% %
% % % %
% % %
% %
%
% % %
%
%
% %
%
%
% %
% %
%
% %
%
% % %
% %
%
Legend
Cat trap location
%
Roads
Land Tenure
Parks and Reserves
State Forest
Softwood Plantation
Other Public Land
Figure 5. Location of Victor 1.5 soft jaw traps set in LGNP-south in October 2009.
2.5 Occupancy estimation
We used the proportion of camera sites within a monitoring area (i.e. LGNP-south and LGNP-
north) that were occupied to assess the differences on occupancy rates. The phrase ‘occupancy’ is
used here to mean the proportion of sampling units that contain feral cats at a given point in time.
Data from the camera surveys were summarised into detection histories for each site, where yij = 1
indicated that the species was detected at site i on day j, and yij = 0 otherwise. For example, for a 5
day sampling program, the entire history for a particular site yi = [1,0,0,1,1] would indicate that
cats were detected on the 1st, 4th and 5th day but not on the 2nd or 3rd day.
It is typical of presence/absence data that a species may be present on a site, yet not be detected on
a given day. For example, a detection history such as yi = [0,0,0,0,0] could indicate that the species
was either absent from site i, or it was present but not detected on any of the days. We used the
occupancy modelling approach outlined by MacKenzie et al. (2006) to estimate whether non-
detections were actually true absences. This approach allows us to remove the confounding
between the occupancy rates and the detection probability.
Assuming the daily detection probability (Pr) is constant, the overall probability of each detection
history can be calculated as:
T −n
Pr y i | z iobs = 1 = ψp n (1− p) ( )
T
Pr(y | z i
obs
i = 0)= (1− ψ )+ ψ (1 − p)
8 Arthur Rylah Institute for Environmental Research Technical Report No. 201Evaluation of camera trap sampling designs used to determine change in occupancy rate and abundance of feral cats
where ψ is the occupancy probability, p is the detection probability, n is the number of days
that the species was detected, T is the total number of days cameras were deployed at the site,
and ziobs = 1 indicates that the species of interest was detected at least once on site i, and ziobs =
0 otherwise.
In order to asses whether the monitoring protocol could detect a difference between LGNP-south
and LGNP-north, a model was specified that allowed occupancy to differ between areas.
Furthermore, the model was specified so that detection probabilities were constant each day and
between areas, but could differ between camera types. Note that occupancy is assumed to be
constant in each area over the monitoring period (i.e. 21 days in July 2008).
In analysing the single camera survey, six occupancy models were specified. Occupancy
probabilities could differ between LGNP-south and LGNP-north, but were assumed to be constant
for the duration of each survey (i.e. 30 days in September 2009 and 21 days in November 2009).
The six models specified were:
• occupancy and detection constant
• occupancy constant and detection varies with camera type
• occupancy constant, and detection varies with camera and bait holder combination
• occupancy varies with survey period, and detection varies with camera type
• occupancy varies with survey period, and detection varies with camera and bait holder
• occupancy varies with survey period, and detection varies with camera and bait holder and
period
Occupancy models were fitted using WinBUGS 1.4.3 (Lunn et al. 2000), a program for deriving
Bayesian parameter estimates using Monte Carlo Markov chain updaters. A Markov chain was run
for 5000 iterations in order to check for convergence and to ensure each parameter had reached a
stable distribution. These ‘burn-in’ samples were discarded and the algorithm was run for a further
40 000 iterations. The values from each iteration comprised the posterior distribution for each of
the parameters. The posterior distributions were summarised in terms of parameter means and
standard deviations (SD).
Competing models that were used to assess occupancy before and after control in 2009 were
assessed using the deviance information criterion (DIC). The model with the lowest DIC is the one
that is the most parsimonious model, i.e. the one that gives the best balance between precision and
bias. The DIC is given as DIC = D + pD , where D is the posterior mean of the deviance and pD is
the effective number of parameters, given by pD = D − Dˆ (Spiegelhalter et al. 2002). Dˆ is a point
estimate of the deviance evaluated at the posterior means of the parameters. DIC can be rewritten
as:
DIC = 2D − Dˆ
In general WinBUGS returns the DIC directly, but for models constructed from a mixture of
distributions, such as the one used here, this is not the case. However, the deviance is able to be
monitored, which allows the calculation of DIC for each model using a two-step process. Firstly,
the estimation model is run with the mean deviance giving D . The model is then re-run with the
mean parameter estimates plugged in as data. The mean of the deviance in this case gives Dˆ .
The probability that site occupancy was higher on the LGNP-south site or before feral cat control
was determined by calculating occupancy at LGNP-south minus LGNP-north, and occupancy
before minus after control, at each iteration of the WinBUGS updating process. The proportion of
the posterior density of this difference that is greater than zero gives the probability that site
occupancy is higher.
Arthur Rylah Institute for Environmental Research Technical Report No 201 9Evaluation of camera trap sampling designs used to determine change in occupancy rate and abundance of feral cats 2.6 Power analysis The power of a statistical test is the probability of not falsely concluding that an outcome has occurred when it has not; in this case, that the cat population has decreased when in fact it has not. As the power of a test increases, the chance of making this error decreases. A power analysis was carried out to determine what level of power we had to detect an actual difference in occupancy rate following a cat control operation. We based the power analysis on the study design in 2009, i.e. cameras at 49 sites with each camera set for 28 days. The pre-control occupancy rate was held constant at 0.53, whilst the post-control occupancy rate was set at various levels between 0.1 and 0.5, representing various levels of control efficacy. For each level we randomly generated the site occupancy and the subsequent detection history based on a daily detection probability of 0.05. The occupancy rate was estimated from the resulting data, along with its corresponding confidence interval. When the confidence interval minus the pre-control occupancy rate excluded zero, this indicated that a significant difference would have been detected. This process was repeated 1000 times, with the proportion of times that a difference was detected used as the power to detect that difference. This was repeated for the different levels of occupancy rate, and at different levels of daily detection probability (0.02 and 0.1). Uncertainty around the estimated rate of occupancy is related to detection probability, the level of occupancy itself, and the number of sites. We used the co-efficient of variation (the ratio of the standard deviation of the estimate to its mean) to assess the difference in precision of occupancy rates (0.3, 0.5, 0.7 and 0.9) over a range of detection probabilities (0.2 to 1.0) for more and less sites. 2.7 Feral cat abundance We assessed feral cat abundance in 2008 at LGNP-south and LGNP-north by indentifying individuals based on multiple images of feral cats captured by cameras and noting coat colouration, markings, and banding. Detections of cats at camera sites were included in the analysis only if multiple images were recorded showing both flanks, the head and the back of the cat. Coat colouration was divided into four basic types, black, ginger, and tabby, with tortoise shell included as a subset of tabby. Tabbies were further divided into five types of coat pattern, each possessing unique markings. Individuals within a coat type, eg classic tabby, could be identified from individual patterns from multiple images. A ‘classic tabby’ has bold, swirling patterns on its sides. The pattern of circular blotches (or smudges) on the body closely resembles a bullseye. A ‘mackerel tabby’ has narrow stripes running down the sides in a vertical pattern. The stripes are unbroken lines; evenly spaced, which branch out from one stripe that runs along the top of the cat's back down the spine, resembling a fish skeleton. A ‘spotted tabby’ has spots all over its sides. These spots can be large or small, and sometimes appear to be broken mackerel stripes. They can be round, oval or rosettes. A ‘ticked tabby’ (sometimes called Abyssinian tabby or agouti tabby) does not have the traditional stripes or spots on its body. However, like all tabbies, this coat pattern has tabby markings on the face and agouti hairs on the body. A ‘tortoise-shell tabby’ has separate patches of brown tabby and red tabby on the same animal. Tortoise-shell tabbies can show any one of the above four distinct tabby patterns. The markings are usually more apparent on the legs and head. 10 Arthur Rylah Institute for Environmental Research Technical Report No. 201
Evaluation of camera trap sampling designs used to determine change in occupancy rate and abundance of feral cats

For each site survey a capture history matrix X was constructed where Xij = 1 indicates capture of
cat i during period j, and Xij = 0 denotes non-capture. All individuals in the population were
assumed to be present throughout the duration of the survey, i.e. the population was assumed to be
closed to births, deaths and migration. A broad class of capture-recapture models, called closed
population models, can be used to analyse this type of data (Otis et al. 1978). The simplest model
(M0) assumes that each individual has a constant capture probability across time periods that is
independent of whether it has been captured before. General models exist that allow capture
probabilities to differ with time (Mt), with a behavioural response to capture (Mb), with the
individual cat because of heterogeneous capture probabilities (Mh), or combinations of these
factors (Mth, Mtb, Mbh, Mtbh). We used the method of finite mixtures that allows for individuals to
belong to one of the eight classes of capture probabilities listed above (Pledger 2000).

                      Arthur Rylah Institute for Environmental Research Technical Report No 201                       11
Evaluation of camera trap sampling designs used to determine change in occupancy rate and abundance of feral cats 3 Results 3.1 Difference in occupancy rate — paired cameras, 2008 While primarily focused on the ability of the camera monitoring protocol to assess differences in the occupancy rate of feral cats between LGNP-south and LGNP-north, we also included six native species and the red fox as we had sufficient detections to undertake the analyses. The monitoring protocol detected a difference in occupancy rate of feral cats between the two sites. The estimated probability of occupancy for feral cats was greater at LGNP-south (ψ = 0.69 ± 0.10 SE) compared to LGNP-north (ψ = 0.50 ± 0.13 SE) during 2008. The probability that occupancy rates were higher at LGNP-south was 0.88 (i.e. 88%; Table 1) suggesting that the cat population was more prevalent at LGNP-south. The monitoring protocol also estimated the probability of occupancy for foxes at LGNP-south (ψ = 0.24 ± 0.17 SE) as much lower than that for LGNP-north (ψ = 0.60 ± 0.21 SE; Table 1). The probability that site occupancy was higher at LGNP-south was very low for foxes (0.04 or 4%), suggesting that foxes are significantly more common in LGNP-north. Southern Brown Bandicoots (Isoodon obesulus) were significantly more widespread in LGNP- south, whereas Red-necked Wallabies (Macropus rufogriseus) and Common Ringtail Possums (Pseudocheirus peregrinus) were significantly more common in LGNP-north (Table 1). The results from other species were more equivocal. Table 1. Estimated probability of site occupancy for species detected at LGNP-south and LGNP- north sites and the probability that site occupancy is higher in the treated site. SE shown in parentheses. Species LGNP-south LGNP-north Pr(south > north) Feral Cat 0.69 (0.10) 0.50 (0.13) 0.88 Southern Brown Bandicoot 0.67 (0.18) 0.15 (0.11) 0.99 Swamp Wallaby 0.57 (0.16) 0.50 (0.17) 0.65 Common Brushtail Possum 0.58 (0.08) 0.56 (0.09) 0.59 Western Grey Kangaroo 0.34 (0.11) 0.43 (0.13) 0.27 Red Fox 0.24 (0.17) 0.60 (0.21) 0.04 Red-necked Wallaby 0.38 (0.11) 0.71 (0.13) 0.02 Common Ringtail Possum 0.13 (0.11) 0.52 (0.21) 0.01 3.2 Difference in occupancy rate — single camera, 2009 In October 2009 we removed two female and two male feral cats from the LGNP–south after 1368 trap nights - acapture rate of 0.3 cats per 100 trap nights (Table 2). Of the six occupancy models tested for the 2009 data, the most parsimonious model was for constant occupancy (ψ = 0.336) and constant detection probability (p = 0.045) before and after cat control (Table 3). 12 Arthur Rylah Institute for Environmental Research Technical Report No. 201
Evaluation of camera trap sampling designs used to determine change in occupancy rate and abundance of feral cats

Table 2. Details of feral cats removed during the control operation.
 Date                                    Sex           Weight (kg)

 11/10/09                                F             5.0

 14/10/09                                F             3.0

 15/10/09                                M             3.5

 25/10/09                                M             5.0

Table 3. Details of the model outcomes ranked according to lowest DIC.
Model                                                        Description                                       Parameters   DIC

ψ(.), p(.)                                                   Occupancy and detection constant                        2      320.5

ψ(.), p(camera)                                              Detection varies with camera type                       3      331.5

ψ(.), p(camera+bait holder)                                  Detection varies with camera and bait holder            4      332.6

ψ(pd), p(camera)                                             Occupancy varies with period and detection              4      333.1
                                                             varies with camera

ψ(pd), p(camera+bait holder)                                 Occupancy varies with period and detection              5      337.8
                                                             varies with camera and bait holder

ψ(pd), p(camera+bait holder                                  Occupancy varies with period and detection              6      341.2
+pd)                                                         varies with camera and bait holder and period

The highest ranked model that allowed for a difference between before and after control
occupancy rates was model ψ(pd), p(camera), with estimates of occupancy before of ψ = 0.53 ±
0.129 SE and after of ψ = 0.45 ± 0.137 SE. Based on this model, there was a 68% chance of a
decrease in occupancy by feral cats following control (Fig. 6). However, the 95% credible limits of
the treatment effect overlap zero indicating that a significant effect of treatment was not
detectable; .e. removing four individuals was not enough to show a significance difference in
occupancy rates.

                                 1

                               0.8
    Relative occupancy rates

                               0.6

                               0.4

                               0.2

                                 0

                               -0.2

                               -0.4

                               -0.6
                                      Before control         After control    Treatment effect

Figure 6. Occupancy rate for feral cats before and after control, and the treatment effect of
control on occupancy from model ψ(pd)p(camera). Bars are 95% credible intervals.

                                              Arthur Rylah Institute for Environmental Research Technical Report No 201             13
Evaluation of camera trap sampling designs used to determine change in occupancy rate and abundance of feral cats
3.3 Detection probabilities for occupancy modelling
3.3.1 Paired cameras, 2008
The site level daily detection probabilities for feral cats per site in 2008 differed between Reconyx
cameras (p = 0.077) and TrailMac cameras (p = 0.054). These daily detection probabilities
translate into an 81% and 69% chance of at least one feral cat at an occupied site being detected
over 21 days for Reconyx and TrailMac cameras respectively (Fig. 7).
0.9
0.8 Reconyx
TrailMac
0.7
Detection Probability
0.6
0.5
0.4
0.3
0.2
0.1
0
1 2 3 4 5 6 7 8 9 10 11 12 13 14 15 16 17 18 19 20 21
Days
Figure 7. Cumulative mean detection probabilities for feral cats in 2008 using Reconyx (solid
line) and TrailMac (dashed line) cameras.
3.3.2 Single camera, 2009
The site-level daily detection probabilities for feral cats per site in 2009 differed significantly
between Reconyx cameras (p = 0.060 ± 0.018 SE) and Scout Guard cameras (p = 0.017 ±
0.029 SE). After 28 days these daily probabilities correspond to cumulative detection probabilities
of 82% and 37% for Reconyx and Scout Guard respectively (Fig. 8).
0.9
Reconyx
0.8
ScoutGuard
0.7
Detection Probability
0.6
0.5
0.4
0.3
0.2
0.1
0
1 2 3 4 5 6 7 8 9 10 11 12 13 14 15 16 17 18 19 20 21 22 23 24 25 26 27 28
Days
Figure 8. Cumulative mean detection probabilities for feral cats at LGNP-south in 2009 using
Reconyx (solid line) and Scout Guard (dashed line) cameras
14 Arthur Rylah Institute for Environmental Research Technical Report No. 201Evaluation of camera trap sampling designs used to determine change in occupancy rate and abundance of feral cats
The highest ranked model that considered bait-holder was model psi(.)p(camera+bait holder)
(Table 4). From this model, Reconyx cameras had a higher detection probability than Scout Guard
cameras. There was an effect of bait-holder type, with wire cages having a higher detection
probability than PVC pipe. The highest combination of daily detection probability was from a
combination of Reconyx cameras and wire cage (Table 4).
Table 4. Detection probabilities in 2009 by combinations of camera and bait-holder type from
model psi(.)p(camera+bait holder) SE shown in parenthesis.
Camera Bait holder Detection probability
Reconyx wire cage 0.071 (0.018)
Reconyx PVC 0.043 (0.016)
Scout Guard wire cage 0.019 (0.010)
Scout Guard PVC 0.011 (0.005)
3.4 Power analysis
For each level of daily detection probability (0.10, 0.05, 0.01) the power to detect a reduction in
occupancy increases as the difference between pre-control and post-control increased. Higher
detection probabilities had an increasing power to detect a difference (Fig. 9).
In the 2009 study at LGNP-south the initial pre-control occupancy rate was 0.53, and following
control it was 0.45, although this difference was not statistically significant (Fig. 6). Based on the
power analysis, there was only a 20% chance of detecting a significant decrease in occupancy as
measured after the cat control operation.
1.0
p=0.10
0.8
p=0.05
p=0.02
0.6
Power
0.4
0.2
0.0
0.0 0.1 0.2 0.3 0.4 0.5 0.6 0.7
Occupancy Rate
Figure 9. Results of the power analysis for detecting change in occupancy rate for feral cat
control.
Arthur Rylah Institute for Environmental Research Technical Report No 201 15Evaluation of camera trap sampling designs used to determine change in occupancy rate and abundance of feral cats
The results of the power analysis indicate that, for an average daily detection probability of 0.05,
post-control occupancy rates needed to be reduced to (at most) 0.3 in order to have an 80% power
of detecting a significant difference.
The uncertainty around the estimated rate of occupancy is related to detection probability, the level
of occupancy itself, and the number of sites. An exploration of the precision of occupancy
estimates (i.e. lower CV) showed that precision improves with higher detection probability, as well
as with higher occupancy rate. However, the precision markedly improves with an increase in the
number of sites from 22 to 49 (Fig. 10), regardless of the number of cameras set at a site. For
example, for an overall detection probability of 0.8 and an occupancy rate of 0.5 the CV of
occupancy for 22 sites is 0.26 and for 49 sites 0.17. This represents an increase in precision of
33%.
1.0 1.0
Occupancy Rate Occupancy Rate
0.8 0.3 0.8 0.3
0.5 0.5
Coefficient of variation for occupancy
Coefficient of variation for occupancy
0.7 0.7
0.9 0.9
0.6 0.6
0.4 0.4
0.2 0.2
0.0 0.0
0.0 0.2 0.4 0.6 0.8 1.0 0.0 0.2 0.4 0.6 0.8 1.0
Overall detection probability after 21 days Overall detection probability after 21 days
Figure 10. Relationship between the coefficient of variation (CV) and cumulative detection
probability for different levels of occupancy rate, for 22 sites (left) and 49 sites (right).
3.5 Feral cat abundance and control
In 2008, a minimum of 15 individual cats were identified from photographs in LGNP-south and 6
in LGNP-north. The most appropriate model for abundance at LGNP-south was Mh (individuals
may have different photo-capture probabilities from one another, but these remain the same across
time periods). For LGNP-north the selected model was M0 (all individuals have the same
probability of capture in all time periods). Details of model outcomes are provided in Appendix 1.
Based on the model selection outcomes we assessed abundance of feral cats in LGNP-south and
LGNP-north (Figure 11; Table 5). There were significantly more feral cats on the south site (n =
19 ± 4.82 SD) compared to the north (n = 6.7 ± 1.08 SD).
16 Arthur Rylah Institute for Environmental Research Technical Report No. 201Evaluation of camera trap sampling designs used to determine change in occupancy rate and abundance of feral cats
10 15 20 25 30 35 40 5 10 15 20
Estimated Abundance Estimated Abundance
Figure 11. Estimated probability of abundance of feral cats and LGNP-south and LGNP-north.
In these plots, the values less than 15 and 6 from the south and north plot are not sampled in the
Winbugs mark-recapture model. These values are less than the minimum number known, so they
would be an impossible value.
Table 5. Estimates of abundance for each area from the best model, along with standard
deviation.
Area Model Mean SD
South Mh 19.87 4.82
North M0 6.7 1.08
Arthur Rylah Institute for Environmental Research Technical Report No 201 17Evaluation of camera trap sampling designs used to determine change in occupancy rate and abundance of feral cats 4 Discussion Our aim was to further develop the camera monitoring protocol established in earlier work (Robley et al. 2008) and to assess its ability to measure change in a feral cat population before and after lethal control. The monitoring protocol developed earlier indicated 49 cameras set for 20 days at one camera per site would be sufficient to detect a 50% decrease in feral cats 15% of the time. In the first part of this current work we set 44 cameras at 22 sites (two cameras per site) for an average of 21 days to investigate if dual cameras at a lower number of sites would detect and assess differences in site occupancy rates of feral cats. Dual cameras have been used to successfully detect Spotted-tailed Quoll (Nelson and Scroggie 2009). In addition to increasing detection probability, having two cameras per site allows for camera failure at a site. In the second part of this current work we attempted to validate the initial monitoring protocol by assessing changes in occupancy before and after a feral cat control operation. We used an occupancy modelling approach and a mark- recapture model in the first part, and an occupancy modelling approach only in the second part to assess if there was a difference in levels of site occupancy and abundance of feral cats between sites. The monitoring protocol using paired cameras was successful at assessing a difference in site occupancy rate between a site that had been subject to sustained fox control for the previous five years (LGNP-south: ψ = 0.69 ± 0.10 SE) and one that had not (LGNP-north: ψ = 0.50 ± 0.13 SE), and did so with a high degree of confidence (88%). We were also able to assess a significant difference in occupancy rates for foxes between sites, with lower levels of occupancy on the site subject to fox control. We have no pre-fox control data on feral cat occupancy rate to indicate if the difference in occupancy is associated with a decline in foxes. It is possible the removal of a dominant or apex predator can result in the release of a subdominant or mesopredator, which in turn can lead to increased rates of predation on shared food resources (reviewed by Richie and Johnson 2009). However, these authors do not cite evidence for mesopredator release between foxes and feral cats, but do note that mesopredator release is widespread geographically and taxonomically. The monitoring protocol using a single camera at 49 sites was able to successfully estimate occupancy rates for feral cats before (ψ = 0.53 ± 0.129 SE) and after (ψ = 0.45 ± 0.137 SE) cat control. However, this was not the most parsimonious outcome from the modelling, which was that occupancy was constant between periods. The fact that we were unable to detect a significant difference in feral cat occupancy after the feral cat control operation was probably because of the small number of feral cats killed (n = 4), despite 1368 trap nights. Power analysis indicated that we had little power to detect the small change in occupancy that was measured. However, the analysis also indicated that a reduction in feral cat occupancy from 0.53 to 0.3 would have had greater than 80% power to detect a significant reduction. In pest control it is generally assumed that a reduction in abundance leads to a reduction in the damage caused by the pest (Braysher 1993, Hone 1994). Where eradication is not feasible, the reduction in abundance is achieved by stopping population growth following initial control. However, after a population reduction a higher rate of population growth generally occurs. Thus, this higher growth rate needs to be prevented after control in order to maintain the lower abundance (Hone 1994). Management operations to stop subsequent growth following the initial control would aim to keep the population at or below the lower level (Hone 1994). It is possible to estimate the point at which the population would be kept at or below this threshold level using the equation 18 Arthur Rylah Institute for Environmental Research Technical Report No. 201
Evaluation of camera trap sampling designs used to determine change in occupancy rate and abundance of feral cats

                                                    p = 1 – e–r
where r is the instantaneous rate of annual increase.4 As an example, Short and Turner (2005)
estimated the annual rate of increase for two populations of feral cats in semi-arid coastal Western
Australia. Using the average of their estimates (0.985), the annual proportional threshold reduction
in feral cats needed would be 1 – (e–0.985) = 0.63, or 63%. The monitoring protocol used in this
study would be capable of measuring such a level of change in occupancy rate. Caution is required
however, as a 63% reduction in occupancy is not the same as a 63% reduction in abundance.
Site-level daily detection probabilities differed between camera set ups (two per site versus one per
site) and camera types. The detection probability for paired Reconyx cameras was slightly higher
(p = 0.077) than for a single Reconyx (p = 0.060). There was also an interaction between camera
and bait holder; the combination of Reconyx cameras and cage bait-holders having a higher
detection probability than any other camera – bait-holder combination. A range of factors can
contribute to successful detection of a species, relating to camera function and operation (Nelson
and Scroggie 2009). In this study, care was taken to ensure all camera types were set up in the
same manner each time, so the differences in detection rates of feral cats were more likely caused
by differences in camera performance and not the spatial arrangement of cameras or underlying
behavioural difference in cats. In particular, the speed at which a camera can power up and capture
an image once motion is detected is a critical factor.
The cost and subsequent performance of digital cameras activated by heat-in-motion varies greatly
between brands. Careful consideration needs to be given to the performance parameters of cameras
used for estimating changes in occupancy rates when assessing the effectiveness of management
actions.
We examined the uncertainty around the estimated occupancy rates when running paired cameras
for 21 days at 22 sites compared to single cameras at 49 sites for the same length of time. Despite
there being a slightly better chance of detecting a feral cat at an occupied site with paired cameras,
the precision of the occupancy estimate was higher with a single camera at more sites. While there
would be some additional cost for operating more sites, this would be offset by the increased
precision in the estimate of occupancy and the improved power to detect any change that has
occurred.
By comparing the two spatial configurations of cameras and using different camera and bait-holder
types, we have shown that the camera protocol is flexible and that care needs to be taken in
applying this tool in the field. Factors other than the spatial arrangement of cameras can have a
significant impact on detection probability. The ability of the monitoring protocol to detect change
in a cat population is not limited by the protocol, as shown by the clear difference between the
LGNP-south and LGNP-north sites and the results of the power analysis, but either by the ability
to kill substantial numbers of feral cats with the current methods, or by the resources available.
However, a reduction of 50% in a feral cat population is probably the lower limit of what could be
deemed a successful control operation.
The analytical approach used in this study allows for the degree of change to be assessed and the
confidence with which this has occurred, enabling managers to assess the effectiveness of their
control program.
The choice of which camera configuration to use would in part be determined by the resources
available; we recommend one camera over at least 50 sites for areas of tis size operated over at
least 21 days. The spatial separation of cameras is a subject that requires further investigation.

4 For more details and a full discussion on this topic, see Caughley (1980) and Hone (1994).

                      Arthur Rylah Institute for Environmental Research Technical Report No 201                       19
You can also read