Predation of Eurasian lynx on roe deer and red deer in Białowieża Primeval Forest, Poland
←
→
Page content transcription
If your browser does not render page correctly, please read the page content below
A c t a T h e r i o l o g i c a 42 (2): 2 0 3 - 2 2 4 , 1997.
PL ISSN 0 0 0 1 - 7 0 5 1

        P r e d a t i o n of E u r a s i a n l y n x on roe d e e r a n d red d e e r
                             in B i a ł o w i e ż a P r i m e v a l Forest, P o l a n d

       Henryk OKARMA, Włodzimierz JĘDRZEJEWSKI, Krzysztof SCHMIDT,
                            Rafał KOWALCZYK and Bogumiła JĘDRZEJEWSKA*

          Okarma H., Jędrzejewski W., Schmidt K., Kowalczyk R. and Jędrzejewska B. 1997.
          Predation of Eurasian lynx on roe deer and red deer in Białowieża Primeval Forest,
          Poland. Acta Theriologica 42: 203-224.
              Patterns of lynx Lynx lynx (Linnaeus, 1758) predation on ungulates were studied
          in the Polish p a r t of Białowieża Primeval Forest (580 km 2 ) from scats and prey
          remains of lynx between 1985-1996, and radiotracking of 18 lynx between 1991-1996.
          Cervids were the main prey and constituted 90% of food biomass consumed (analysis
          of faeces) and 84% of prey killed. Roe deer Capreolus capreolus was positively selected
          by all lynx (though stronger by females and subadults than by adult males). Fawns
          and adult roe deer of both sexes were preyed on in proportion to their abundance in
          the population. Red deer Cervus elaphus was taken less often than would have been
          expected at random, and fawns were positively selected by lynx. On average, lynx
          spent 76 h (3.2 days) feeding on a killed deer (from 38 h in a female with 3 kittens
          to 105 h in single adult females). Mean searching time (ie time from leaving the
          remains of one deer to killing another one) was 52 h (2.2 days); from 10 h in a female
          with 3 young to 104 h in subadults. Thus, the average kill rate by lynx was one deer
          per 5.4 days. Predation impact of lynx population on roe and red deer was estimated
          in 1991-1996, when recorded numbers were 288-492 roe deer and 359-607 red deer
          per 100 km" in late winter (March), and 501-820 roe deer and 5 1 4 - 8 5 8 red deer per
          100 km" in spring (May/June). During t h a t period densities of deer declined markedly
          due to deliberately elevated hunting harvest by forestry personnel, aimed at reduction
          of game damage to silviculture. Densities of adult lynx were little variable (2.4-3.2
          inds/100 km ), but reproduction rate strongly varied in response to deer decline, from
          0.67 juv/adult lynx in 1991/92 to 0.25 juv/adult lynx in 1995/96. Annually, lynx
          population killed 110-169 roe deer/100 km 2 , which constituted 21-36% of spring
          (seasonally highest) numbers of roe deer. Lynx predation was the most important
          factor of roe deer mortality. Furthermore, lynx population took 42-70 red deer/100
          km annually, which constituted 6-13% of spring number of red deer. In red deer
          mortality, lynx predation played an inferior role to hunting harvest and wolf predation.

          Mammal Research Institute, Polish Academy of Sciences, 17-230 Białowieża, Poland
          (HO, WJ, KS, RK); Workshop for Ecology and Protection of the Natural Environment,
          17-230 Białowieża, Poland (BJ)
          Key words'. Lynx lynx, Capreolus capreolus, Cervus elaphus,     kill rate, ungulates, prey
                      selection

*Present address: Mammal Research Institute, Polish Academy of Sciences, 17-230 Białowieża,
 Poland

                                                                [203]
204                                H. O k a r r a a et al.

                                   Introduction

    In the field of large predator-ungulate relationships in the Holarctic zone, most
contemporary knowledge comes from North American studies on wolves Canis
lupus, moose Alces alces, white-tailed deer Odocoileus virginianus, and caribou
Rangifer tarandus. Most researchers t h a t studied North American large predators
(wolves and/or bear) reported on their limiting effect on ungulates (eg Seip 1992,
Van Ballenberghe and Ballard 1994). In his recent reviews and syntheses, Messier
(1994, 1995) came to the conclusion that wolf predation appeared density-depen-
dent at the lowest range of moose densities, but it was inversely density-dependent
at higher densities.
    The relationship between ungulates and large predators in the Palearctic may
differ markedly from those in the Nearctic region, due to higher richness of both
ungulate and predator communities in Eurasia. For instance, in the forests of
Europe, up to five coexisting species of ungulates are subject to predation by (most
typically) three large carnivores (eg Okarma 1995, Okarma et al. 1995), to say
nothing of the temperate forests in the Russian Far East (eg Sikhote-Alin Reserve),
where seven large carnivores coexist with seven species of ungulates (Rakov 1979).
A diverse spectrum of potential prey most likely affects both functional and nu-
merical responses by predators, and - in consequence - the total predation rates.
     Eurasian lynx Lynx lynx (Linnaeus, 1758) is an interesting species for studying
predation. In Europe, ungulates replace hare in lynx diet along the North-South
gradient. In temperate forests ungulates, particularly the roe deer Capreolus
capreolus, constitute the bulk of lynx prey (Jędrzejewski et al. 1993). Furthermore,
in large forest tracts of central and eastern Europe, lynx was reported to attain
densities up to 6 individuals per 100 km (Zheltukhin 1986, Jędrzejewski et al.
 1996). Consequent upon these facts can be the high and significant predation by
lynx on cervids. Indirect evidence for this was provided by Gaross (1979), who
compared roe deer densities in 107 randomly selected forest administration units
in Latvia. He found, on average, 7.8 roe deer/km in forests where neither lynx
                                                    o

nor wolf occurred, compared to 2.8 deer/km in forests with lynx populations.
    In this paper we present the results of our long-term study on predation by
the Eurasian lynx on ungulates in the deciduous and mixed forests in Eastern
Poland. We aimed at showing: (1) the mechanisms of prey selection and functional
response of lynx to varying availability of roe deer and red deer Cervus elaphus;
(2) rates of killing and consumption of deer by radio-collared lynx; and (3) lynx
predation on deer in relation to their density. Finally, we discussed the mecha-
nisms and sources of variation in lynx predation on ungulates in the pristine
forests of Europe.
Prédation of lynx on deer                                     205

                                                   Study area

    Białowieża Primeval Forest (BPF) of 1,250 km 2 is the best preserved woodland of its size in
lowland temperate Europe. It is located on the Polish-Belarussian border. Tree stands of BPF are
dominated by oak Quercus robur, hornbeam Carpinus betulus, black alder Alnus glutinosa, spruce
Picea abies, and pine Pinus silvestris. Detailed information on vegetation is given by Faliński (1986).
The Polish part of BPF, where this study was conducted (580 km 2 ), consists of exploited (530 km 2 )
and strictly protected (47 km 2 ) parts. The exploited forests (average age 72 years) undergo timber
harvest, reforestation, and game hunting. In the protected part (Białowieża National Park = BNP),
most of the tree stands (average age 130 years) are of natural origin. Neither exploitation of timber
nor game hunting is allowed in the BNP.
    BPF harbours a rich community of ungulates: European bison Bison bonasus, moose, red deer, roe
deer, and wild boar Sus scrofa (Jędrzejewska et al. 1994). The bison is a protected species, and its
population size is kept stable by yearly culling. The four other species of ungulates are hunted in the
exploited part of BPF. The pristine guild of large carnivores was impoverished in the 19th century by
extermination of brown bear Ursus arctos and currently it contains two species, the wolf and the lynx.
During the last 150 years, numbers of wolf and lynx ranged from near 0 (after prolonged predator
control) to very high (Jędrzejewska et al. 1996, Jędrzejewski et al. 1996).

                                       Material and m e t h o d s

                          A n a l y s i s of l y n x p r e y a n d d i e t c o m p o s i t i o n
    Between 1985-1996, a total of 139 lynx scats was collected and analysed according to the
procedure described by Jędrzejewski et al. (1993). Prey were identified by bone, hair, and feather
remains, and the relative shares of various prey were presented as percentage occurrence in the total
sample of scats, and percentage of biomass consumed by lynx (see Jędrzejewski et al. 1993 for details).
Between 1987-1996, a total of 172 prey remains was found during snowtracking and radiotracking of
lynx. In the case of roe deer and red deer carcasses, the age (according to the tooth wear, after
Lochman 1987 and Pielowski 1988) and sex were identified whenever possible. The bones of one hind
leg were removed from deer carcasses for marrow analysis. Marrow samples of 2 0 - 3 0 grams were
taken from the middle part of the femur, tibia, and metatarsus. Percentage of fat in bone marrow was
estimated on the basis of dry-weight method (Neiland 1970), which had already been tested for roe
deer (Ratcliffe 1980) and red deer (Okarma 1989).

                     E s t i m a t i n g of l y n x p r e d a t i o n i m p a c t o n u n g u l a t e s
    Between 1991-1996, eighteen lynx were livetrapped and radiocollared (see Jędrzejewski et al.
1996). The bulk of data presented in this paper comes from 11 individuals t h a t were radiotracked for
> 1 year. Radiotracking was conducted 5 to 7 days a week. In addition to daily locations, a continuous
5-day radiotracking session of a selected lynx was conducted once a month in 1994-1995, and less
regularly (1-5 days) in 1991-1993. During continuous tracking sessions, five persons worked in
8-hour shifts. A person followed the lynx within a distance of 0.5-1 km. To find lynx kills, each time
the lynx stayed in one place for at least several hours we tried to locate it precisely by taking two
bearings from perpendicular roads nearest to the lynx or by quiet approaching it to a distance of about
150-200 m (but not closer in order not to disturb it). Such precise localisations were done at the time
when we expected the lynx to be feeding on a prey (ie from dusk till late evening). Some lynxes were
equipped with radiocollars with an activity switch, which made the time of feeding recognizable. After
the lynx had left the spot, we searched that place carefully for prey remains. We succeeded in about
50% of our searching attempts.
206                                                                  H. O k a r r a a et al.

     If we were successful in finding one or more prey during a continuous 5-day tracking, we extended
the closer observations of the same lynx by localising it at least twice daily (during a day and at night)
for several days (up to one month). All locations where a lynx was localized repeatedly were searched.
If a lynx stayed in the same place for a relatively short time (less than two days) and we did not find
any prey remains, we assumed that lynx did not have any larger prey (an ungulate). If the lynx stayed
longer in the same spot and we failed to find its prey, we assumed that the lynx actually killed an
ungulate but we were unsuccessful in finding it.
    For each ungulate prey found during continuous radiotracking sessions, we calculated the time of
its consumption by lynx (Tc, in hours). For all series of consecutively killed prey (when two or more
consecutive prey were found), we calculated the searching time by a lynx (Ts, in hours), ie the time
span from leaving an ungulate carcass to killing another ungulate. We also measured the straight-line
distance between consecutive kills.
    The killing rate (K), ie the number of roe deer and red deer killed by a lynx per month was
calculated according to the following formulas:
                                               Kroe = 7 2 0 R /LR(Tcroe + TS) + (T C red + T S ) ]
and
                                                  Kred = 720/LR(Tcroe + TS) + (T C red + T S )1
where: KToe and Kred - numbers of roe deer and red deer, respectively, killed by a lynx per month; Tcroe
and Tcred — mean consumption times of, respectively, roe deer and red deer by a lynx (in hours); Ts -
mean time of searching for ungulate prey by a lynx; R - ratio of roe deer to red deer number among
prey found for a given age/sex class of lynx; 720 = number of hours in one month.
        Killing rates of roe and red deer were calculated for three classes of lynx: (1) adult males, (2) adult
females with kittens, and (3) subadults of both sexes and single adult females. For calculation of total
predation by lynx population (in 1991-1996), we used lynx densities and population structure
e s t i m a t e d by year round radiotracking and winter snowtracking. Methods and full d a t a for
1 9 9 1 / 9 2 - 1 9 9 3 / 9 4 a r e p r e s e n t e d b y J ę d r z e j e w s k i et al.   (1996).

                                                P a r a m e t e r s of u n g u l a t e p o p u l a t i o n s
     In late winter (February or March) of 1991, 1992, and 1993, game wardens of Białowieża, Browsk
and Hajnówka Forest Administration units conducted surveys of ungulates (under the supervision of
L. Miłkowski) on 2 6 - 5 0 randomly selected forest compartments (about 1.14 km 2 each). Of nine game
hunting districts located in the exploited forests of BPF, the surveys sampled from 6 (in 1992) to 9
districts (in 1991). In late winter of 1991 and 1992, we conducted censuses of ungulates on 11.2-km 2
area in Białowieża National Park. In all cases, ungulates were surveyed by driving censuses (Hazzard
1958). Each forest compartment or block of adjoining compartments to be surveyed was surrounded
by observers standing at 50-100 m intervals (to keep visual contact). The observers along three sides
of a censused area remained stationary, while those along the fourth side moved inward quietly and
went through the entire area as a battue line. All observers noted the ungulates passing through the
lines of observers (on their right-hand side only) and into the closed area being censused. Moreover,
age and sex of deer (fawn, adult female or adult male) were identified whenever possible. The census
yielded the absolute numbers of ungulates, calculated as the difference between the number of
ungulates seen to leave a census section and those observed to enter it. Totally, the driving censuses
covered from 40.2 km 2 in 1992 to 66.5 km 2 in 1991, ie 7.0-11.5% of the whole Polish part of BPF.
When calculating the mean densities of deer in the whole Forest, we corrected for uncensused parts
of the Forest (3 game hunting districts in 1992, one game district and BNP in 1993), based on relative
abundance of deer in those districts in the years with data available. More detailed description and
presentation of data from 1991 are found in Jędrzejewska et al. (1994).
    Furthermore, information on deer densities in late winter 1995 was provided by Kossak (1995),
who conducted a drive census on a total of 51.5 km 2 in all game districts in the exploited forests of
BPF. However, these results are not fully comparable to earlier data because forest compartments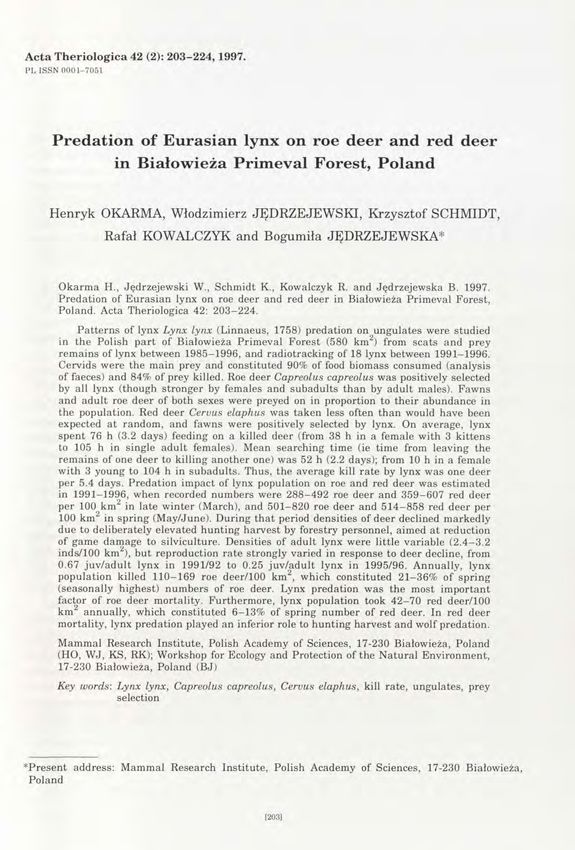
Prédation of lynx on deer                                        207

were not selected randomly but formed a regular net. This resulted in substantial overrepresentation
of deciduous forests in the total sample, and might have overestimated (as compared to earlier years)
the number of ungulates. Estimates by Kossak (1995) were also corrected for the uncensused area of
BNP. Since census in 1995 yielded unreliable measures of age/sex structure of deer, we have used
respective figures from a sample of culled deer reported by Kossak (1995).
    To calculate late spring/early summer numbers of deer, we applied the reproductive parameters
of roe deer after Sablina (1955), who found that in the early summers of 1946-1948, on average 95%
adult females were leading fawns (mean 1.52 juv./mother, thus 1.45 juv./adult female). In red deer,
we used own visual observations collected in BPF between 1987-1995. In a total of 276 adult females
with young (only observations with unambiguously determined sex/age of individuals), the mean
number of fawns per adult female was 0.9 in July and declined steadily to 0.58 in J a n u a r y - F e b r u a r y
and 0.35 in March-April. This conforms to the data obtained by drive censuses; in late winters of
1991-1993, 0.43 to 0.59 juveniles per adult female red deer were recorded. Data on annual hunting
harvest of deer were kindly provided by the Forest Administration offices of Białowieża, Browsk and
Hajnówka, and by the Regional Headquarters of State Forests in Białystok.
    Two sources of information on the spatial variation of roe and red deer numbers in BPF were used.
The first was the results of driving census done in 1991 (see Jędrzejewska et al. 1994 for cartographic
presentation of data). Secondly, we mapped all visual observations of deer (N - 527 individuals)
recorded during the field work between 1991-1995. These observations reliably represented the
relative proportions of roe and red deer numbers; in the areas of game hunting districts and BNP,
the percentages of roe deer among all observed deer correlated with those obtained by driving census
in 1991 (r = 0.96, p < 0.0005, n = 9 districts with available data).

                                                       Results

                           D i e t c o m p o s i t i o n and p r e y s e l e c t i o n by l y n x

      Roe deer and red deer were the staple food of lynx in Białowieża Primeval
Forest; deer constituted 93.8% of biomass consumed in spring-summer and 89.9%
in a u t u m - w i n t e r (Table 1). Sporadically, wild boar fell as prey to lynx. Of
small-sized prey found in lynx scats, only the brown hare had some importance
(6% of biomass consumed in autumn-winter). A similar picture of lynx diet emerged
from the analysis of 172 prey remains found on trails of radiotracked and
snowtracked lynx; in both spring-summer and autumn-winter seasons, 85% of kills
were ungulates, predominantly roe deer (62%) and red deer (22%). Brown hare
made 9% of prey found (Table 2). While roe deer was the most common prey of
all lynx sex/age classes (59-69%; Table 2), the shares of large and small-sized
prey varied. Adult male lynx captured significantly more red deer (G = 19.8, df = 2,
p < 0.001) and fewer small-sized prey (G = 23.7, df = 2, p < 0.001) than adult
female lynx with kittens and subadults (Table 2). Brown hare was hunted more
often by subadults and single adult females (19% of their prey) than by other lynx
(G = 16.1, df = 2, p < 0.001). Finally, family groups (females with kittens) captured
other small-sized prey (birds and mammals) in quantities significantly exceeding
t h a t found on trails of single lynx (G = 17.1, df = 2, p < 0.001). Tracks on snow
indicated that, in two cases at least, the small prey (a marten and a hare) were
captured by the kittens.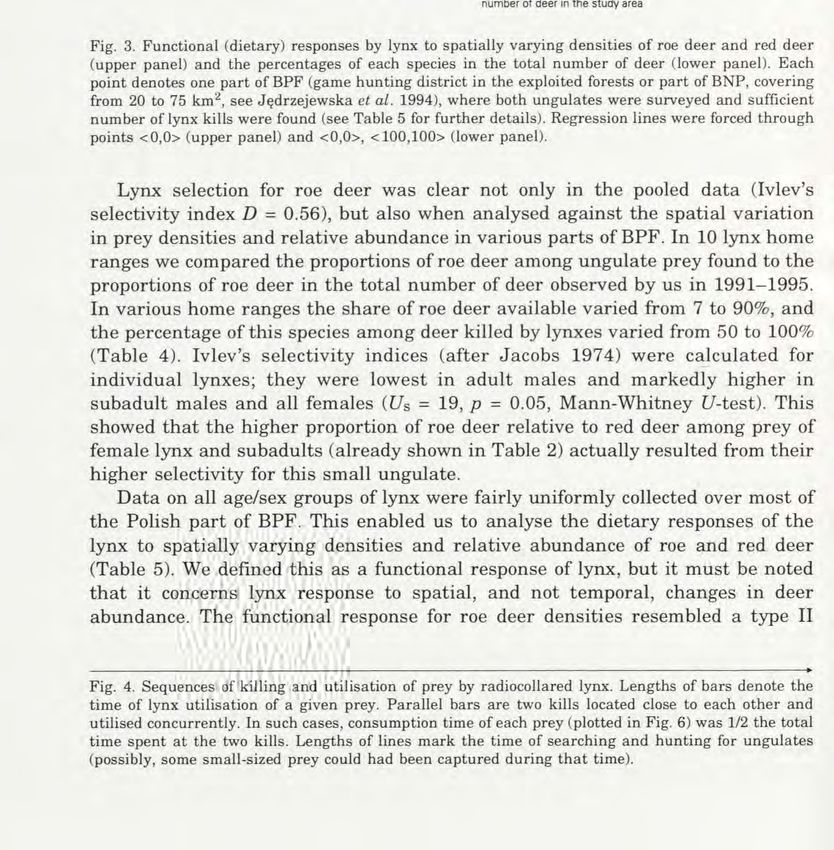
208                                      H. O k a r r a a et al.

Table 1. Diet composition of lynx in the Białowieża Primeval Forest in spring-summer (16 April - 30
September) and autumn-winter (1 October - 15 April) of 1985/86-1995. n - number of scats. % Occ
- percentage occurrence in scats, % Bio - percentage of total biomass consumed by lynx.

                                                Spring- summer               Autumn-winter
Item                                                in == 12)                   (n = 127)

                                            % Occ              % Bio      % Occ         % Bio

Roe deer Capreolus capreolus                   8.3                 16.4     8.7           9.6
Red deer Cervus elaphus                         -                   -       5.5          10.9
Undetermined Cervidae                        75.0                  77.4    74.0          69.4
Cervidae total                               83.3                  93.8    87.4          89.9
Wild boar Sus scrofa                            -                   -       3.9           1.0
Brown hare Lepus europaeus                   16.7                   1.0    11.0           6.0
Pine marten Martes martes                       -                   -       0.8           2.3
Raccoon dog Nyctereutes procyonoides            -                   -       1.6           0.1
Domestic dog Canis familiaris                  8.3                  3.4     0.8            +
Red squirrel Sciurus vulgaris                   -                   -       0.8            +

Voles Microtus spp.                            8.3                  0.1     0.8            +
Bank vole Clethrionomys glareolus               -                   -       0.8            +
Pine vole Pitymys subterraneus                  -                   -       0.8           0.1
Shrews Soricidae                                -                   -       0.8            +

Micromammalia total                            8.3                  0.1     0.8            +

Undetermined thrush Turdus spp.                8.3                  1.3      _             _
Undetermined owl Strigidae                      -                   -       0.8            +
Hazel hen Tetrastes bonasia                     -                   -       1.6           0.1
Domestic hen Gallus domesticus                  -                   -       0.8           0.3
Undetermined bird                               -                   -       0.8            +

Birds total                                    8.3                  1.3     3.9           0.5
Amphibians                                      -                   -       0.8            +
Insects                                         -                   -       0.8            +
Plant material                               16.7                   0.4    12.6           0.1
Biomass consumed per 1 scat (g)                                    1591                   529

    Lynx preyed on adult and fawn roe deer roughly in proportion to their
abundance in the living population (G = 1.124, df = 2, p > 0.5; Table 3). Among
75 roe deer killed by lynx, fawns comprised 33%, and older classes were
represented by still decreasing proportions (Fig. 1). The oldest roe deer killed by
lynx was > 9 years old. No such detailed data on the age structure of the local
living population of roe deer is available. It seems, nonetheless, t h a t lynx does not
select for any age class of roe deer. By contrast, when hunting for red deer, the
lynx were highly selective (G = 48.5, df = 2, p < 0.001); they killed predominantly
fawns and no adult males (Table 3). From the femur marrow fat content in 70 roe
Prédation of lynx on deer                                                     209

Table 2. Species composition of lynx kills in numbers (and percentages) found during radiotracking
and snowtracking between 1987-1996 in Białowieża Primeval Forest. Sp-Su - spring-summer, Au-Wi
- autumn-winter, M - male, F - female, ad - adult. Mean body masses of lynx were: adult male
21.2 kg, a d u l t female 15.7 kg, s u b a d u l t 15 kg, k i t t e n 9 kg (data for a u t u m n - w i n t e r season,
Jędrzejewski et al. 1996). aAsio otus, hDendrocopos major.

                                     Prey of lynx of a given sex/age class                       Total prey found

Prey species                      Ad M       Ad F with Subadults Unknown                  Sp-Su Au-Wi             Sum
                                              kittens  and single single                                          n (%)
                                                          ad F     lynx

Wild boar                     2 (3%)               _              _              _          _         2           2    (1%)
Red deer                     22 (36%)         10 (18%)       4    (8%)           2          6        32          38   (22%)
Roe deer                     36 (59%)         34 (61%)      34   (69%)           2         34        72         106   (62%)
Brown hare                    1 (2%)           5 (9%)        9   (19%)           -          5        10          15    (9%)
Domestic dog                     -                 -         1     (2%)          -          -         1           1     (0.5%)
Pine marten                      -             2 (3%)             -              -           1        1           2    (1%)
Red squirrel                     -                 -              -              1          -         1           1     (0.5%)
Hazel hen                        -             1   (2%)      1 (2%)              1           1        2           3    (2%)
Long-eared owl a                 -             1   (2%)           -              -          -         1           1     (0.5%)
Thrush                           -             2   (3%)           -              -          -         2           2    (1%)
Great spotted woodpecker 1 '     -             1   (2%)           -              -          -         1           1     (0.5%)
Total n (%)                      61 (100%) 56 (100%) 49 (100%)                   6         47        125        172 (100%)

Table 3. Selection of sex/age classes of roe deer and red deer killed by lynx in 1987/88-1996.
Percentages of age/sex classes of deer killed by lynx compared to their mean percentages in the living
populations in late winter (March). *** p < 0.001 (G-test for homogeneity of percentages; composition
of lynx prey compared with living population of deer).

                                                                             Age/sex class of deer

Sample                                                 Adult males              Adult females               Juveniles

                                                        n             %              n     %                n           %

                                                       Roe deer
Lynx prey in spring-summer                              8             29             11   39                9           32
Lynx prey in autumn-winter                             13             20             27   42               24           38
Total lynx prey                                        21             23             38   41               33           36
Living population of roe deer (March)                                 25                  46                            29

                                                       Red deer
Lynx prey in spring-summer                             -                              1                     5
Lynx prey in autumn-winter                             -              0              13   43               17           57
Total lynx prey                                        -
                                                                      o***           14   39               22           gl***
Living population of red deer (March)                                 27                  46                            27
210                                                H. O k a r r a a et al.

                               Age                 99                                  Ob*
                             (years)
                                > 9
                                                                   n
                              7-8
                              5-6
                              3-4
                              1 -2
                                                       Fawns, sex undetermined

                        T3
                                0
                                 m20     40   60   80 100            0   20 40    60   80 100
                                                   Percentage marrow fat

                                                        Red deer
                                    Spring-summer                        Autumn-winter

                                              h=3                                       ff = 21
                                              x = 61.4                                  x = 33.9
                                              SD = 11.1                                 SD = 26.6

                                0     20 40   60   80 100            0   20 4 0   60   8 0 100
                                                   Percentage marrow fat

Fig. 2. Frequency distributions and the mean content of fat in the femur marrow of roe deer and red
deer killed by lynx in BPF in 1991-1996.

deer and 24 red deer killed by lynx, the physical condition of roe deer was normal
and on average higher t h a n that of red deer. Red deer calves had extremely low
fat content in autumn-winter (Fig. 2).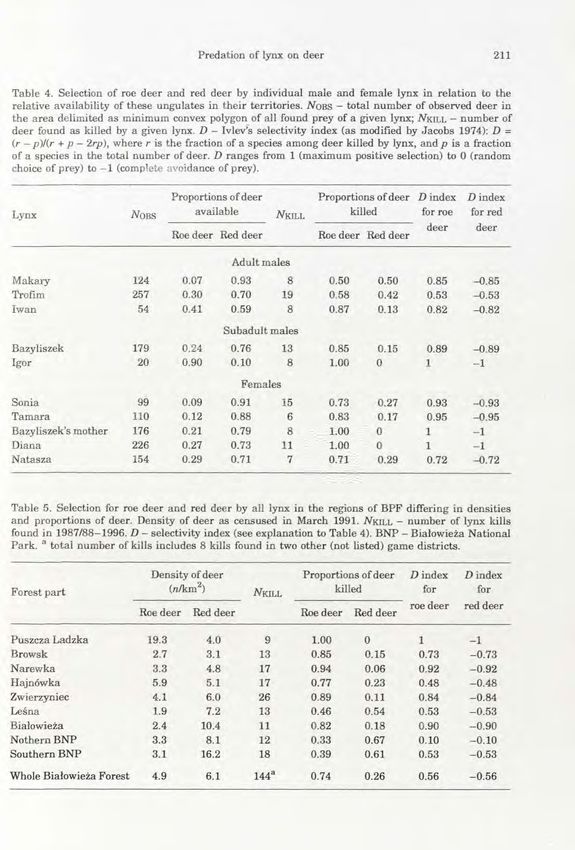
Prédation of lynx on deer                                                      211

Table 4. Selection of roe deer and red deer by individual male and female lynx in relation to the
relative availability of these ungulates in their territories. iVoBS - total number of observed deer in
the area delimited as minimum convex polygon of all found prey of a given lynx; AfclLL - number of
deer found as killed by a given lynx. D - Ivlev's selectivity index (as modified by Jacobs 1974): D =
(r - />)/(r + p — 2rp), where r is the fraction of a species among deer killed by lynx, and p is a fraction
of a species in the total number of deer. D ranges from 1 (maximum positive selection) to 0 (random
choice of prey) to - 1 (complete avoidance of prey).

                                      Proportions of deer                         Proportions of deer D i n d e x   Dindex
Lynx                      NOBS            available                  N k i l l          killed        for roe       for red
                                                                                                        deer         deer
                                      Roe deer Red deer                           Roe deer Red deer

                                                      Adult males
Makary                    124           0.07          0.93             8            0.50       0.50       0.85       -0.85
Trofim                    257           0.30          0.70            19            0.58       0.42       0.53       -0.53
Iwan                       54           0.41          0.59             8            0.87       0.13       0.82       -0.82
                                                     Subadult males
Bazyliszek                179           0.24          0.76            13            0.85       0.15       0.89       -0.89
Igor                       20           0.90          0.10             8            1.00       0          1          -1

                                                        Females
Sonia                      99           0.09          0.91            15            0.73       0.27       0.93       -0.93
Tamara                    110           0.12          0.88             6            0.83       0.17       0.95       -0.95
Bazyliszek's mother       176           0.21          0.79             8            1.00       0          1          -1
Diana                     226           0.27          0.73            11            1.00       0          1          -1
Natasza                   154           0.29          0.71             7            0.71       0.29       0.72       -0.72

Table 5. Selection for roe deer and red deer           by all lynx in the regions of BPF differing in densities
and proportions of deer. Density of deer as           censused in March 1991. A f a l L L - number of lynx kills
found in 1987/88-1996. D - selectivity index          (see explanation to Table 4). BNP - Białowieża National
Park. a total number of kills includes 8 kills        found in two other (not listed) game districts.

                                Density of deer                              Proportions of deer      Dindex        Dindex
Forest part                        (n/km 2 )                 NKILL                 killed               for           for
                                                                                                      roe deer      red deer
                           Roe deer       Red deer                           Roe deer      Red deer

Puszcza Ladzka              19.3             4.0               9                 1.00       0           1            -1
Browsk                       2.7             3.1              13                 0.85       0.15        0.73         -0.73
Narewka                      3.3             4.8              17                 0.94       0.06        0.92         -0.92
Hajnówka                     5.9             5.1              17                 0.77       0.23        0.48         -0.48
Zwierzyniec                  4.1             6.0              26                 0.89       0.11        0.84         -0.84
Leśna                        1.9             7.2              13                 0.46       0.54        0.53         -0.53
Białowieża                   2.4            10.4              11                 0.82       0.18        0.90         -0.90
Nothern BNP                  3.3             8.1              12                 0.33       0.67        0.10         -0.10
Southern BNP                 3.1            16.2              18                 0.39       0.61        0.53         -0.53

Whole Białowieża Forest         4.9            6.1           144 a               0.74        0.26       0.56         -0.56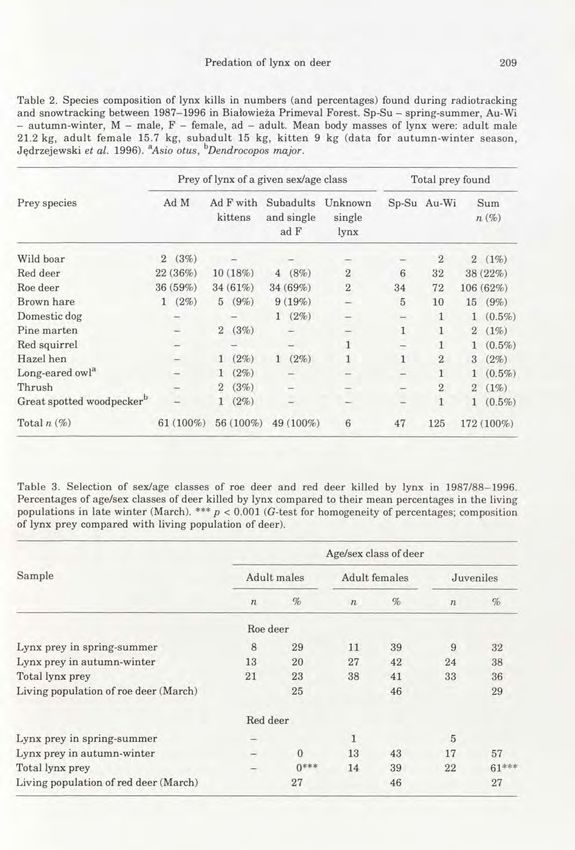
212                                        H. Okarraa et al.

Fig. 3. Functional (dietary) responses by lynx to spatially varying densities of roe deer and red deer
(upper panel) and the percentages of each species in the total number of deer (lower panel). Each
point denotes one part of BPF (game hunting district in the exploited forests or part of BNP, covering
from 20 to 75 km 2 , see Jędrzejewska et al. 1994), where both ungulates were surveyed and sufficient
number of lynx kills were found (see Table 5 for further details). Regression lines were forced through
points  (upper panel) and ,  (lower panel).

     Lynx selection for roe deer was clear not only in the pooled data (Ivlev's
selectivity index D = 0.56), but also when analysed against the spatial variation
in prey densities and relative abundance in various parts of BPF. In 10 lynx home
ranges we compared the proportions of roe deer among ungulate prey found to the
proportions of roe deer in the total number of deer observed by us in 1991-1995.
In various home ranges the share of roe deer available varied from 7 to 90%, and
the percentage of this species among deer killed by lynxes varied from 50 to 100%
(Table 4). Ivlev's selectivity indices (after Jacobs 1974) were calculated for
individual lynxes; they were lowest in adult males and markedly higher in
subadult males and all females (Us = 19, p = 0.05, Mann-Whitney U-test). This
showed t h a t the higher proportion of roe deer relative to red deer among prey of
female lynx and subadults (already shown in Table 2) actually resulted from their
higher selectivity for this small ungulate.
     Data on all age/sex groups of lynx were fairly uniformly collected over most of
the Polish part of BPF. This enabled us to analyse the dietary responses of the
lynx to spatially varying densities and relative abundance of roe and red deer
(Table 5). We defined this as a functional response of lynx, but it must be noted
t h a t it concerns lynx response to spatial, and not temporal, changes in deer
abundance. The functional response for roe deer densities resembled a type II

Fig. 4. Sequences of killing and utilisation of prey by radiocollared lynx. Lengths of bars denote the
time of lynx utilisation of a given prey. Parallel bars are two kills located close to each other and
utilised concurrently. In such cases, consumption time of each prey (plotted in Fig. 6) was 1/2 the total
time spent at the two kills. Lengths of lines mark the time of searching and hunting for ungulates
(possibly, some small-sized prey could had been captured during t h a t time).
213
Adult females with young
Natasza Cc 9 »Ao «Tu
+ 1 juv 16 A p r ' 9 3
0 1 2 3 4 5
Mother
of Bazyliszek
+ 2 juv
0 1 2 3 4 5
Days
Diana
+ 2 juv 15 F e b - 9 5
0 1 2 3 4 5 6 7
Sonia
+ 3 juv 8 Aug-94
0 1 2 3 4 5 6 7 9 10 11 12 13
Days
Adult males
Makary
5 Mar '93
0 1 2 3 4 5 6 7 8
Iwan 2Cc juv
. Çç.iw ,,
20 Feb ' 9 5 i i • --pa; , 27 Aug 9b ;; ' i . ,
0 1 2 3 4 5 6 7 8 9 10 0 1 2 3 4 5 6 7
Trofim „ „ „ „ Cc9
Ccrf Cc9 Ce i u v I-M-I->I-M " |JJ-:N
0 1 2 3 4 5 6 7 8 9 10 11 12 13 14 15 16 17 18 19 20 21 22
Cc juv Cc9 Cc9 C e juv
Subadult males and females
Bazyliszek cS Cc 9
Cerf
0 1 2 3 4 5 6 7 8 9 10 11 12 13 14
26 Mar '92 Days
Cc 9 Cc9
0 1 2 3 4 5 6 7 8 9 10 11
19 M a y '92
Ccrf Ce juv Ce uv ^ Cc,iw
7 J u n '92
0 1 2 3 4 5 6 7 8 9 10 0 1 2 3 4 5 6 7 8
Days
Cc 9 Cc 9 Le Cc juv
19 N o v '92
0 1 2 3 4 5 6 7 8 9 10 0 1 2 3 4 5
Igor cf
Ungulate prey fed upon: Ccrf Ccrf Cc juv Cc juv
12 S e p '94
C..J Cc - Capreolus capreolus 0 1 2 3 4 5 6 7 8 9 10 11 12 13 14 15 16 17 18 19
Wiit, Ce - Can/us elaphus
Tamara9 Cc9 • Le Le
Ccrf Cf. Le
I I kill temporarily abandoned
1 0 A p r '94 =1r T == p =
9
0 1 2 3 4 5 6 10 11 12 13 14 15 16 17 18 19 2 0
Small prey: 7 8 Days
— consumption time estimated Ccrf
2 Le
• consumption time unknown 20 21 22 23 24 25 26 27 28 29 30 31 32 33 3 4 35
Le - Lepus europaeus
Cc 9 Ce 9
Tb - Tetrastes bonasia
35 36 37 38 39 40 41 42 43 44 45 46 47 48 49 50 51 52 53
Cf - Canis familiaris
Ao - Asio otus Diana 9 Ccrf Ccrf
Tu • Turdus sp. 26 M a y ' 9 5
0 1 2 3 4 5 6 7 8 9 10 11 12 13 14 15
— searching time Days214 H. O k a r r a a et al.
(asymptotic curve), indicating a fast increase in roe deer percentage taken by lynx
with increasing roe deer densities (Fig. 3). In contrast, the share of red deer among
lynx prey grew in a nearly linear manner with increasing densities of deer (type
I functional response). Mathematically, exponential equations (with exponents < 1)
described the lines of best fit to empirical points (Fig. 3). The relative proportions
of both ungulate species were more important than their absolute numbers for
the selection of particular species by lynx. In these data, it appeared t h a t the
share of roe deer among lynx ungulate prey grew very fast with increasing
proportion of this species among all deer. In contrast, the share of red deer in lynx
prey killed increased only when this species heavily outnumbered the roe deer
(Table 5, Fig. 3).
K i l l i n g r a t e s and p r e y u t i l i s a t i o n by l y n x
The temporal pattern of killing and utilisation of prey by lynx is shown in
Fig. 4. Generally, all lynx exhibited similar foraging behaviour (killing - feeding
on a carcass and staying near it for some days - leaving it to search and h u n t for
another one - killing, and so on), but there were notable differences among sex/age
classes. Family groups (females with kittens) consumed deer within a short time,
and in 3 of 19 cases, they utilised two prey at a time, both killed by a female
within a short time f r a m e and spatial distance (Fig. 4). Moreover, females (and
occasionally kittens, too) killed small animals (hare, hazel hens) while still feeding
on an ungulate carcass. The rates of killing and consumption of prey by females
with kittens clearly reflected the food demands of growing juveniles. Adult male
lynx behaved as if necessity to stay in one place (to feed on a carcass) conflicted
with the need to move around. In 4 out of 18 cases, males utilised two kills at a
time, but in only one case was it actually two prey killed near each other (Fig. 4).
In other cases, adult males typically left a prey before it was consumed, roamed
Fig. 5. Mean (± SE) consumption times by
lynx in relation to the mean body mass of
prey. Data on body masses a f t e r Dziçcio-
lowski (1969), Milkowski (1970), and Cabon-
-Raczynska (1974).Prédation of lynx on deer 215
far away, killed another prey at a distant place, and after feeding on it for a few
days, returned to the previous kill to finish it. Subadults were evidently least
effective in their hunting for ungulates. They stayed longer at each kill and utilised
it as completely as possible. They never managed to have two kills at a time, and
their searching times were long and interspersed with catches of smaller prey,
usually hare but also items as strange as domestic dog.
The time a lynx spent feeding on a kill was estimated reliably for 101 ungulates
and 5 hares; it varied from 8 h to 8 days (192 h), depending on the size of prey,
the size, age and number of lynxes feeding on it, and casual factors (eg disturbance
by scavengers). Generally, consumption time by lynx grew logarithmically with
prey size, from an average of 32 h (1.3 days) for a brown hare to 92 h (3.8 days)
for a female red deer (Fig. 5). Roe deer were eaten within 3 days, and a red deer
took 25% longer. An ungulate prey (roe and red deer pooled) was fed upon for 76
± 38 h (mean ± SD), ie 3.2 days, during which the lynx usually stayed within a
few meters to several hundred meters of the kill and fed at least twice daily.
In the majority of killed roe deer (80%, n = 78), the lynx utilised nearly all
edible tissue (consumption > 75%); 19% carcasses were classified as half-eaten
(25-75% of tissue consumed). Lynx abandoned one kill (1%) after having consumed
only a small portion (< 25%). Roe deer carcass was utilised in 93 ± 17% (mean ± SD)
and all age/sex classes of lynx utilised their kills as completely as possible (on
average 94% by adult males, 96% by adult females with kittens, and 90% by
subadults). The red deer, a notably larger prey, was consumed completely in 36%
200
180 400
160 380 -
I 140 140 -
-C
I 120 " 120 -
J 100- ••dit 100 -
»yoo
•IM
Q. o
E 80 - 80
60 - T° 60
ot*°
40 " 40
20 - 20 H
0 0
Adult Subadult Single Adult females with: Adult Subadult Single Adult females with:
males males & adult 1 kitten 2 kittens 3 kittens males males & adult 1 kitten 2 kittens 3 kittens
females females females
females
Spring-summer: Autumn-winter: mean values A Spring-summer, a Autumn-winter,
• red deer ad • red deer ad
• red deer juv • red deer juv
• roe deer ad o roe deer ad
• roe deer juv o roe deer juv
Fig. 6. Left panel: Consumption times of ungulate prey by lynx of various age, sex and reproductive
status. Each point denotes the time a lynx stayed at and fed upon one prey. Right panel: lynx
searching times for ungulates. Each point denotes the time from leaving the remains of one deer to
killing another deer.216 H. O k a r r a a et al.
of cases, only (n = 22); 59% of kills were half-eaten and 5% abandoned after little
consumption. On average, red deer carcass was consumed in 75 ± 23%. Despite
small samples of red deer killed, clear differences in their use by various age/sex
classes of lynx emerged. Subadults consumed on average 94% of all edible tissue
of red deer, adult females with kittens 79%, and adult male lynx (often wandering
from one kill to another) 67%, only. The causes of uncomplete utilisation could
not always be determined, but carcasses were often scavenged by wild boar
(frequent in winter, see Jędrzejewski et al. 1993) or they decayed in summer.
Consumption times of ungulate prey varied greatly among age and sex classes
of lynx but no consistent seasonal differences (ie spring-summer versus autumn-
-winter) were found (Fig. 6). Among single lynxes, the time spent at a deer carcass
ranged from an average of 75 ± 37 h in adult males to 105 ± 20 h in single adult
females. In family groups (female + kittens), the time spent at a kill declined with
increasing number of young; it was as short as 38 ± 17 h in a female with 3 kittens
(Fig. 6). We calculated the regression equation of mean consumption time of roe
deer in relation to the number of kittens in a litter (LogioTc = 2.063 - 0.1713
o
A/juv, R = 0.93, n = 4,p < 0.05), which we used for further calculations of predation
rates (see below).
In 37 cases, we were able to estimate the time from leaving the remains of one
ungulate prey until the lynx killed another one. We called it 'searching time', but
during t h a t time a lynx could (and in several cases it did) capture and eat
small-sized prey. As defined, searching time ranged from nearly 0 to 383 h (ie 16
days). In most cases, however, lynx spent 0.5-5 days hunting for deer after having
left the remains of the previous kill. On average, all lynx spent 54 ± 70 h, ie 2.25
days on searching for the next ungulate prey. Among single lynx, adult males
spring-summer O autumn-winter
Adult x = 1.8
male lynx O O- -o-o- -o x = 7.5 1
Adult females x = 1.4
w i t h kittens O OO-O -o-o-o y-= 3.8
Subadults 4.9
and single -oo x = 3.8
ad females
0 1 2 3 4 5 6 7 8 9 10 11 12 13 14
Straight-line distance between consecutive kills (km)
Fig. 7. Straight-line distances between consecutive kills (ungulates only) of lynxes of various age, sex
and breeding status. Each point is a distance between two consecutive kills. Differences between
seasons: ** p < 0.01, * p = 0.05 (Mann-Whitney Latest).Prédation of lynx on deer 217
spent markedly shorter time hunting (38 ± 37 h) than subadults of both sexes (104
± 97 h). In family groups, where a female had to provide kittens with large amounts
of food, searching time was shortest and least variable (Fig. 6). A female with 3
kittens spent, on average, 10 ± 8 h from leaving one deer carcass till killing another
one. We calculated the regression of mean searching times against the number of
kittens in a litter (LogioTs = 1.999 - 0.36445 NjUv, R2 = 0.96, n = 4, p < 0.05) and
used it for estimating predation rates (see below).
Of 37 straight-line distances between consecutively killed deer, nearly half
(49%) were within 1 - 3 km, but distances as far as 10-13.5 km were also recorded
(Fig. 7). Consecutively killed deer were found 4.0 ± 3.4 km (mean ± SD) apart. In
this aspect of lynx predation, there were clear seasonal shifts in adult males and
females with kittens (Fig. 7). In adult females, which in spring and summer have
to bring along their small kittens to each new kill, the distances between
consecutive kills were shortest and least variable (1.4 ± 0.6 km). In autumn-winter,
when young are bigger, more mobile, and often assist their mothers in hunting,
the mean distance increased to 3.8 ± 2.9 km. Consecutive prey of adult male lynx
were, on average, 1.8 ± 1.2 km apart in spring-summer, but 7.5 ± 4.7 km apart
in winter, when males spent much time walking in search for females and
m a r k e d l y expanded their home ranges (Schmidt et al., in print). Spatially
concentrated kills of adult lynx in spring-summer were obviously facilitated by
the seasonal abundance and low mobility of juvenile deer, but it may have resulted
from the hunting efficiency of adult lynx as well. In the subadults, especially in
Table 6. Killing rates by lynx of various sex/age classes on roe deer and red deer in BPF in 1991-1996.
Five v a r i a n t s of family size (female with kittens) cover the whole range of observed individual
variation (females with 1, 2, or 3 juveniles) and year-to-year variation in the mean breeding success
of lynx population during the study period (see Table 7). Ratios of roe deer to red deer killed from
Table 2. Searching and consumption times of deer - data points in Fig. 6. In the case of females with
young, the values were read from regression line of mean searching time and consumption time of roe
deer in relation to the number of kittens in a litter (see Fig. 6 for data and text for regression
equations). Due to the small sample of empirical data on consumption time of red deer by female lynx
with young, these values were calculated by multiplying the consumption time of roe deer by 1.256
(ie an average ratio for the whole material). M - male, F - female, ad - adult.
Subadults Adult F with the following number Mean
Parameter Ad M and single of kittens: for all
ad F lynx
1.0 1.4 1.8 2.0 3.0
Roe : red deer ratio 1.64 8.50 3.40 3.40 3.40 3.40 3.40 2.80
Searching time (h) 37.7 105.4 43.1 30.8 22.0 18.6 8.1 54.0
Consumption time of roe deer (h) 66.5 93.3 77.9 66.5 56.8 52.5 35.4 72.2
n roe deer killed/month 3.9 3.2 4.4 5.5 6.8 7.5 12.2 4.0
Consumption time of red deer (h) 91.9 100.0 97.8 83.5 71.3 65.9 44.5 90.7
n red deer killed/month 2.4 0.4 1.3 1.6 2.0 2.2 3.6 1.5
Total n deer killed/month 6.3 3.6 5.7 7.1 8.8 9.7 15.8 5.5
Mean kill rate (n days/deer) 4.7 8.3 5.2 4.2 3.4 3.1 1.9 5.4218 H. O k a r r a a et al.
Table 7. Prédation impact by lynx on populations of roe and red deer in Białowieża Primeval Forest
in 1991-1996. See the text for sources of data on lynx and deer population numbers and structure,
and methods of calculating prédation.
Parameter Mean (SD)
1991/92 1992/93 1993/94 1995/96
Lynx population
Density of adult lynx (n/100 km 2 ) 2.8 3.2 3.2 2.4 2.9 (0.4)
including: ad males 1.26 1.57 1.25 1.01 1.27 (0.2)
reproducing ad females 0.98 1.15 1.09 0.60 0.96 (0.2)
subadults and single ad females 0.56 0.48 0.86 0.79 0.67 (0.2)
Density of kittens (n/100 km 2 ) 2.3 1.7 2.0 0.6 1.65 (0.7)
Mean number of kittens per mother 2.0 1.4 1.8 1.0 1.6 (0.4)
Roe deer Capreolus capreolus
Population dynamics
Density in March (n/100 km 2 ) 492 425 288 324 382 (93)
Percentage of adult females 46 45 51 41 46 (4)
n juv/adult female in spring 1.45 1.45 1.45 1.45 1.45
Juveniles born in spring (n/100 km 2 ) 328 277 213 193 253 (62)
2
Density in May/June (n/100 km ) 820 702 501 517 635(153)
Year-to-year mortality (n/100 km 2 ) 395 414 ? ? ?
Lynx predation
Total yearly predation (n/100 km 2 ) 169 169 181 110 157 (32)
Predation as percentage of:
spring/summer density of roe deer 21 24 36 21 26 (7)
roe deer increase due to breeding 52 61 85 57 64 (15)
annual mortality of roe deer 43 41 ? ? ?
Hunting harvest
Annual hunting harvest (n/100 km 2 ) 85 114 102 86 97 (14)
Hunting harvest as percentage of:
spring/summer density of roe deer 10 16 20 17 16 (4)
roe deer increase due to breeding 26 41 48 45 40 (10)
annual mortality of roe deer 22 28 ? ? ?
Red deer Cervus elaphus
Population dynamics
Density in March (n/100 km 2 ) 607 416 359 463 461(106)
Percentage of adult females 46 44 48 47 46 (2)
n juv/adult female in spring 0.9 0.9 0.9 0.9 0.9
Juveniles born in spring (n/100 km 2 ) 251 165 155 196 192 (43)
Density in May/June (n/100 km 2 ) 858 581 514 659 653(149)
Year-to-year mortality (n/100 km 2 ) 442 222 ? ? ?
Lynx predation
Total yearly predation (n/100 km 2 ) 65 70 66 42 61 (13)
Predation as percentage of:
spring/summer density of red deer 8 12 13 6 10 (3)
red deer increase due to breeding 26 42 43 21 33 (11)
annual mortality of red deer 15 32 ? ? ?
Hunting harvest
Annual hunting harvest (n/100 km 2 ) 133 131 131 140 134 (4)
Hunting harvest as percentage of:
spring/summer density of red deer 16 23 25 21 21 (4)
red deer increase due to breeding 53 79 85 71 72 (14)
annual mortality of red deer 30 59 ? ? ?Prédation of lynx on deer 219
spring-summer (the first season of their independent lives), the straight-line
distances between consecutively killed deer were longer than those in adult males
and females with young (Fig. 7). In the latter case (subadults vs adult females
with kittens), the difference was statistically significant (Us = 26.5, p < 0.05,
Mann-Whitney U-test).
Based on the mean proportions of roe deer and red deer among prey killed,
the mean consumption and searching times, we calculated the killing rates by
three groups of lynx: (1) adult males, (2) subadults and single adult females, and
(3) females with kittens. In this last case, five variants of litter size were used to
cover both individual variation in family size and between-year variation in the
mean values for the lynx population (Table 6). A subadult lynx or a non-breeding
adult female killed, on average, 3.6 deer/month (43 deer/year), most of them being
roe deer (Table 6). An adult male lynx harvested 6.3 deer/month (76 deer annually).
Killing r a t e s of females leading k i t t e n s increased exponentially from 5.7
deer/month (69 per year) in a female with one young to 15.8 deer/month (190 per
year) in a female with 3 young. The average kill rate by lynx was 1 deer/5.4 days
(Table 6).
We calculated mean daily food intake by adult males, family groups, and
subadult lynx, based on proportions of red deer, roe deer and brown hare among
their kills, mean percentage of ungulate prey utilisation, and the assumption t h a t
consumable fraction of an ungulate constitutes 75% of its body mass (after Messier
and Crete 1985). On average, one lynx consumed about 2 kg crude biomass of food
daily (adult male 3.6 kg, subadult 1.7 kg, family groups, ie females with 1 - 3
kittens, 1.6-2.2 kg per capita).
P r e d a t i o n i m p a c t by l y n x p o p u l a t i o n o n roe d e e r and r e d d e e r
We calculated the total impact of lynx predation on deer based on: (1) densities
of lynx, (2) lynx killing rates, and (3) densities of roe and red deer. In 1991-1996,
the winter density of adult lynx was little variable (2.4-3.2 inds/100 km 2 , CV =
13%), but the reproduction rates of lynx population varied from 0.25 juv/adult in
1995/96 to 0.67 juv/adult in 1991/92, and the mean litter size from 1 to 2,
respectively (Table 7). In consequence, from 0.6 to 2.3 kittens/100 km 2 were
recorded in addition to adult and subadult lynx (CV = 45%). Total numbers of lynx
were fairly stable in 1991-1994, and by 40% lower in 1995/96.
Annually,
o
population of lynx took from 110 to 181 roe deer from an average
100 km , t h a t is 21-36% (mean 26%) of the spring (seasonally highest) numbers
of roe deer (Table 7). Predation was very high (52-85%, mean 64%), as compared
to the roe deer annual increase due to reproduction. Lynx predation was the single
most important factor of roe deer mortality, far exceeding the roles of hunting
harvest (27%) and other factors such as wolf predation, poaching, disease, and
other (Fig. 8). Lynx population killed 42-70 red deer from 100 km per year, which
constituted 6-13% (mean 10%) of spring numbers of deer and 21-43% (mean 33%)220 H. O k a r r a a et al.
Roe deer Red deer
900 900
800 800
700 700
600 600
500 500
400 400
300 300
200 200
100 100
0 0
1991 '92 '93 '94 '95 '96 1991 '92 '93 '94 '95 '96
Year
Density of deer in: Annual mortality of deer due to:
° late winter (March) • prédation by lynx
• spring (May/June) EJ hunting harvest
Fig. 8. Total annual predation by lynx population and annual hunting harvest compared to the mean
densities of roe deer in BPF in 1991-1995/96. Late winter (March) densities of deer were surveyed by
drive censuses; spring (May/June) densities were calculated based on proportions of adult females in
the populations in late winter and average number of juveniles per adult female in spring (see Table
7 for f u r t h e r explanations). A vertical line separates results of ungulate censuses obtained by
somewhat different methods (see Material and methods for details).
of their annual increase due to reproduction (Table 7). Predation by lynx was less
important factor of red deer mortality than hunting harvest (the latter about 45%)
(Fig. 8). In terms of crude biomass, lynx population harvested 24% of roe deer
population and 6% of red deer population (both compared to spring-summer
standing crop of biomass).
Adult female lynx with kittens were responsible for an average of 44% (range
29-52%) of the total lynx predation on roe deer. Adult male lynx contributed 39%
(from 33 to 44%) and subadults, on average, 17% (range 11-31%). For red deer,
adult male lynx accounted for 55 to 69% (mean 61%) of all red deer killed. Adult
females with kittens contributed, on average, 34% (range 22-40%) and subadults
5% (range 3-9%).
During the study period, roe and red deer populations declined markedly,
mainly due to deliberate reduction of 'excess' game by forestry personnel. The
decline exceeded recruitment by about 60 red deer and 45 roe deer per 100 km"
annually (Fig. 8). These numbers roughly approximated the increase in hunting
harvest in 1991-1995 as compared to 1985-1990, when from 40 to 81 (mean 62)
o
red deer and from 26 to 52 (mean 41) roe deer per 100 km had been harvested
annually (compare Okarma et al. 1995).Prédation of lynx on deer 221
Discussion
In the review of lynx feeding habits and prey selection in the Palearctic region
(Jędrzejewski et al. 1993), we have shown t h a t south of 55°N the lynx feeds
primarily on ungulates and strongly selects the smallest species available: the roe
deer, the chamois Rupicapra rupicapra and the musk deer Moschus moschiferus.
But the body masses of these smallest Palearctic ungulates far exceed the daily
food requirements of wild lynx, which is about 2 kg of meat (Haglund 1966, this
paper). Therefore, lynx feeding strategy is to kill a prey and secure it (by hiding
against scavengers and other disturbance) for utilisation during few to several
days. Nonetheless, portions of killed prey are always wasted, and the actual lynx
predation is definitely higher than expected from its daily food requirements. The
direct recording of lynx hunting and feeding done by us in Białowieża Primeval
Forest has shown that the true kill rate was about two times higher (67 deer/year
by one lynx) t h a n expected from daily food consumption of lynx (30-40 deer/year).
In BPF, a lynx killed a deer every 5.4 days, on average. Similar results (5 days)
were obtained by Breitenmoser and Haller (1993), who radiotracked lynx in
1983-1988 in the population reintroduced to the Swiss Alps. There, the main prey
of lynx was roe deer and chamois. Markedly higher kill rates (one ungulate every
2.7 days) was found in a female with 2 kittens (Breitenmoser and Haller 1987),
which is very close to the respective data from our study (3.1 days in a female
with 2 kittens).
In our study it was possible to show the pattern of lynx predation on ungulates
and the mechanisms of its variation. Basic components were: (1) densities of lynx
population and its reproduction rate, (2) strong positive selection of roe deer, and
(3) kill rates depending on sex, age, and breeding status of the lynx. The magnitude
of lynx predation on deer is shaped primarily by the density of lynx and its
reproduction rate. The density of adult lynx recorded by us (2.4-3.2 inds/100 km 2 )
was about 3 times higher than that reported by Breitenmoser et al. (1993) in a
stabilised reintroduced population in the Swiss J u r a Mountains. Still, however, it
was only about half of the highest recorded lynx densities in Białowieża Forest
(over 6 inds/100 km in the 1950s, Jędrzejewski et al. 1996).
In the lynx population, reproduction may vary from, theoretically, complete
breeding failure to 3 juveniles in each litter. Such a range of variation at the
o
densities of 2.9 adult lynx/100 km (ie the mean observed in our study)o would
result in the following magnitudes of annual predation: 167 deer/100 km when
there are no juveniles, 191 deer when each adult female leads one kitten, 237 deer
at 2 juv/adult female, and 307 deer at 3 kittens/adult female. In 1991-1995, the
actual range of variation was from 1 to 2 juv/mother. The increase of predation
rates with growing litter size demonstrates the high demands that the breeding
females have to cope with. Their hunting rates grow exponentially as litter size
increases (Table 6). Futhermore, during the first months of rearing young, the
distances between consecutive kills must be short enough for young to follow the222 H. O k a r r a a et al.
mother. It all shows cogently t h a t reproductive success of lynx is critically
dependent upon high and localised deer densities.
Our study began in 1991, in the same year when forestry personnel started
intense reduction of red and roe deer. Thus, it must be kept in mind t h a t we
followed the changes in predation on populations of prey t h a t declined due to an
additive effect of human exploitation. Annual hunting harvest was lower t h a n lynx
predation but it had a very strong effect on deer population. Hunting season for
roe deer lasts from May through February (in May-September only bucks are
harvested, and in October-February, females and fawns are shot). Red deer are
hunted from August through February. Therefore, most of harvested deer are shot
in autumn and winter. In the cold season, lynx cannot lower their predation, which
is already 'programmed' by the existing density of lynx and the number of their
half-grown young. During our study, lynx population adjusted to lower densities
of deer with notable delay. Although proper analysis of lynx numerical response
would be possible in longer series of data, it is clear already from our 4-year study,
t h a t after a fast, nearly 2-fold decline of roe deer population from 1991 to 1993,
it was only in 1995 (and possibly also in 1994 for which data were not available),
t h a t the numbers of adult and juvenile lynx decreased. In effect, the percentage
predation was highest at the declining population of roe deer. Also, the functional
response of lynx to variation in roe deer density as well as in its percentage share
in potential prey was close to the asymptotic curve (type II according to Rolling
1959). This suggests fairly stable predation impact by lynx at a wide range of
densities (except very low ones) of roe deer and inversely density-dependent
percentage predation.
The red deer was the most important alternative prey to lynx, but due to its
large size it was available mainly to adult male lynx. In subadult lynx, the brown
hare was a buffer prey, probably crucial for their survival during the first year of
independence. Functional response of lynx to variation in red deer density was
linear (type I according to Holling 1959), which suggests constant percentage
predation over the entire range of red deer densities. However, the most important
influence on the magnitude of lynx predation on red deer was the density of adult
male lynx, and this was the least variable component (CV 18%) of lynx population
from year to year. This means, t h a t the ratio of n lynx/100 red deer was growing
with the declining numbers of deer. In consequence, lynx percentage predation on
red deer was also inversely density-dependent, but it grew with declining density
of deer at much slower rate than in the case of lynx predation on roe deer.
The analysis of mechanisms and patterns of lynx predation on roe and red deer
allows us to conclude t h a t lynx may lower the numbers of deer but they do not
regulate deer population trends (sensu Sinclair 1989). Finally, although this study
is the first direct investigation of lynx predation in relation to known numbers of
ungulates, our estimates of predation correspond well to the earlier indirect
evidence obtained by our review of over dozen studies done in n a t u r e reserves and
national parks of central and eastern Europe and the former Soviet UnionPrédation of lynx on deer 223
(Jędrzejewski et al. 1993). These studies, based on long-term recording of ungulate
carcasses with known causes of death, show that the lynx contributed, on average,
40% to the total natural (ie not caused by humans) mortality of roe deer and about
10% in red deer. Thus, in the temperate forests of Europe, lynx predation is an
important limiting factor of roe deer numbers.
Acknowledgements: We are grateful to S. Śnieżko, K. Zub, E. Bujko, students of Farnborough College
of Technology (England), and numerous other person for their help in radiotracking of lynx and search
for the remains of their kills, and to the Regional Headquarters of State Forests in Białystok, and the
Forest Administration offices of Białowieża, Browsk and Hajnówka for information on deer hunting
quotas. We thank K. Zub for drawing the figures and L. Szymura for her help with computer data
files. This study was financed by the grant KBN 6P20503405.
References
B r e i t e n m o s e r U. a n d Haller H. 1987. Zur Nahrungsokologie des Luchses Lynx lynx in d e n
schweizerischen Nordalpen. Zeitschrift fiir Saugetierkunde 52: 168-191.
Breitenmoser U. and Haller H. 1993. Patterns of predation by reintroduced European lynx in the
Swiss Alps. Journal of Wildlife Management 57: 135-144.
Breitenmoser U., Kaczensky P., Dotterer M., Breintenmoser-Wursten C., Capt S., Bernhart F. and
Liberek M. 1993. Spatial organization and recruitment of lynx (Lynx lynx) in a re-introduced
population in the Swiss J u r a Mountains. Journal of Zoology, London 231: 449-464.
Caboń-Raczyńska K. 1974. Variability of the body weight of European hares. Acta Theriologica 19:
69-80.
Dzięciołowski R. 1969. [Weight of our lowland red deer]. Łowiec Polski 19: 4. [In Polish]
Faliński J . B. 1986. Vegetation dynamics in t e m p e r a t e lowland primeval forest. Dr W. J u n k
Publishers, Dordrecht: 1-537.
Gaross V. Ya. 1979. [Impact of lynx and wolves on the Latvian population of roe deer], [In: Ecological
fundamentals of protection and rational utilisation of predatory mammals. V. E. Sokolov, edj.
Izdatelstvo Nauka, Moskva: 257-261. [In Russian]
Haglund B. 1966. Winter habits of the lynx (Lynx lynx L.) and wolverine (Gulo gulo L.) as revealed by
tracking in the snow. Viltrevy 4: 81-310.
Hazzard L. K. 1958. A review of literature on big game census methods. Colorado Game and Fish
Department: 1 - 7 6 .
Holling C. S. 1959. The components of predation as revealed by a study of small-mammal predation of
the European pine sawfly. The Canadian Entomologist 91: 293-320.
Jacobs J. 1974. Quantitative measurements of food selection; a modification of the forage ratio and
Ivlev's Electivity index. Oecologia (Berlin) 14: 413-417.
Jędrzejewska B., Okarma H., Jędrzejewski W. and Miłkowski L. 1994. Effects of exploitation and
protection on forest structure, ungulate density and wolf predation in Białowieża Primeval Forest,
Poland. Journal of Applied Ecology 31: 664-676.
Jędrzejewska B., Jędrzejewski W., Bunevich A. N., Miłkowski L. and Okarma H. 1996. Population
dynamics of wolves Canis lupus in Białowieża Primeval Forest (Poland and Belarus) in relation to
hunting by humans, 1847-1993. Mammal Review 26: 103-126.
Jędrzejewski W., Schmidt K., Miłkowski L., Jędrzejewska B. and Okarma H. 1993. Foraging by lynx
and its role in ungulate mortality: the local (Białowieża Forest) and the Palaearctic viewpoints.
Acta Theriologica 38: 385-403.
Jędrzejewski W., Jędrzejewska B., Okarma H., Schmidt K., Bunevich A. N. and Miłkowski L. 1996.
Population dynamics (1869-1994), demography, and home ranges of the lynx in Białowieża
Primeval Forest (Poland and Belarus). Ecography 19: 122-138.224 H. O k a r r a a et al.
Kossak S. 1995. Game animal n u m b e r s in the Białowieża Forest and proposed ways of game
management. Sylwan 139(8): 25-41. [In Polish with English summary]
Lochman J. 1987. [Red deer], Statni zemedelske nakladatelstvi, Praha: 1-352. [In Czech]
Messier F. 1994. Ungulate population models with predation: a case study with the North American
moose. Ecology 75: 478-488.
Messier F. 1995. Trophic interactions in two northern wolf-ungulate systems. Wildlife Research 22:
131-146.
Messier F. and Crete M. 1985. Moose-wolf dynamics and the natural regulation of moose populations.
Oecologia (Berlin) 65: 503-512.
Miłkowski L. 1970. [Hunting in Białowieża Primeval Forest. Guide for hunters]. Wydawnictwo
Wojewódzki Ośrodek Infomacji Turystycznej, Białystok: 1-71. [In Polish]
Neiland K. A. 1970. Weight of dried marrow as indicator of fat in caribou femurs. Journal of Wildlife
Management 34: 904-907.
Okarma H. 1989. Mandible versus long bone marrow fat in red deer. Acta Theriologica 34: 537-544.
Okarma H. 1995. The trophic ecology of wolves and their predatory role in ungulate communities of
forest ecosystems in Europe. Acta Theriologica 40: 335-386.
Okarma H., Jędrzejewska B., Jędrzejewski W., Krasiński Z. A. and Miłkowski L. 1995. The roles of
predation, snow cover, acorn crop, and man-related factors on ungulate mortality in Białowieża
Primeval Forest, Poland. Acta Theriologica 40: 197-217.
Pielowski Z. 1988. [The roe deer]. Państwowe Wydawnictwo Rolnicze i Leśne, Warszawa: 1-293. [In
Polish]
Rakov N. V. 1979. [On the role of predators in suppressing the numbers of ungulates in the Amur and
Maritime territories], [In: Ecological fundamentals of protection and rational utilisation of
predatory mammals, V. E. Sokolov, ed]. Izdatelstvo Nauka, Moskva: 58-59. [In Russian]
Ratcliffe P. R. 1980. Bone marrow fat as an indicator of condition in roe deer. Acta Theriologica 25:
333-340.
Sablina T. B. 1955. [Ungulates of Belovezha Primeval Forest], Trudy Instituta Morfologii Zhivothykh
im. A. N. Severtsova, Akademiya Nauk SSSR 15: 1-191. [In Russian]
Schmidt K , Jędrzejewski W. and Okarma H. (in print) Spatial organization and social relations in the
Eurasian lynx population in Białowieża Primeval Forest, Poland. Acta Theriologica.
Seip D. R. 1992. Factors limiting woodland caribou populations and their interrelationships with
wolves and moose in southeastern British Columbia. Canadian Journal of Zoology 70: 1494-1503.
Sinclair A. R. E. 1989. Population regulation in animals. [In: Ecological concepts: the contribution of
ecology to an understanding of the natural world. J. M. Cherrett, ed], Blackwell Scientific
Publications, Oxford: 197-241.
Van Ballenberghe V. and Ballard W. B. 1994. Limitation and regulation of moose populations: the role
of predation. Canadian Journal of Zoology 72: 2071-2077.
Zheltukhin A. S. 1986. Biocenotic relationships of the European lynx (Lynx lynx) in the southern taiga
of the Upper Volga. Zoologicheskii Zhurnal 65: 259-271. [In Russian with English summary]
Received 28 August 1996, accepted 1 March 1997.You can also read