Prediction of breeding regions for the desert locust Schistocerca gregaria in east Africa - Nature
←
→
Page content transcription
If your browser does not render page correctly, please read the page content below
www.nature.com/scientificreports
OPEN Prediction of breeding regions
for the desert locust Schistocerca
gregaria in East Africa
Emily Kimathi1, Henri E. Z. Tonnang1*, Sevgan Subramanian1, Keith Cressman4,
Elfatih M. Abdel‑Rahman1, Mehari Tesfayohannes2, Saliou Niassy1, Baldwyn Torto1,
Thomas Dubois1, Chrysantus M. Tanga1, Menale Kassie1, Sunday Ekesi1, David Mwangi3 &
Segenet Kelemu1
Desert locust outbreak in East Africa is threatening livelihoods, food security, environment, and
economic development in the region. The current magnitude of the desert locust invasion in East
Africa is unprecedented and has not been witnessed for more than 70 years. Identifying the potential
breeding sites of the pest is essential to carry out cost-effective and timely preventive measures
before it inflicts significant damage. We accessed 9,134 desert locust occurrence records and applied
a machine-learning algorithm to predict potential desert locust breeding sites in East Africa using
key bio-climatic (temperature and rainfall) and edaphic (sand and moisture contents) factors. Ten
days greenness maps from February 2020 to April 2020 were overlaid in model outputs to illustrate
the temporal evolution of breeding site locations. This study demonstrated that vast areas of Kenya
and Sudan, north eastern regions of Uganda, and south eastern and northern regions of South Sudan
are at high risk of providing a conducive breeding environment for the desert locust. Our prediction
results suggest that there is need to target these high-risk areas and strengthen ground surveillance to
manage the pest in a timely, cost-effective, and environmentally friendly manner.
The desert locust Schistocerca gregaria, one of about a dozen species of locusts, is a species of swarming short-
horned grasshoppers that can migrate great distances during its gregarious p hase1–3. As they swarm, they vora-
ciously feed on key staple crops such as maize and sorghum, pastures, and any green vegetation that comes
their way, thereby significantly affecting the livelihoods of smallholder farmers and p astoralists4–6. In Africa,
the countries of the Sahel region, especially Algeria, Burkina Faso, Chad, Ethiopia, Eritrea, Mauritania, Mali,
Niger, Nigeria, Senegal, Somalia, and Sudan, are particularly susceptible to desert locust outbreaks. Until the
1960s, locust outbreaks frequently occurred, however, post-1960s, outbreaks were less frequent and occurred,
ecade7.
on average, only once in a d
In general, the desert locust breeds extensively in semi-arid zones extending from West Africa through
the Middle East to Southwest Asia, threatening livelihoods of the population in over 65 countries. Between
2019–2020, unprecedented locust breeding was observed in Eritrea, Somalia, and Yemen due to unusually heavy
rainfall in the horn of Africa between October to mid-November 2019, more than 400% above average8. Fol-
lowing this breeding, countries in the horn of Africa, such as Ethiopia, Kenya, and Somalia, are experiencing
extraordinary swarms never witnessed during the past 25 years. The current swarm is estimated to consume
~ 1.8 million MT of vegetation per day across 123,200 km2, which represents 11% of Ethiopia’s total land area9.
In Kenya, the locust has spread to approximately 107,000 km2 (20% of Kenya) (Kenyan Multi-Agency Team on
Desert locust, 2020), and very recently, the locust has invaded Uganda, South Sudan, and Tanzania. It is antici-
pated to move northward into Sudan and possibly northern part of Chad. The current management strategy of
the locust swarm is aerial spraying with chemical pesticides, which has a high cost on humans, livestock, and
the environment in addition to its economic burden at the national level biodiversity.
1
International Centre of Insect Physiology and Ecology (ICIPE), P.O. Box 30772‑00100, Nairobi, Kenya. 2Desert
Locust Control Organization for Eastern Africa, P.O. Box 30023‑00100, Nairobi, Kenya. 3Plant Protection Services,
Ministry of Agriculture, Livestock and Fisheries, P.O. Box 34188‑00100, Nairobi, Kenya. 4Food and Agricultural
Organization, Viale delle Terme di Caracalla, 00153 Rome, Italy. *email: htonnang@icipe.org
Scientific Reports | (2020) 10:11937 | https://doi.org/10.1038/s41598-020-68895-2 1
Vol.:(0123456789)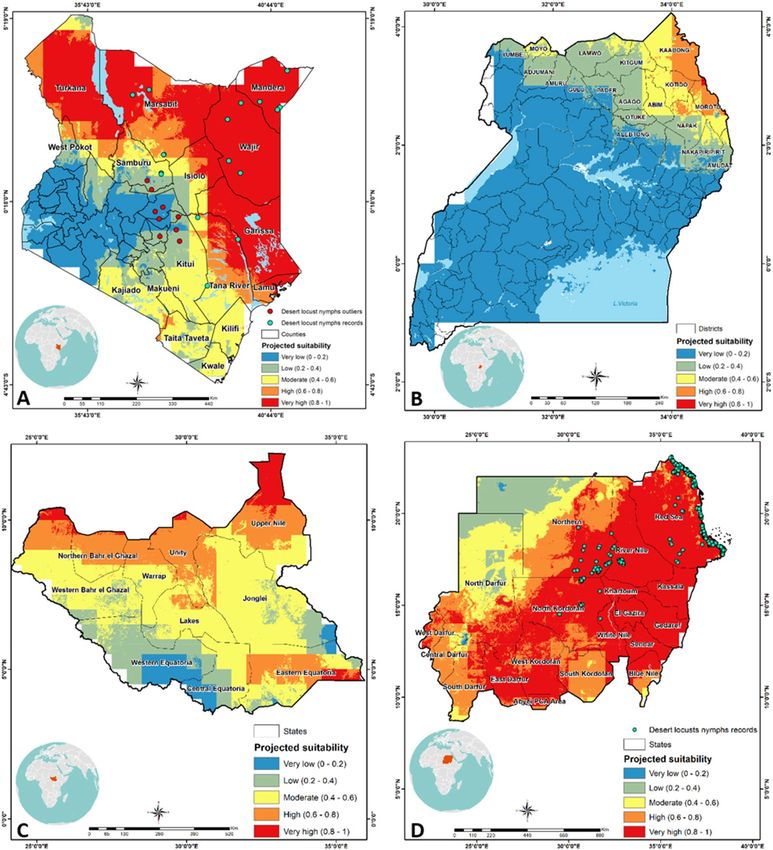
www.nature.com/scientificreports/
Figure 1. Area under curve for (A) Morocco, (B) Mauritania, and Saudi Arabia (C) models for evaluating the
performance of predicting desert locust breeding sites. Zero values for AUC indicate an impossible occurrence
area, while values of 1 indicate optimal occurrence area.
Studies have shown that desert locust has the ability to change its behaviour, ecology, and physiology in
response to the changes in climatic conditions10. In particular, within a few weeks, swarming adults mature,
mate, and begin to oviposit in soils at 10–15 cm below ground in suitable environments in the invaded zones2,11.
Suitability for oviposition and subsequent breeding is influenced by factors such as soil type, sand content, soil
moisture, surface air temperature, rainfall, and prevalence of vegetation2,12. The emerging hoppers (nymphs),
which are the wingless juvenile stage, can concentrate to become more gregarious and form bands that crawl on
the surface over long distances. After several moultings, up to six times, hoppers transition to adults which can
come in contact to form a gregarious p hase2. The time needed for the desert locust to transition from one stage
to the other is highly dependent on the weather patterns13,14. Both the hopper bands and adult swarms can cause
significant damage to the vegetation and crops in the invaded zones. Therefore, to prevent catastrophic swarms
from maturing hoppers, it is critical to strengthen ground and aerial surveillance efforts to identify potential
breeding sites for timely and effective management of hopper bands. However, effective ground and aerial sur-
veillance are constrained by various factors including extensive area of invasion (e.g., 107,000 km2 in Kenya),
inaccessibility of invasion zones due to poor infrastructure, limited resources, lack of human capacity for moni-
toring and control, and difficulties in predicting suitable areas for breeding and outbreaks. Such constraints are
typical to the currently invaded zones in Kenya, Uganda, and South Sudan, and to other nearby countries at risk.
Previous desert locust outbreaks in the Horn of Africa were observed in 1996–1998, and it affected countries
along the Red Sea, with infestations primarily concentrated in Saudi Arabia and, to a lesser extent, in Egypt,
Ethiopia, Eritrea, Northern Somalia, Sudan, and Yemen. Countries such as Kenya and Uganda have not experi-
enced the current level of desert locust invasion for more than 70 years, and little or no information is available
on the suitability of specific sites for desert locust oviposition and b reeding13. Such information is urgently needed
to strengthen surveillance (ground and aerial) efforts, regional coordination, and preparedness, inform efforts
and improve the delivery of preventive measures before the newly emerging hoppers cause damage.
Locust (desert locust and grasshopper) outbreak prediction and monitoring can be modelled using ecologi-
cal niches (EN) a pproaches15,16. A category of EN models apply machine learning algorithms that correlate a set
of environmental conditions (e.g., bio-climatic variables) to species presence and absence records to predict its
suitable habitats17. For instance, maximum entropy (MaxEnt), genetic algorithm for rule-set production (GARP),
and ecological niche factor analysis (ENFA) are EN tools that predict species suitability using presence-only
data18,19. MaxEnt was revealed to provide a reasonably better result compared to other presence-only m odels18.
In specific, MaxEnt assumes that the suitable areas for occupancy by species would corroborate to the physics
principle of maximum entropy without any environmental restrictions. The model predicts habitat suitability by
fitting a probability distribution for the incidence of the species across the whole area. However, MaxEnt often
experiences overfitting at low threshold levels than, e.g., GARP m odels19.
The objective of this paper is to develop a decision support tool that enables governments and their develop-
ment partners to control the locust invasion from its breeding sites effectively. The specific objectives are to (1)
model the relationship between known desert locust breeding sites around the world with critical bio-climatic
(temperature and rainfall) and edaphic (sand and moisture contents) variables using MaxEnt EN model, and
(2) validate the model with the existing database, and further develop predictions on potential areas for desert
locust oviposition and breeding in Kenya, Uganda, South Sudan, and Sudan.
Results
Model validation and evaluation of the performance of the projections to other nations. The
area under the curve (AUC) on the graphs confirmed that all individual models performed well in predicting
Morocco (Fig. 1A), Mauritania (Fig. 1B), and Saudi Arabia (Fig. 1C) desert locust breeding areas. The model
generated from Mauritania had the highest mean AUC value (0.887), followed by the models from Saudi Arabia
(0.884), and Morocco (0.820).
The results show that the Morocco model parameters obtained from the MaxEnt algorithm (Fig. 2A) per-
formed the best for projecting desert locust breeding sites to other countries as compared to Mauritania and Saudi
Arabia (results are not shown) models. In specific, Fig. 2B,C reveal validation of the Morocco model projecting
to Mauritania and Saudi Arabia using independent presence records that were not used during model develop-
ment. The Morocco model projecting to Mauritania had the highest mean of 0.85 with skewness of − 3.59, and
a median of 0.9 (Fig. 2B), followed by the Morocco model projecting to Saudi Arabia with a mean of 0.84, a
skewness of − 2.15, and a median of 0.95 (Fig. 2C).
Scientific Reports | (2020) 10:11937 | https://doi.org/10.1038/s41598-020-68895-2 2
Vol:.(1234567890)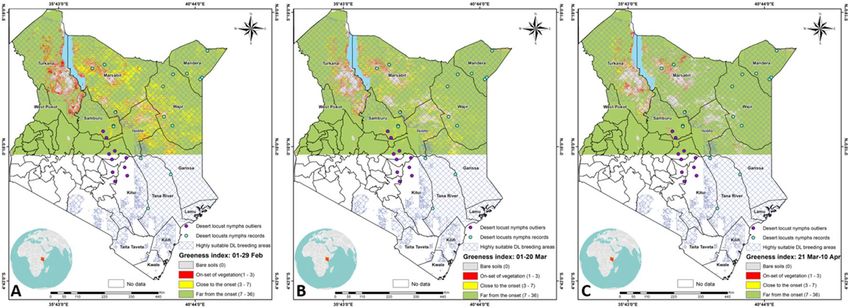
www.nature.com/scientificreports/
Figure 2. Histogram and normal distribution fit for (A) Morocco model, (B) Mauritania model projected from
Morocco, and (C) Saudi Arabia model projected from Morocco.
Figure 3. (A) Graphical representation of the ecological niche model for breeding sites of desert locusts in
Morocco obtained from MaxEnt with Morocco presence records. (B) Projected model for Mauritania from
Morocco model. (C) Projected model for Saudi Arabia from Morocco model. Warmer colors (red) show areas
with better-predicted conditions and the green dots indicate the presence locations used for validating the
projected models. The figure was generated using the QGIS 3.10.2 software (https://qgis.org/downloads/)21.
%
Variable Contribution
Temperature 70.2
Soil moisture 24.7
Sand content 3.9
Rainfall 1.2
Table 1. Percentage contribution of environmental variables in the Morocco model of predicting desert locust
breeding sites to East Africa.
Moreover, the results reveal that the predicted high and very high suitability scores for desert locust breed-
ing sites in the three countries (i.e., Morocco, Mauritania and Saudi Arabia) matched with known desert locust
nymph presence locations (Fig. 3), except in the northeastern Morocco (Fig. 3A), northern Mauritania (Fig. 3B),
and towards the central region of Saudi Arabia (Fig. 3C). This confirms the good performance of the Morocco
MaxEnt model when projected to the other two countries.
Environmental variable importance and impact. Table 1 presents the contribution of each envi-
ronmental variable in the Morocco model projecting to East Africa for predicting desert locust breeding sites.
Although rainfall, temperature, soil moisture, and sand content played a considerable role in the model, their
level of importance varied. Temperature had the highest contribution in the model, while rainfall had the least
contribution (Table 1).
Results from the jackknife test of variable importance (Fig. 4) indicate that the variable with the highest
gain, when used in isolation, was temperature. This variable decreases the model value of gain the most when
it is omitted.
Scientific Reports | (2020) 10:11937 | https://doi.org/10.1038/s41598-020-68895-2 3
Vol.:(0123456789)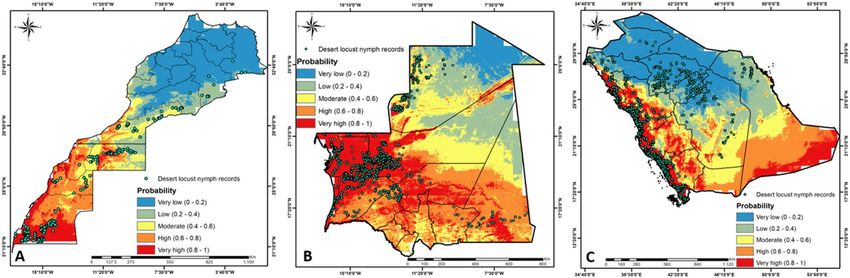
www.nature.com/scientificreports/
Figure 4. Jackknife of regularized training for Morocco model of desert locusts breeding sites projected to East
Africa. Temperature and soil moisture have the highest gain when used in isolation.
Modelling desert locust breeding suitability in East Africa. Overall, the results indicate that there
is a high probability for desert locust breeding in the northern and eastern regions of Kenya and most parts of
Sudan (Fig. 5A,D). However, breeding sites are low in Uganda (Fig. 5B) and restricted to the northern regions
bordering South Sudan and Kenya. South Sudan is at risk of breeding in the northern regions and the south east
corner bordering Kenya (Fig. 5C).
Based on the established model for Morocco projected in Kenya, it is estimated that there is a high probability
for desert locust breeding sites in the northern and eastern counties of Mandera, Wajir, Marsabit, Isiolo, Garissa,
and Turkana (Fig. 5A). Few hotspots can also be expected in Samburu, West Pokot and Northern parts of Tana
River. Current swarms of desert locust have not moved towards the Kenyan coast. In the event this happens,
some few pockets of breeding sites can also be foreseen in Lamu. Other counties in Kenya are mostly unsuitable
for breeding and establishment of desert locusts.
The Morocco model projected in Uganda estimated that districts with high probability for desert locust
breeding exist in the north, east, and northeast, especially Kotido, Kaabong, and Moroto, followed by Napak,
Abim, Kitgum, Moyo, and Lamwo districts (Fig. 5B). Most of the other regions are unsuitable for desert locust
breeding. In South Sudan, regions with high probability for the establishment of desert locust breeding sites exist
in northern Bahr el Ghazal, Unity, Upper Nile, and Eastern Equatoria, followed by Warrap, Lakes, and some
parts of Jonglei (Fig. 5C). Based on the Morocco model, it is estimated that in Sudan, the regions from Darfur
in the Southwest to the Red Sea in the northeast, except the northwestern region, have a high probability for the
establishment of desert locust breeding sites (Fig. 5D).
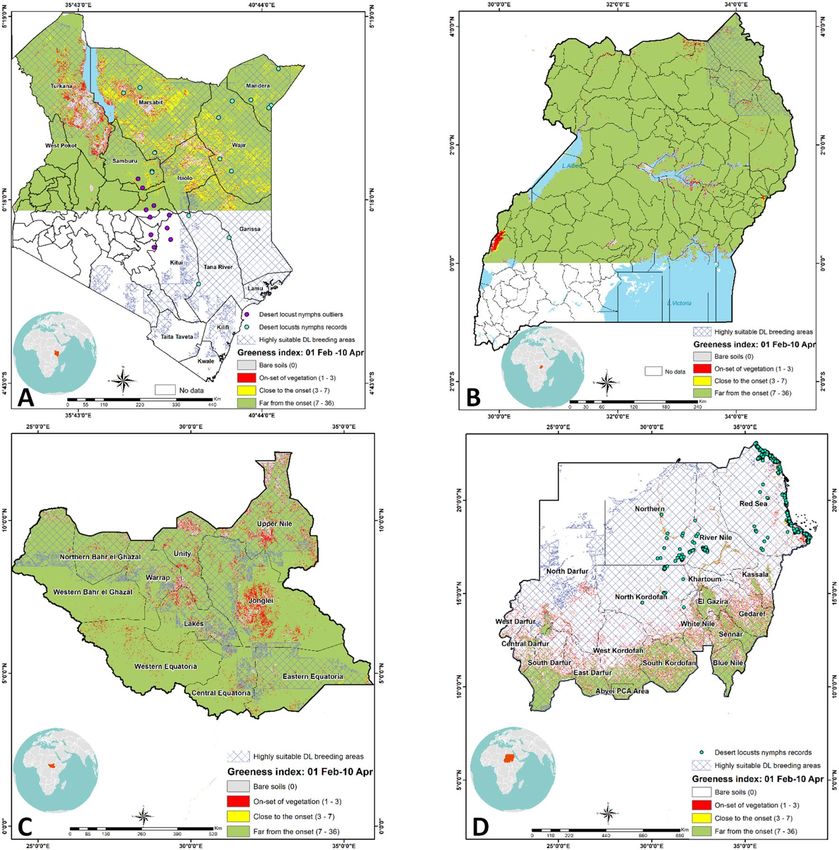
Vegetation impact on desert locust breeding sites in Kenya, Uganda, South Sudan, and
Sudan. Based on the overlaying of desert locust habitat suitability area (> 0.5 probability) with the vegetation
layer (Fig. 6) of these countries, it is predicted that the likelihood for desert locust breeding is high in northeast-
ern Kenya (Mandera, Wajir, Marsabit, Garissa counties), Turkana, and a few sites in Samburu with the presence
of edible vegetation and high suitability for desert locust breeding (Fig. 6A). Similarly, in Uganda, the likelihood
of desert locust establishing a breeding population is high in Kaabong, Kotido, and Moroto, also with relatively
lower vegetation density (Fig. 6B). In South Sudan, Unity, Upper Nile, Eastern of the Equator, and some parts
of Lakes and Jonglei are modeled to be suitable for the establishment of breeding populations (Fig. 6C). These
regions are covered by low to moderately dense vegetation. However, in Sudan, most of the breeding populations
occurred in regions with low to very low vegetation (mostly desert) (Fig. 6D).
Within the potential desert locust breeding areas, the temporal vegetation change from 1st Feb to 10th April
highlight particular sites favorable for desert locust breeding and illustrate how these sites evolve with time in
Kenya (Fig. 7). The maps indicate the temporal vegetation change transitioning from one month to the next. The
regions shaded in red indicate the on-set of vegetation.
Discussion
All datasets used in the modeling experiments were obtained from secondary sources; no survey for ground
scouting was conducted. The study, therefore, aligns with the concept promoted by the open science movement
that is encouraging the reuse of data for further discovery and advisory21. Models that use only presence data
are easier to develop and are popular as opposed to those that use input presence and absence data c onjointly20.
Presence data are usually simpler to obtain while confirming the absence of an organism involves extensive
and detailed surveys18,19. However, in the absence of reliable data, models using both presence and absence
datasets should be p referred22. But, a number of factors must be met. First, observed presence records used in
the modeling exercises should be the outcome of a well-structured random sampling, which minimizes bias.
Second, the occurrence records during sampling should not vary with any covariate that determines the suit-
ability probability22. Given these challenges we applied a practical and robust modeling framework to predict the
desert locust ecological breeding niche using existing presence data and ecological variables of three countries-
Morocco, Mauritania, and Saudi Arabia, followed by projections to these countries. The best model was used
to estimate the potential suitability to other countries, including Kenya, Uganda, South Sudan, and Sudan. Our
assumptions are further substantiated by the fact that presence records collected within a country most likely
follow a similar protocol, and lumping multiple datasets from many countries with different sampling protocols
may provide a bias in the output of the assessment. Similarly, Piou and co-authors23 used historical desert locust
Scientific Reports | (2020) 10:11937 | https://doi.org/10.1038/s41598-020-68895-2 4
Vol:.(1234567890)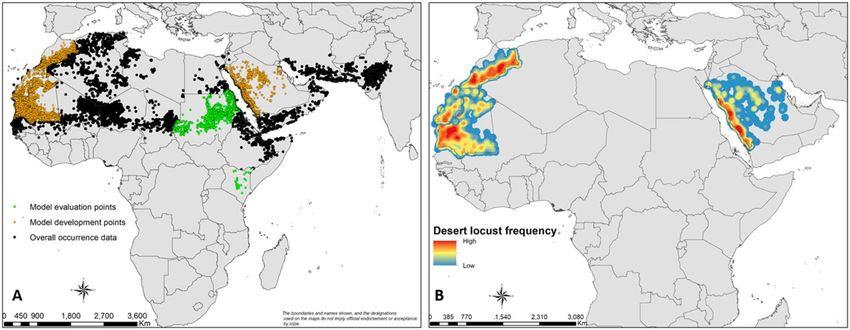
www.nature.com/scientificreports/
Figure 5. A graphical representation of the projected model for desert locust breeding sites in Kenya (A),
Uganda (B), South Sudan (C), and Sudan (D) from Morocco model .The dots found in Sudan (647) and Kenya
(28) are historical (from 2013 to 2019) and actual (2020) records, respectively, used for measuring the developed
model performance. The figure was generated using the QGIS 3.10.2 software (https://qgis.org/downloads/)21.
occurrence observations to model the spatiotemporal distribution of desert locust in Mauritania and Morocco
and found that it was possible to estimate the probabilities of seasonal desert locust breeding area.
We used an innovative model validation protocol in a such way that the MaxEnt machine learning algorithm
was employed with a cross-validation strategy to avoid o verfitting24,25. This technique consists of splitting the
available records into two sets; the training set representing approximately 70% and the test data corresponding
to 30% of the records. After the split, the test set is kept aside, and 40% to 50% is randomly extracted from the
training dataset and used to run and lean MaxEnt model interactively. The validation exercise uses the remaining
training datasets. The model development ends with the evaluation process that uses the test data. In addition
to the cross-validation, we modified the strategy by using 100% of the presence records in the country, and we
introduced another approach to evaluate the model. The model developed with data originating from country
A (Morocco) was evaluated with a complete independent (not used for the training experiment) record from
country B (Mauritania) and country C (Saudi Arabia) and vice versa. Only the model that performed well
against different datasets from the different regions was reasonably used to create predictions for the targeted
countries viz., Kenya, Uganda, Southern Sudan, and Sudan. To make the process more robust, we fitted known
Scientific Reports | (2020) 10:11937 | https://doi.org/10.1038/s41598-020-68895-2 5
Vol.:(0123456789)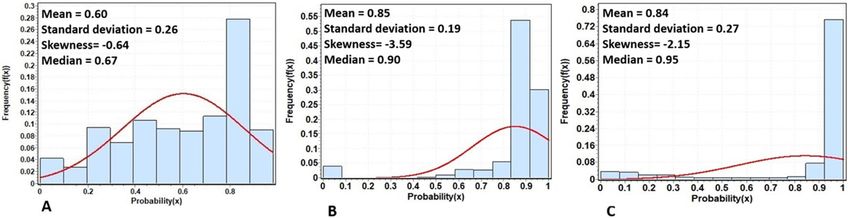
www.nature.com/scientificreports/
Figure 6. Overlaid layer of desert locust habitat suitability area (> 0.6 probability) with the greenness index
from February–April 2020: (A) Kenya, (B) Uganda, (C) South Sudan, and (D) Sudan. Values ranging from 1–3
shaded in red indicate the areas with on-set of vegetation favorable for desert locust. Point locations with green
vegetation that overlap with models’ outputs are actual desert locust highly suitable breeding areas.The figure
was generated using the QGIS 3.10.2 software (https://qgis.org/downloads/)21.
geo-referenced data from two projected countries (Kenya and Sudan) to measure and confirm the ability of the
developed model to predict the breeding sites successfully.
We used environmental variables to characterize the probability of the desert locust breeding sites suitability,
and all models developed provided an identical ranking of the percentage contribution of these variables but
with differences in the level of contribution for each variable. This discrepancy may be explained by the quan-
tity of data used as a proportion of the total size area of the country. MaxEnt, as most learning algorithms, is a
data-driven machine; the more representative the data is, the more optimized is the learning process and the
accuracy of the p rediction18,19.
Surface temperature emerged as a critical factor, followed by soil moisture and sand content. Female
desert locusts are known to prefer warmer and more open sites for initiating probing and digging activity for
oviposition26. After the selection of sites based on surface temperature, females chose oviposition sites based on
soil parameters, such as dry, soft, and sandy surface soil. The soil moisture at surface up to 6 cm is not important
for selection, but at depths beyond 6 cm, soil moisture is critical for s election2,26. Rainfall emerged as the least
important variable for desert locust breeding suitability. However, Adu-Acheampong and co-authors15 revealed
that desert locust eggs could remain undeveloped for years but start to hatch with the onset of rainfall. This is
perhaps because rainfall contribution is somehow already captured by the soil moisture.
Scientific Reports | (2020) 10:11937 | https://doi.org/10.1038/s41598-020-68895-2 6
Vol:.(1234567890)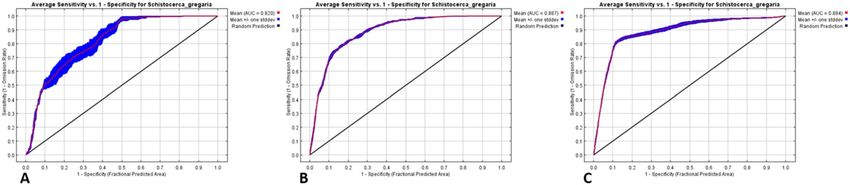
www.nature.com/scientificreports/
Figure 7. Temporal vegetation change from 1st Feb to 10th April (left to right) showing areas with on-set of
vegetation favorable for desert locust breeding. These maps have shown that the potential location of desert
locust breeding sites evolves with time in a predicted area in Kenya. The figure was generated using the QGIS
3.10.2 software (https://qgis.org/downloads/)21.
Predicting the potential sites where desert locust can breed is of paramount importance. The current study
provides information for preparedness and prioritization of ground surveillance on desert locust breeding and
deployment of best-bet solutions for effective management of desert locust. The outcome of the study will assist
policy makers in prioritizing resource allocation and management actions, such as targeted surveillance, the
establishment of monitoring networks, mobilization of locust control products, and their application. The pre-
sent study demonstrated that vast areas in Kenya are at high risk of becoming home to these pests. Currently,
the swarms have stretched to over 17 counties reaching area south of equator like Embu. Our findings did not
identify this location (Embu) as a potential breeding site. However, despite extensive swarming locust oviposi-
tion happens only in the most suitable habitats as observed earlier in the 1950s when, Kenya witnessed the last
major locust upsurge12. The hatching and survival of eggs will heavily depend on the prevailing environmental
conditions that should be similar to what prevails in the northern region of Kenya. Adult desert locust eggs laid
in areas such as Mandera, Wajir, Garissa, Marsabit, Turkana, and few sites in Samburu can survive and hatch
within weeks or remain undeveloped for years and, as soon as the environmental conditions become favorable,
the cycle will continue due to the species fast-changing behavior. With the magnitude of the ongoing desert locust
invasion in Kenya, it may become necessary to establish a permanent monitoring unit within the country. The
maps generated in the present study could guide such units to undertake focused and cost-effective monitoring
efforts. In Uganda, few sites in the north eastern regions have a high potential for supporting breeding popula-
tions. Based on the area coverage of the desert locust breeding suitability in the country, it may not be necessary
to invest much for constant monitoring. However, Uganda may establish a task force that will work with Kenya’s
monitoring team for anticipated actions in case of possible outbreak conjointly. Suitability for desert locust
establishing a breeding population is high in the south eastern and northern regions of South Sudan.
To improve the model predictions, vegetation, considered as a catalyst for desert locust selecting breeding
locations, was overlaid onto the projected maps in targeted countries. Previous reports have indicated that type
of vegetation is critical for desert locust oviposition and breeding. Ecotone belts and mosaic vegetation are
more preferred over uniform vegetation and topography for females to settle and o viposit25. Although we noted
some gaps in the location of green vegetation for the southern part of Kenya and Uganda, this study provides a
reasonable tool that will guide survey teams to monitor potential breeding areas and avoid unnecessary guesses
and investment for monitoring. However, detailed assessment of the temporal variations in prevalence of veg-
etation and desert locust breeding, type of vegetation, and other metrics and inclusion of such metrics in the
modeling could aid in fine-tuning the model and adding precision to the prediction. Beyond the prediction of
breeding sites, the current desert locust outbreak is triggered by a change in rainfall pattern which expands areas
of potential invasion as a consequence of climate change, and other marginally suitable areas and conditions
may become suitable in the nearest future hence the need to monitor and generate data for refining the current
model continuously.
Methodology
Global data compilation and developing prediction models for desert locust breeding sites. A
search for information related to the occurrence/incidence of desert locust breeding sites was carried out through
Google and Web of Science. The keywords used for the search comprised the following: desert locust breeding
sites, desert locust band locations, hopper molt locations, and desert locust swarm sites. The focus was given to
countries in which the government invests significant resources on desert locust control, such as Morocco. On
the Moroccan anti-desert locust centre website (https://www.criquet-maroc.ma), a monthly report of the pres-
ence of desert locust at different stages is provided. Extensive time-series data were obtained from the Food and
Agriculture Organization (FAO) of the United Nations. Further data were also obtained from survey reports and
archives from the FAO website (https://www.fao.org/ag/locusts/en/info/info/index.html). Although we accessed
a total of 9,134 records, the development of the model only used 5,406 breeding sites from Morocco (367), Mau-
Scientific Reports | (2020) 10:11937 | https://doi.org/10.1038/s41598-020-68895-2 7
Vol.:(0123456789)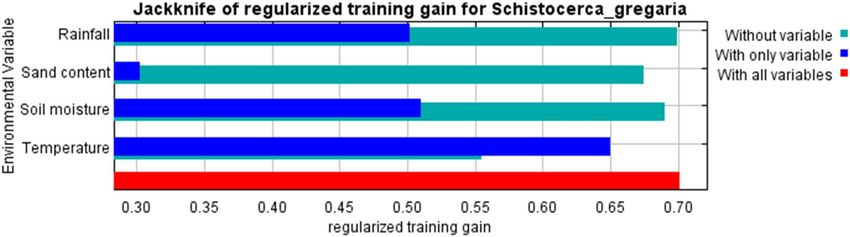
www.nature.com/scientificreports/
Figure 8. (A) Desert locust breeding sites collected in Africa, the Middle East, and Western Asia from 1985
to 2020. The brown dots are the records used for developing and validating the model; the green dots represent
the breeding sites used for measuring the model performance, while the black dots are known breeding sites for
desert locust. (B) Heat map indicating the hotspot areas where the majority of desert locust nymph presence
records were collected from 1985 to 2020 in Mauritania, Morocco, and Saudi Arabia. High intensity of desert
locust nymph presence is characterized by red color, while the blue color displays a low repetitive occurrence in
the same point location of desert locust nymph. The figure was generated using the QGIS 3.10.2 software (https
://qgis.org/downloads/)21.
ritania (2,661) and Saudi Arabia (1,703) (Fig. 8A) dating from 1985–2020. Data for measuring the performance
of the developed model for Kenya (n = 28) and Sudan (n = 647) were obtained from the Plant Protection Services
from the Ministry of Agriculture, Livestock and Fisheries, the Desert Locust Control Organization (DLCO) and
FAO.
Assumptions and pre‑processing of data. The study assumed that all records were randomly obtained
from a larger area within the country, as described in the FAO standard operating procedure (SOP) for desert
locust field s urveys2. Although countries are directed to use the FAO SOP for surveys, the accuracy of the sam-
ple size and quality and manipulation of the data may vary between countries. Therefore, we have considered a
country as a unit of metric and did not lump records obtained from distinct countries for developing the models.
For each country, environmental predictor variables were organized so that projections, grid cell sizes, and their
alignment, and spatial coverage were regular across all layers. The overall datasets (Fig. 8A) have many records
per grid cell because of either repeated occurrence over the years or sites being near to each other. Therefore, we
identified hotspots and clustering presence record points for a selected country for the modelling exercise. From
this analysis, a heat map was obtained (Fig. 8B) to highlight the frequency of desert locust breeding activity.
This map resulted from the kernel density estimation tool using the open source QGIS 3.10.2 software (https://
qgis.osgeo.org)20. The density is calculated based on the number of points in a location, with larger numbers of
clustered points resulting in high intensity. This heat map provided guidance in the choice of countries used for
model development. Further, it substantiated the selection of the best model used for the projections in countries
of East Africa that did not have breeding site records for the past 25 years.
Bio‑climatic and edaphic variables for modelling desert locust breeding suitability areas. Tem-
perature, rainfall, soil moisture, and sand content are the most critical environmental variables for desert locust
breeding locations14. Data on these variables were sourced from different platforms; monthly long term (1970–
2000) average temperature and rainfall datasets were sourced from Worldclim2 data platform (https://world
clim.org/)27, long term (1948–2020) average soil moisture was sourced from National Oceanic and Atmos-
pheric Administration (NOAA) Climate Prediction Center (https://www.psl.noaa.gov/data/gridded/data.cpcso
il.html)28 and sand content for 2016 at a depth of 5–15 cm was downloaded from the International Soil Reference
and Information Centre (ISRIC) Data Hub (https://data.isric.org)23. For temperature and rainfall, an average of
four months (December, January, February, and March) for each variable was calculated and used in the model.
These four months correspond to the desert locust invasion in East Africa. Rationally, the environmental vari-
ables used for our modelling experiments should be of identical years with the desert locust occurrence data.
These data mismatch motivated the choice of our methodology. Machine learning has been reported to not be
limited to prediction only, but the algorithms like MaxEnt has the potential to improve the efficiency and effec-
tiveness of the modelling experiments by correcting and overcoming data gaps especially in the context of long
term time s eries29. All datasets were pre-processed and adjusted to a uniform spatial resolution of 1 km before
the modeling experiments.
Modelling desert locust breeding suitability. Presence records of desert locust breeding locations in
axEnt17 machine
Mauritania, Morocco, and Saudi Arabia were pooled with environmental data using the M
Scientific Reports | (2020) 10:11937 | https://doi.org/10.1038/s41598-020-68895-2 8
Vol:.(1234567890)www.nature.com/scientificreports/
learning algorithm to estimate the suitable areas for oviposition at local and regional scales. MaxEnt performs
relatively well in the context of developing a model using presence records only14. The algorithm predictions
are logistic and based on the ability to estimate a distribution of probability based on the physics principle of
maximum entropy, which satisfies a set of checks from environmental variables24. In the context of this study, we
assumed that all data points from each country that were used in the modeling were obtained through laborious
sampling protocols that include selection bias. Hence, we consider the MaxEnt output as the level of environ-
mental suitability indicating a desert locust ecological breeding niche, expressed in probability.
Practically, the modeling experiments were carried out in multiple steps. First, MaxEnt was ran sequentially
using presence records from Mauritania, Morocco, and Saudi Arabia to predict the suitable habitat sites for desert
locust breeding in these countries. For each country, the model output was overlaid to its presence record layer
surfaces serving as a channel to extract the probability value of the pixel at each desert locust breeding point.
The obtained probability values were then used to estimate the model goodness-of-fit using the area under
the curve (AUC) of the receiver operating characteristic curve (ROC). Secondly, the model developed in one
country was projected in the other two countries to test for goodness-of-fit. Specifically, the model developed
from Morocco presence records was projected to Saudi Arabia and Mauritania. Similarly, the model developed
with Saudi Arabia’s presence records was projected to Morocco and Mauritania. Finally, the model we developed
with Mauritania’s presence records was projected to Morocco and Saudi Arabia. For all projections, desert locust
occurrence points were overlaid on the projected layer surfaces and then used to extract the probability values
of the pixel where each point lies in the projected raster layer. The analysis generated breeding area maps for
Saudi Arabia and Mauritania from Morocco model projections. The Morocco and Mauritania breeding area
maps developed from Saudi Arabia model projections. Likewise, the Morocco and Saudi Arabia maps obtained
from Mauritania model projections. To control overfitting, the individual run was repeated three times using
the cross-validation approach, and the results presented in this study are products of an ensemble of the three
modeling experiments. The obtained maps were compared with known presence point locations in the projected
countries using a histogram and a normal distribution fitting curve. Descriptive statistics were also generated
from the model outputs to recognize which among the projected models better captured the presence records in
the country of projection. We only present the descriptive statistic results of the best model projecting the desert
locust breeding sites to the other countries. Acknowledging that statistics alone cannot provide satisfaction of
the ecological rationality of the model outputs, we confirmed the results with a visual lens.
Projection of the best fit model to predict desert locust breeding sites. The best model param-
eters among the three countries (i.e., Morocco, Saudi Arabia, and Mauritania), were then used to project breed-
ing suitability in Kenya, Uganda, South Sudan, and Sudan. After modeling the desert locust breeding suitability,
we performed a comparison of the level of matching of the projected desert locust breeding suitability with
geo-referenced points with known desert locust breeding activity from field surveys in Kenya and Sudan. The
purpose of this exercise was to measure the model performance and confirm its ability to predict suitable breed-
ing sites in targeted regions accurately.
Vegetation impact on desert locust breeding sites. A product developed by Vlaamse instelling voor
technologisch onderzoek (VITO)12 to monitor temporal changes in vegetation over the desert locust recession
and invasion areas were sourced to assess the impact of vegetation on the breeding sites in Kenya, Uganda, South
Sudan, and Sudan. The product combines daily observations from SPOT and MODIS satellite imagery using the
middle infrared, near-infrared and red bands to develop greenness e stimates12. The product is developed every
ten days at a resolution of 250 m. The index is provided as a time meter, indicating the number of dekades since
the vegetation on-set12. This highlights the number of dekades a pixel appears to have vegetation from its on-set
to the current dekade; hence the greenness is a measure of the transition from no vegetation to the startup of
vegetation occurrence12. This helps in detecting vegetation emergence in arid and semi-arid regions. The 10-days
dynamic maps dating from the beginning of February 2020 to the first week of April 2020 were downloaded
from the VITO website, analyzed, and overlaid in the developed model outputs. This is used to dynamically
detect the progression of the changes of breeding sites locations due to the temporal variation of the on-set of
vegetation in East Africa. Values from the model indicating high probability (> 0.5) of habitat suitability of desert
locust in Kenya, Uganda, South Sudan, and Sudan were masked out and overlaid on the vegetation layer to assess
the relationship between vegetation and breeding sites for the desert locust.
Received: 1 May 2020; Accepted: 30 June 2020
References
1. Cheke, R. A. & Holt, J. Complex dynamics of desert locust plagues. Ecol. Entomol. 18, 109–115 (1993).
2. Symmons, P. M. & Cressman, K. Desert Locust Guidelines: Biology and Behaviour (FAO, Rome, 2001).
3. Simpson, S. J. & Sword, G. A. Locusts. Curr. Biol. 18, R364–R366 (2008).
4. Brader, L. et al. Towards a more effective response to desert locusts and their impacts on food security, livelihoods and poverty.
Multilateral evaluation of the 2003–05 Desert locust campaign (Food and Agriculture Organisation, Rome, 2006).
5. Krall, S. Desert locusts in Africa: a disaster?. Disasters 19, 1–7 (1995).
6. Abate, T., van Huis, A. & Ampofo, J. K. O. Pest management strategies in traditional agriculture: An african perspective. Annu.
Rev. Entomol. 45, 631–659 (2000).
7. Van Huis, A., Cressman, K. & Magor, J. I. Preventing desert locust plagues: optimizing management interventions. Entomol. Exp.
Appl. 122, 191–214 (2007).
8. UNEP (2020). Locust swarms and climate change. https://www.google.com/search?
9. FAO (2020). Desert locust invasion in Ethiopia. https://www.google.com/search?
Scientific Reports | (2020) 10:11937 | https://doi.org/10.1038/s41598-020-68895-2 9
Vol.:(0123456789)www.nature.com/scientificreports/
10. Showler, A. T. Desert locust control: the effectiveness of proactive interventions and the goal of outbreak prevention. Am. Entomol.
65, 180–191 (2019).
11. Steedman (1990). Locust Handbook (Natural Resources Institute, Chatham, Google Search). https://www.google.com/search?
12. Pekel, J.-F. et al. Development and application of multi-temporal colorimetric transformation to monitor vegetation in the desert
locust habitat. IEEE J. Select. Top. Appl. Earth Observ. Remote Sens. 4, 318–326 (2010).
13. Rainey, R. C., Betts, E., Lumley, A. & Rainey, R. C. The decline of the Desert Locust plague in the 1960s: control operations or
natural causes?. Philos. Trans. R. Soc. Lond. B Biol. Sci. 287, 315–344 (1979).
14. Cressman, K. & Stefanski, R. (2016). Weather and Desert Locusts. https://www.google.com/search?
15. Adu-Acheampong, S. et al. Endemic grasshopper species distribution in an agro-natural landscape of the Cape Floristic Region,
South Africa. Ecol. Eng. 105, 133–140 (2017).
16. Justo, J. S. Identifying Desert locust breeding areas by means of Earth Observation in Mauritania. (Universidad de Valladolid, 2019).
17. Phillips, S. J., Dudík, M. & Schapire, R. E. Maxent software for modeling species niches and distributionns (Version 3.4. 1). Biodi-
versity Informatics (2017).
18. Elith, J. et al. Novel methods improve prediction of species’ distributions from occurrence data. Ecography 29, 129–151 (2006).
19. Townsend Peterson, A., Papeş, M. & Eaton, M. Transferability and model evaluation in ecological niche modeling: a comparison
of GARP and Maxent. Ecography 30, 550–560 (2007).
20. Team, Q. D. QGIS geographic information system. Open source geospatial foundation project. https://qgis.osgeo.org (2015).
21. Allen, C. & Mehler, D. M. Open science challenges, benefits and tips in early career and beyond. PLoS Biol. 17, e3000246 (2019).
22. Brotons, L., Thuiller, W., Araújo, M. B. & Hirzel, A. H. Presence-absence versus presence-only modelling methods for predicting
bird habitat suitability. Ecography 27, 437–448 (2004).
23. Piou, C. et al. Mapping the spatiotemporal distributions of the desert locust in Mauritania and Morocco to improve preventive
management. Basic Appl. Ecol. 25, 37–47 (2017).
24. Radosavljevic, A. & Anderson, R. P. Making better Maxent models of species distributions: complexity, overfitting and evaluation.
J. Biogeogr. 41, 629–643 (2014).
25. Hijmans, R. J. Cross-validation of species distribution models: removing spatial sorting bias and calibration with a null model.
Ecology 93, 679–688 (2012).
26. Skaf, R., Popov, G. B. & Roffey, J. The Desert Locust: an international challenge. Philos. Trans. R. Soc. Lond. B Biol. Sci. 328, 525–538
(1990).
27. Fick, S. E. & Hijmans, R. J. WorldClim 2: new 1-km spatial resolution climate surfaces for global land areas. Int. J. Climatol. 37,
4302–4315 (2017).
28. Fan, Y. & Van Den Dool, H. Climate Prediction Center global monthly soil moisture data set at 0.5 resolution for 1948 to present.
J. Geophys. Res. Atmos. 109, D10102 (2004).
29. Cagala, T. & Bundesbank, D. Improving data quality and closing data gaps with machine learning (Deutsche Bundesbank, German
Securities Holding Statistics, 2017).
Acknowledgements
We acknowledge the financial support for this research by the following organizations and agencies: the UK’s
Department for International Development (DFID), the Swedish International Development Cooperation
Agency (SIDA), the Swiss Agency for Development and Cooperation (SDC), and the governments of Kenya
and Ethiopia. We also wish to thank FAO, DLCO-EA and the Ministry of Agriculture, Kenya for sharing valuable
field data that enabled further modelling activity. CPC Soil Moisture data provided by the NOAA/OAR/ESRL
PSL, Boulder, Colorado, USA, from their Web site at https://psl.noaa.gov/.
Author contributions
Initiated the study: S.S., T.B., S.E., S.K. Conceived and designed the experiments: E.K., H.E.Z.T., S.S., E.M.A.,
N.S. Contributed reagents/materials/analysis tools: K.C., M.T., D.M. Analyzed the data: E.K., H.E.Z.T., E.M.A.,
S.S., N.S. Wrote the paper: H.E.Z.T., E.K., S.S., E.M.A., N.S., B.T., T.D., M.K., S.E., N.S. All authors read and
approved the manuscript.
Competing interests
The authors declare no competing interests.
Additional information
Correspondence and requests for materials should be addressed to H.E.Z.T.
Reprints and permissions information is available at www.nature.com/reprints.
Publisher’s note Springer Nature remains neutral with regard to jurisdictional claims in published maps and
institutional affiliations.
Open Access This article is licensed under a Creative Commons Attribution 4.0 International
License, which permits use, sharing, adaptation, distribution and reproduction in any medium or
format, as long as you give appropriate credit to the original author(s) and the source, provide a link to the
Creative Commons license, and indicate if changes were made. The images or other third party material in this
article are included in the article’s Creative Commons license, unless indicated otherwise in a credit line to the
material. If material is not included in the article’s Creative Commons license and your intended use is not
permitted by statutory regulation or exceeds the permitted use, you will need to obtain permission directly from
the copyright holder. To view a copy of this license, visit http://creativecommons.org/licenses/by/4.0/.
© The Author(s) 2020
Scientific Reports | (2020) 10:11937 | https://doi.org/10.1038/s41598-020-68895-2 10
Vol:.(1234567890)You can also read