A Monitoring Strategy for the Western Population of American White Pelicans: 2018 Revision
←
→
Page content transcription
If your browser does not render page correctly, please read the page content below
A Monitoring Strategy for the Western Population
of American White Pelicans: 2018 Revision
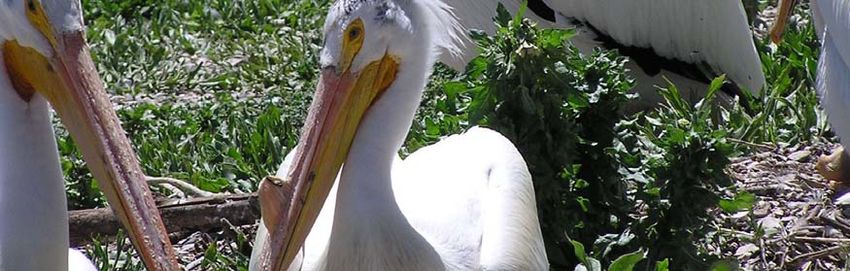
Photo Credit: Colleen Moulton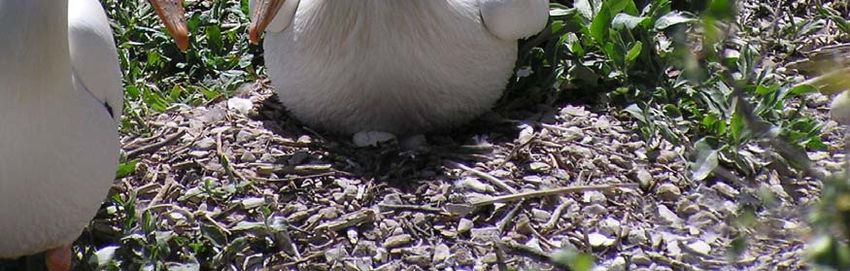
Inquiries about this monitoring strategy may be directed to member states of the Pacific Flyway Council
or to the Pacific Flyway representative, U.S. Fish and Wildlife Service, 911 N.E. 11 Avenue, Portland,
Oregon 97232. Information regarding the Pacific Flyway Council and management plans can be found
at www.pacificflyway.gov/Management.asp.

Suggested citation: Pacific Flyway Council. 2018 A Monitoring Strategy for the Western Population of
American White Pelicans: 2018 Revision. Pacific Flyway Council, U.S. Fish and Wildlife Service,
Portland, Oregon. 19 pp.
A Monitoring Strategy for the Western Population of
                 American White Pelicans: 2018 Revision

                                          Prepared for the

                                       Pacific Flyway Council

                                               by the

                           Pacific Flyway Nongame Technical Committee

                                         as directed by the

                                American White Pelican Subcommittee

                                          September 2018

Approved by:

                                                                9/28/18
Chair, Pacific Flyway Council                                   Date

                                                 ii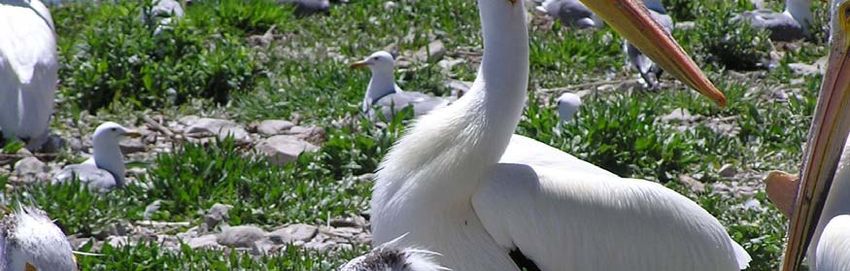
ACKNOWLEDGMENTS

This monitoring strategy was prepared by the Pacific Flyway Nongame Technical Committee as
directed by the American White Pelican Subcommittee. Josh Dooley served as primary author on the
original 2013 Strategy and coordinated with the subcommittee to prepare drafts and compile reviews.
Updates to the 2018 revision were completed by the Pacific Flyway Nongame Technical Committee.
Members of the Subcommittee and others who contributed significantly to this revised plan include:

American White Pelican Subcommittee Members
Russell Norvell, Utah Division of Wildlife Resources
Colleen Moulton, Idaho Department of Fish and Game
Cris Tomlinson, Nevada Department of Wildlife
Michelle McDowell, U.S. Fish and Wildlife Service

Other Nongame Technical Committee Members
Travis Booms, Alaska Department of Fish and Game
James Driscoll, Arizona Game and Fish Department
Carie Battistone, California Department of Fish and Wildlife
Christina Donehower, Oregon Department of Fish and Wildlife
Joe Buchanan, Washington Department of Fish and Wildlife
Allison Begley, Montana Department of Fish, Wildlife, and Parks

Other Contributors
Richard Lanctot, U.S. Fish and Wildlife Service representative
Mike Green, U.S. Fish and Wildlife Service representative
Erin Roche, Idaho Department of Fish and Game
Shane Roberts, Idaho Department of Fish and Game
Jon Horne, Idaho Department of Fish and Game

                                                  iii
EXECUTIVE SUMMARY

Localized depredation issues prompted the Pacific Flyway Council’s Nongame Technical Committee to
develop a management framework for the American White Pelican (Pelecanus erythrorhynchos; herein
pelican). In July 2012, A Framework for the Management of American White Pelican Depredation on
Fish Resources in the Pacific Flyway was approved and adopted by the Pacific Flyway Council (Pacific
Flyway Council 2012; herein Framework). The highest priority strategy under the Population
Assessment Objective in the Framework called for developing and implementing a monitoring strategy
for pelicans at the flyway scale to guide and assess management actions.

In 2013, the Pacific Flyway Council adopted A Monitoring Strategy for the Western Population of
American White Pelicans within the Pacific Flyway (herein Strategy). The goal of the Strategy is to
establish a coordinated, long-term monitoring effort to estimate the breeding population size, trend, and
distribution of the western population of pelicans. Since the adoption of the Strategy, a subsequent
analysis of population dynamics in western pelicans (Moulton et al. 2018) revealed a need to revise the
recommended survey timing due to strong population density-dependence. The original Strategy
recommended surveys once every three years; however, to appropriately assess abundance and trends in
a density-dependent population, surveys in consecutive years are necessary. In addition, a revised power
analysis that incorporated more data than available in 2013, indicated a need to revise the original
monitoring objective from having the ability to detect a 5% change/year, to having the ability to detect a
6% change/year. This change remains comparable to other monitoring efforts for waterbird species in
the West.

In sum, the objective of this Strategy is being revised to detect a 6% change/year with 80% power (β =
0.20) and a 10% Type I error rate (α = 0.10) over a 10 year period. A power analysis was conducted to
determine the most cost effective sampling scheme to achieve the revised monitoring objective.
Monitoring will now occur in two consecutive years with a two-year break for 10 years (i.e., 2017-2018,
2021-2022, 2025-2026).

Monitoring following the revised schedule began in 2017 and 2018. Three breeding sites (Neponset in
Utah, Padilla Bay in Washington, and Puntzi Lake in British Columbia) have been added since the
original 2013 Strategy, where 18 known active breeding colonies were within the western population.
All sites, including any new sites discovered, will be monitored under the revised Strategy.

                                                    iv
TABLE OF CONTENTS
BACKGROUND ........................................................................................................................................ 1
Scope ...................................................................................................................................................... 1
Goal ........................................................................................................................................................ 4
Monitoring Objective ............................................................................................................................. 4
MONITORING STRATEGY ..................................................................................................................... 5
Definition of Terms ................................................................................................................................ 5
Sampling Approach................................................................................................................................ 5
MONITORING TECHNIQUES................................................................................................................. 7
Overview ................................................................................................................................................ 7
Aerial Counts ......................................................................................................................................... 7
Ground Counts ....................................................................................................................................... 8
Boat Counts ............................................................................................................................................ 9
IMPLEMENTATION ................................................................................................................................. 9
BUDGET .................................................................................................................................................... 9
LITERATURE CITED ............................................................................................................................. 10
APPENDICES .......................................................................................................................................... 12
APPENDIX A: Sampling Approach .................................................................................................... 12
APPENDIX B: 2018 Data Sheet and Instructions ............................................................................... 17
LIST OF TABLES
Table 1. The number of breeding individuals at pelican breeding colonies in 2017 for the western
population. .................................................................................................................................................. 3
Table 2. Suggested monitoring dates for Pacific Flyway states/provinces. ................................................ 6
LIST OF FIGURES
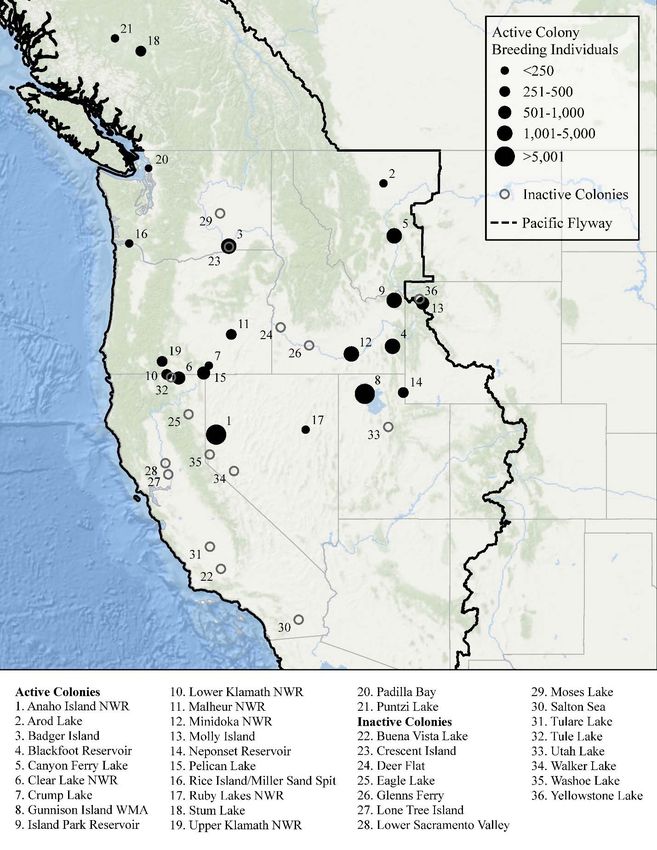
Figure 1. Size, location, and current activity of pelican breeding colonies in the western population. ..... 2
Figure 2. Relationship between annual rate of change (rt) and breeding pelican abundance (Nt) in the
western pelican population (Moulton et al. 2018). Smaller, more recently established colonies are
experiencing positive growth rates, while larger older established colonies are not. ................................. 4
vBACKGROUND
Localized depredation issues prompted the Pacific Flyway Council’s Nongame Technical Committee
(NTC) to develop a management framework for the American White Pelican (Pelecanus
erythrorhynchos; herein pelican) in 2012. A Framework for the Management of American White Pelican
Depredation on Fish Resources in the Pacific Flyway (herein Management Framework) was approved
and adopted by the Pacific Flyway Council in 2012 (Pacific Flyway Council 2012). The goal of the
Management Framework was to maintain pelicans as a natural part of the waterbird biodiversity of the
Pacific Flyway, while minimizing negative ecological, economic, and social impacts of pelican
depredation. The Management Framework included a synopsis of species’ biology and status,
descriptions of resource conflicts, management options, regulatory requirements, and recommended
management strategies. The highest priority strategy under the Population Assessment Objective in the
Management Framework called for developing and implementing a monitoring strategy for pelicans at a
flyway scale to guide and assess management actions.
In 2013, A Monitoring Strategy for the Western Population of American White Pelicans within the
Pacific Flyway (herein Strategy) was written and subsequently adopted by the Pacific Flyway Council as
the first coordinated monitoring strategy for pelicans in the Pacific Flyway (Pacific Flyway Council
2013). Since the adoption of the Strategy, a subsequent analysis of population dynamics in western
pelicans (Moulton et al. 2018) revealed a need to revise the recommended survey timing due to strong
population density-dependence. Further power analysis showed the need for higher frequency sampling
to achieve acceptable trend detection levels. The 2013 Strategy anticipated the need for subsequent plan
review and revision if indicated by new data or analyses; this revision is a result of that review process.
The primary changes to the original document include an updated power analysis, a revised monitoring
objective, and a new recommended survey schedule using two consecutive years of surveys, followed by
a two year gap, for a minimum of 10 years (i.e., through 2026).
Scope
Spatial — The Strategy pertains to the western population of pelicans, which includes all pelicans
known to breed west of the continental divide and the pelicans within the colonies at Molly Islands of
Yellowstone National Park, Wyoming, and Canyon Ferry Lake and Arod Lake, Montana. Within this
population, pelicans breed at over 20 colonies within eight states and British Columbia (Fig. 1, Table 1).
Temporal — Monitoring began in 2014 and was repeated in 2017 according to the original 2013
Strategy. Recent analyses (Moulton et al. 2018) indicated a strong density-dependent population; the
breeding population size in a particular year appears to be negatively influenced by the breeding
population size in the prior year (Fig. 2). To properly monitor this type of population, back-to-back
survey years are necessary.
Therefore, all breeding colonies will be surveyed in two consecutive years with a two year gap (i.e.,
2017-18, 2021-22, and 2025-26). As a result of ongoing pelican management actions and needs, it is
anticipated that monitoring will need to continue beyond this timeframe. The NTC will, in consultation
with the U.S. Fish and Wildlife Service (USFWS), continue to evaluate the Strategy’s effectiveness, and
make modifications as needed to extend monitoring as necessary.
Focus — Monitoring will provide information about the breeding population status and trends of the
western population of pelicans. Monitoring the breeding population is sufficient to track trends, and the
information is commonly used to inform management decisions. The primary component of this
1Figure 1. Size, location, and current activity of pelican breeding colonies in the western population.
2Table 1. The number of breeding individuals at pelican breeding colonies in 2017 for the western
population.
Breeding
Colonya Individualsb Year Sourcec Survey Method
British Columbia
Stum Lake 77 2017 FLNRO – Natural Resource Operations Boat
Puntzi Lake 232 2017 FLNRO – Natural Resource Operations Within-colony
California
Clear Lake NWR 868 2017 OSU, 2017 Final Report to ODFW Aerial (Photo Count)
Lower Klamath NWR 466 2017 OSU, 2017 Final Report to ODFW Aerial (Photo Count)
Idaho
Blackfoot Reservoir 1,232 2017 IDFG, unpubl. data Within-colony
Minidoka NWR 2,118 2017 IDFG, unpubl. data Within-colony
Island Park Reservoir 1,650 2017 IDFG, unpubl. data Within-colony
Montanad
Arod Lake 332 2017 MFWP, USFWS, unpubl. data Perimeter
Canyon Ferry Lake 3,276 2017 MFWP, unpubl. data Perimeter
Nevada
Anaho Island NWR 20,860 2017 NDOW, USFWS, unpubl. data Aerial (Photo Count)
Ruby Lakes NWR 0 2017 NDOW, USFWS, unpubl. data Perimeter
Oregone
Crump Lake 0 2017 OSU, 2017 Final Report to ODFW Aerial (Direct Count)
Malheur NWR 0 2017 OSU, 2017 Final Report to ODFW Aerial (Direct Count)
Upper Klamath NWR 470 2017 OSU, 2017 Final Report to ODFW Aerial (Photo Count)
Pelican Lake 674 2017 OSU, 2017 Final Report to ODFW Aerial (Photo Count)
Miller Sand Spit/Rice Island 204 2017 OSU, 2017 Final Report to ODFW Aerial (Photo Count)
Utah
Gunnison Island WMA 8,342 2017 UDWR 2017 Aerial (Photo Count)
Neponset Reservoir 916 2017 UDWR 2017 Aerial (Direct Count)
Washington
Badger Island, McNary NWR 3,770 2017 BRNW Aerial (Photo Count)
Unnamed Island, Padilla Bayf 36 2017 OSU, Citizen Scientist Boat
Wyomingd
Molly Lake, Yellowstone NP 560 2017 WGFD, unpubl. data Aerial (Photo Count)
TOTAL 46,083
a States/provinces not listed have no known breeding population; NWR= National Wildlife Refuge; NP = National Park
b In most cases, the number of nests or breeding pairs was multiplied by two to derive the number of breeding individuals.
c BRNW=Bird Research Northwest; IDFG=Idaho Department of Fish and Game; FLNRO= FL Natural Resource Operations;
KBO=Klamath Bird Observatory; MFWP=Montana Department of Fish, Wildlife, and Parks; NDOW=Nevada Department of
Wildlife; OSU = Oregon State University; UDWR=Utah Division of Wildlife Resources; USFWS=U.S. Fish and Wildlife Service;
WGFD=Wyoming Game and Fish Department
d
Only counts for colonies considered part of the western population are provided for Montana and Wyoming, not all colonies statewide.
e At some sites, exact colony location differed minimally from location name due to local water conditions.
f Colony was first established and documented in 2017.
3Figure 2. Relationship between annual rate of change (rt) and breeding pelican abundance (Nt) in the
western pelican population (Moulton et al. 2018). Smaller, more recently established colonies are
experiencing positive growth rates, while larger older established colonies are not.
Strategy is nest counts at breeding colonies. However, because of high variability in nest success, and
the longevity of this species, productivity counts (i.e., counts of pre-fledged young) are also
recommended (Moulton et al. 2018). The Strategy does not include a monitoring component for the non-
breeding segment of the population because it is prohibitively costly to monitor non-breeders, and non-
breeders are difficult to distinguish from breeders using standard monitoring techniques (e.g., aerial
surveys).
Not all monitoring needs pertaining to pelicans and depredation issues are covered by this Strategy. For
example, depredation permits may require documentation of impacts to fish resources, additional
monitoring of local pelican populations, and measuring the effectiveness of management actions.
Guidelines and procedures to address pelican depredation issues are described in the Impact Reduction
Objective in the Management Framework. States and other entities may have research and management
priorities that require additional monitoring and data collection beyond what is included in this Strategy.
These efforts should be conducted as necessary and coordinated within the Pacific Flyway, where
practical. Protocols for additional monitoring efforts are not included within this document.
Goal
The goal of this work is to establish a coordinated, long-term monitoring strategy to estimate the
breeding population size, productivity, trend, and distribution of the western population of pelicans. This
information is fundamental for developing effective management recommendations, and for guiding and
assessing management actions pertaining to pelican depredation of fish resources.
Monitoring Objective
The original 2013 monitoring objective was to be able to detect a 5% change/year in the pelican
population with 80% power (β = 0.20) and a 10% Type I error rate (α = 0.10) in 10 years. At that time,
the NTC determined this level of monitoring was appropriate given the conservation status of pelicans,
4management considerations, and monitoring objectives for other species of similar conservation status.
A revised power analysis (Appendix A) shows a 5% change/year is not possible with 80% power even if
colonies are surveyed annually. The objective has therefore been modified to provide the ability to
detect a 6% change/year with 80% power (β = 0.20) and a 10% Type I error rate (α = 0.10) over a 10-
year period.
Although this modified objective is less stringent than monitoring objectives for other species of greater
conservation concern, it is similar to monitoring standards for seabirds to detect a 50% decline in 10
years (6.7% change/year) with 90% power (β = 0.10) and a 5% Type I error rate (α = 0.05; Hatch 2002).
Commonly used values of α range from 0.001 to 0.10, and β range from 0.01 to 0.20 (Gibbs and Ene
2010). For Breeding Bird Survey and other long-term landbird monitoring programs, Bart et al. (2004)
recommended an accuracy target of 80% power to detect a 50% decline over a 20-year period, using a 2-
tailed test with a significance level of 0.10 and incorporating effects of potential bias into the analysis.
The Program for Regional and International Shorebird Monitoring (PRISM) has a similar monitoring
standard that includes 80% power to detect a 50% decline over a 20-year period using a 2-tailed test and
a significance level of 0.15 (Skagen et al. 2003).
MONITORING STRATEGY
Definition of Terms
Active Breeding Colony — A breeding colony that contains ≥five active nests or 10 breeding individuals
at least one time during the past five years.
Active Nest — A nest that contains a pelican egg(s) or fledgling(s) or with at least one adult in direct
attendance, either incubating or standing directly on a nest.
Breeding Population — The number of individual pelicans nesting in a given year.
Non-breeding Population — The number of individual pelicans that do not nest in a given year.
Productivity — The number of chicks that reach 8-10 weeks of age (pre-fledglings) per active nest in a
given year.
Sampling Approach
Years to Monitor Breeding Colonies — The adjusted monitoring schedule began in 2017: surveys will
occur in two consecutive years, followed by a two year gap for a minimum of 10 years (i.e., through at
least 2026: 2017-18, 2021-22, 2025-26). Ideally, some colonies are surveyed annually; however, the
goal of this Strategy is to conduct a comprehensive standardized monitoring effort of the entire western
population during the years specified. The monitoring interval was based on results from the population
analysis (Moulton et al. 2018) and the power analysis (see below and Appendix A) conducted by the
Idaho Department of Fish and Game. For the power analysis, we evaluated eight temporal sampling
schemes, where monitoring occurred annually, for 3-10 years in a row, and back-to-back years with one,
two, and three year gaps in between (Appendix A). The most cost effective temporal sampling scheme
(i.e., the fewest number of total sampling units) that achieved the monitoring objective was to monitor
back-to-back years with a two year gap in between for a 10-year duration.
5Locations to Monitor — All known breeding colonies within the western population will be monitored
(i.e., a census of known colonies) according to the intervals noted in the Strategy, even if no breeding is
reported for a given year. New breeding colonies will be monitored during the year they are discovered,
when possible, and for the remainder of the Strategy even if no breeding is reported for a given year.
There are currently 21 active pelican breeding colonies in the western population. Summary statistics of
the breeding colonies and the four breeding colony size classes are given in Appendix A, Table A1.
Conducting a census of all breeding colonies will provide the best understanding of pelican population
dynamics. When sampling, it is not possible to determine whether a decrease in abundance at a colony
reflects an actual decrease in the metapopulation, or is potentially complemented by an increase at
another colony. Additionally, since there are few breeding colonies, monitoring all colonies will ensure
the best chance of detecting a population trend. If it is not possible to conduct a census, monitoring
priority should be given to the largest colonies since they have the largest influence on determining
trend.
Timing of Breeding Colony Monitoring — For nest counts, the mid- to late-incubation period is the ideal
time to survey breeding colonies as peak counts occur during this time (Steinkamp et al. 2003, Jones
2008). Pair formation and nest site selection begin soon after arrival of adults to the nesting grounds.
Egg laying starts approximately 4-5 days after nest site selection (Knopf and Evans 2004), and hatching
occurs approximately 30 days after laying (Knopf 1979). Because chicks will fledge and leave the
colony at 10-11 weeks of age (Knopf and Evans 2004), productivity counts should be conducted
approximately 8-10 weeks after the nest count. Suggested monitoring dates for nest counts at breeding
colonies within Pacific Flyway states/provinces are given in Table 2. These dates provide a tentative
guideline but may be subject to change given local or annual environmental and colony conditions.
Table 2. Suggested monitoring dates for Pacific Flyway states/provinces.
Time Period
State/Province Nest Counts Productivity Counts Reference
UT late Apr–mid May late June–mid Jul Knopf 1979
CA and southern OR early May early Jul Shuford and Gardali 2008
NV early–mid May early–mid Jul Wiemeyer et al. 2007
B.C. mid May mid Jul Dunbar 1984
WY mid May–early Jun mid Jul–early Aug Baril et al. 2010
MT late May–early Jun late Jul–early Aug MFWP, unpubl. data
ID late May–early Jun late Jul–early Aug IDFG 2009
WA and northern OR late May–Jun late Jul–early Aug Roby et al. 2012
6MONITORING TECHNIQUES
Overview
Air-, water-, and ground-based techniques can be used to monitor pelicans (Steinkamp et al. 2003, Jones
2008). However, we recommend aerial flights, where photos or videos are taken for subsequent analysis,
over other methods described in this document. If aerial counts are not feasible, within-colony ground
counts are an appropriate alternative. If neither of these methods is feasible, perimeter or boat counts
may be conducted. Aerial counts can be implemented using manned (e.g., fixed-wing or helicopter) or
unmanned (e.g., drone) flights. Although total counts of all colonies should be conducted when possible,
partial counts of colonies may be necessary if access is limited. Conducting multiple counts of a
breeding colony during a monitoring year is strongly recommended to estimate peak abundance and
variability. This is particularly important for large colonies that may have asynchronous sub-colonies, or
for colonies that fail and restart. Note these counts are different than the repeat flights required for some
aerial monitoring methods that seek to separate loafers from breeders. Multiple counts are the best
approach for areas where pelicans nest in vegetation that may hinder detectability. If adults show
evidence of breeding in an area (e.g., carrying food, mating, or distraction displays) but there are no
confirmed active nests or fledglings observed, sites should be revisited at a later date to confirm the
breeding status of the colony. When conducting nest counts, detection probability and sampling variance
should be estimated when possible. This can be achieved in many ways, including the same or different
observer(s) recounting the same location or photograph multiple times, conducting trials to estimate
detection probability for an observer(s) or area(s) and then applying the correction thereafter, or using
double-observer sampling approaches (Nichols et al. 2000, Steinkamp et al. 2003).
Pelicans are sensitive to disturbance, and nest monitoring techniques should be conducted in a manner
that reduces the amount of disturbance to the colony. Adult pelicans can destroy eggs and injure/kill
young nestlings when flushing, and may abandon nests if disturbed repeatedly (BCME 1998, Knopf and
Evans 2004, Jones 2008). Surveyors should be particularly cautious of disturbance in newly established
breeding colonies as pelicans may abandon the area if disturbance levels are too high. Adults should not
be off the nest >10-30 minutes (Jones 2008). Additionally, caution should be exercised when: 1) wind
chill temperature is 80ºF, 3) it is cloudy and air temperature
is >90ºF, 4) it is raining or there is a high probability of rain, 5) egg or chick predators are present and
are able to approach exposed nests, and 6) the majority of the colony is in the nest-building or early
incubation stage (Jones 2008).
There are currently no established protocols for assessing productivity at pelican colonies. Therefore,
only general guidelines for these types of surveys are provided. Efforts are currently underway by
USFWS, Point Blue Conservation Science, and members of the NTC to develop a standardized
productivity protocol framework (Nur, personal communication). Initial analyses indicate that two nest
counts followed by a single pre-fledging count is adequate for assessing productivity. Results of that
effort should guide productivity counts recommended in this Strategy in the future.
Aerial Counts
The current method used to monitor most active breeding colonies within the western population is
counting nests from photographs or video taken during aerial flights, either manned or unmanned. Aerial
photography reduces the amount of disturbance to the breeding colony, and is more accurate than
conducting direct aerial counts as direct aerial counts are highly unreliable. Recommended flight
altitudes are between 150-400m above the colony for manned flights, and 150-250m using unmanned
7aircraft. However, altitudes may need to be adjusted to comply with local regulations or to avoid disturbance to the colony. Manned aircraft — Aerial imagery can either be: 1) a single photo of an entire island or nesting colony, 2) overlapping photos of colonies, or 3) video. When enumerating nests from photographs, ≥2 independent counts of the image should be made. Unless there is site-specific knowledge of the ratio of incubating adults to tending mates and/or loafing birds, counts of adults from aerial photos will be multiplied by 1.5 to derive the number of active nests. If the breeding status of pelicans cannot be determined from aerial photographs, the location should be visited to verify breeding status. Photographs or video shot at an oblique angle (adults can be distinguished from young by leg and bill color) can be used for counts of pre-fledged young. Unmanned aircraft — Using unmanned aircraft (e.g., drones) to survey pelican colonies is a relatively new technique, and standardized protocols are being developed (i.e., Dulava 2016). When planning to use drones for monitoring pelican colonies, close pre-survey coordination is needed with wildlife agencies and the landowner to obtain the required permissions, including Federal Aviation Administration, USFWS (e.g., Special Use Permit, Airborne Hunting Act), and the state wildlife agency. Similar to manned aircraft, aerial photographs taken from drones can either be: 1) a single photo of an entire island, or 2) multiple overlapping photos that are combined to create one image of the nesting area. Initial work indicates that comparison of two images, taken 4-24 hours apart, yields more accurate nest counts than a single photo. Presumably, this would also be the case for photos taken from manned aircraft, but this has not been tested. Similar to manned aircraft, a single image taken at an oblique angle may also be used for assessing productivity. Video footage taken from drones may be used alone as a method to count nests, adults, or young, or as a reinforcement to counts obtained by photographs. Ground Counts If aerial counts are not possible, ground-based monitoring can occur from the perimeter of the colony or within the colony. To improve accuracy, within-colony total nest counts are preferred. However, if within-colony counts are conducted, efforts should be made to reduce disturbance by minimizing noise, the time spent within the colony, and the proportion of the breeding area disturbed. Perimeter Counts — Perimeter counts involve monitoring a colony from survey points on the periphery of a colony. The number and location of survey points depend upon the unique characteristics of each colony. Survey points should be close enough to count individual nests, but far enough away so that individuals do not flush. Survey points should be spaced appropriately to count the maximum number of nests without double counting. To avoid double counting nests, a unique and specific segment of the colony should be surveyed from each survey point. Identifying unique landmarks or distinguishing features within the colony help delineate the survey area for a particular survey point. Perimeter counts should only be conducted when all nests are visible from the perimeter of the colony. Within-Colony Total Counts — Within-colony total counts involve counting all nests within the colony boundary. Counts should be conducted when there are
transect. Each observer uses a clicker and communicates with their neighbor to assure nests are not
missed or double-counted.

Within-Colony Partial Counts — To conduct a partial count, the total area occupied by the colony needs
to be determined first by mapping the colony boundary. A proportion of the total area is sampled using
transects, quadrants (i.e., squares), or circles. When using sampling circles, GPS points within the
colony are first determined. An observer places a pole at that point with an attached piece of string or
rope (10-20m typically). The observer then surveys all nests within the area of the circle created by the
length of the string or rope. Sampling transects, quadrants, or circles should be randomly placed within
the colony, and, if there are known differences in habitat or nest density within the colony, a stratified
random sampling approach is used. The sampled area should encompass 20-40% of the entire colony
and sampled areas should not overlap; 40% is preferred under most circumstances. Once the total
number of nests is determined for the sampled area, these estimates are extrapolated to the remaining
proportion of the colony not sampled to estimate a total colony nest count. Partial counts can also be
used for perimeter, boat, and aerial counts, using the same estimation techniques (i.e., surveying a
known proportion of the colony, then extrapolating those counts to estimate the entire colony).

Boat Counts
Boat counts can be used to monitor colonies proximal to water. If anchoring the boat is possible, colony
counts can be conducted similar to perimeter counts (see above). If breeding is more dispersed, Trocki et
al. (2010) recommended boat speeds of approximately 5 km/h. Boats should be kept at a distance where
safe boat operation is feasible and disturbance to the colony is minimal. Photographs or video can also
be taken from the boat to later determine nest counts.

                                         IMPLEMENTATION

Each state’s NTC member will facilitate reporting and sharing of data with the USFWS. The data sheet
for collecting and reporting data is provided in Appendix B. Data will be housed and managed within
the USFWS Division of Migratory Bird Management Region 1 office. Region 1 will provide status
reports concerning data gathered from this Strategy to the states within the Pacific Flyway, and other
interested entities, while the NTC explores other centralized database options (e.g., Avian Knowledge
Network). The USFWS liaison to the NTC will coordinate interactions between the NTC and the
USFWS. The NTC will periodically review and revise the Strategy, evaluate its effectiveness, and brief
the Pacific Flyway Council on any necessary revisions.

                                                BUDGET

This Strategy leverages existing efforts by states and provinces within the Pacific Flyway to achieve its
objective at the lowest cost. Estimating individual costs per colony for each survey period, however, is
beyond the scope of this document as these values fluctuate over time, and are anticipated to do so
dramatically as new survey methods and technologies (e.g., drones) rapidly mature. The USFWS and
participating states and provinces may choose to incur the total costs of this monitoring, or states may
request an assessment from the Pacific Flyway Council. The NTC, in coordination with the USFWS,
will evaluate the costs for implementing this Strategy one year prior to the next monitoring period and
inform the Pacific Flyway Council on areas where resources are limited.

                                                    9
LITERATURE CITED
Baril, L. M., L. Henry, and D. W. Smith. 2010. Yellowstone Bird Program 2009 Annual Report.
National Park Service, Yellowstone Center for Resources, Yellowstone National Park, Wyoming,
YCR-2010-04.
Bart, J., K. P. Burnham, E. H. Dunn, C. M. Francis, and C. J. Ralph. 2004. Goals and strategies for
estimating trends in landbird abundance. Journal of Wildlife Management 68:611-626.
British Columbia Ministry of Environment (BCME). 1998. Inventory methods for colonial-nesting
freshwater birds: Eared Grebe, Red-necked Grebe, Western Grebe, American White Pelican, and
Great Blue Heron, Version 2.0. March 1998. Ministry of Environment, Lands, and Parks, Species
Inventory Unit, Victoria, B.C. Available at:
http://www.ilmb.gov.bc.ca/risc/pubs/tebiodiv/colonial/assets/colonial.pdf.
Dunbar, D. L. 1984. The breeding ecology and management of White Pelicans at Stum Lake, British
Columbia. Available at: https://open.library.ubc.ca/cIRcle/collections/831/items/1.0095468.
Gibbs, J. P. and E. Ene. 2010. Program Monitor: Estimating the statistical power of ecological
monitoring programs. Version 11.0.0. Available at: www.esf.edu/efb/gibbs/monitor/.
Dulava, S. 2016. Fine-scale change detection using unmanned aircraft systems (UAS) to inform
reproductive biology in nesting waterbirds. MS thesis, Humboldt State University. 63 pp.
Haines, D. E. and K. H. Pollock. 1998. Estimating the number of active and successful Bald Eagle nests:
an application of the dual frame method. Environmental and Ecological Statistics 5:245–256.
Hatch, S. A. 2002. Statistical power for detecting trends with applications to seabird monitoring.
Biological Conservation 111:317–329.
Idaho Department of Fish and Game (IDFG). 2009. Management of American White Pelicans in Idaho:
a five-year plan (2009–2013) to balance American White Pelican and native cutthroat trout
conservation needs and manage impacts to recreational fisheries in southeast Idaho. August 2009.
Jones, S. 2008. Western colonial waterbird survey protocols. U.S. Fish and Wildlife Service, Denver,
CO. Unpublished Report. Available at: https://www.fws.gov/mountain-
prairie/migbirds/species/birds/western_colonial/index.html.
Knopf, F. L. 1979. Spatial and temporal aspects of colonial nesting of White Pelicans. Condor 81:353–
363.
Knopf, F. L. and R. M. Evans. 2004. American White Pelican (Pelecanus erythrorhynchos), The Birds
of North America Online (A. Poole, Ed.). Ithaca: Cornell Lab of Ornithology; Available from the
Birds of North America Online: http://bna.birds.cornell.edu/bna/species/057doi:10.2173/bna.57.
Moulton, C. E., S. B. Roberts, J. S. Horne, and M. Wackenhut. 2018. Changes in abundance,
productivity, and distribution of western American White Pelicans (Pelecanus erythrorhynchos),
1981-2014, in Trends and traditions: Avifaunal change in western North America (W. D. Shuford,
10R. E. Gill, Jr., and C. M. Handel, eds.), Studies of Western Birds 3. Western Field Ornithologists,
Camarillo, CA.
Nichols, J. D., J. E. Hines, J. R. Sauer, F. W. Fallon, J. E. Fallon, and P. J. Heglund. 2000. A double-
observer approach for estimating detection probability and abundance from point counts. Auk
117:393–408.
Pacific Flyway Council. 2012. Pacific Flyway Plan: A Framework for the management of American
White Pelican depredation on fish resources in the Pacific Flyway. Pacific Flyway Council, U.S.
Fish and Wildlife Service, Portland, Oregon. 49 pp.
R Development Core Team (2008). R: A language and environment for statistical computing. R
Foundation for Statistical Computing, Vienna, Austria. ISBN 3-900051-07-0. Available at:
http://www.R-project.org.
Roby, D. R., K. Collins, D. E. Lyons, J. Y. Adkins, P. Loschl, Y. Suzuki, D. Battaglia, T. Marcella, T.
Lawes, A. Peck-Richardson, L. Bayliss, L. Faulquier, D. Harvey, E. Tompkins, J. Tennyson, A.
Evans, N. Hostetter, B. Cramer, M. Hawbecker, R. D. Ledgerwood, and S. Sebring. 2012. Research,
monitoring, and evaluation of avian predation on salmonid smolts in the lower and mid-Columbia
River. Draft 2011 Annual Report to Bonneville Power Administration and U.S. Army Corps of
Engineers, Portland, OR.
Skagen, S., J. Bart, B. Andres, S. Brown, G. Donaldson, B. Harrington, V. Johnston, S. L. Jones, and R.
I. G. Morrison. 2003. Monitoring the shorebirds of North America: towards a unified approach.
Wader Study Group Bulletin 100:102-104. Available at:
https://sora.unm.edu/sites/default/files/journals/iwsgb/v100/p00102-p00104.pdf.
Shuford, W. D. and T. Gardali, Eds. 2008. California Bird Species of Special Concern: a ranked
assessment of species, subspecies, and distinct populations of birds of immediate conservation
concern in California. Studies of Western Birds 1. Western Field Ornithologists, Camarillo,
California, and California Department of Fish and Game, Sacramento.
Steinkamp, M., B. Peterjohn, V. Byrd, H. Carter, and R. Lowe. 2003. Breeding season survey
techniques for seabirds and colonial waterbirds throughout North America. Waterbird Monitoring
Partnership of the Waterbirds for Americas Initiative. Available at:
http://www.waterbirdconservation.org/pubs/PSGManual03.PDF.
Trocki, C., B. Mitchell, and P. Paton. 2010. Coastal breeding bird monitoring protocol for Boston
Harbor Islands National Recreation Area: Northeast Temperate Network. Natural Resource Report
NPS/NETN/NRR-2010/176. National Park Service, Fort Collins, Colorado.
Wiemeyer, S. N., E. C. Murphy, and J. F. Miesner. 2007. Visits to White Pelican nest colonies at night
reduce researcher impacts on nesting success. Northwestern Naturalist 88:129–134.
11APPENDICES
APPENDIX A: Sampling Approach
Summary We recommend a two years on / two years off sampling schedule for all known colonies in
the western population of American White Pelicans through 2026. This approach will have the ability to
detect a 6% / year change rate with a Type I error probability of 0.1 (alpha) and a Type II error
probability of 0.2 (beta). The recommended minimum power remains the same at 0.8 (1-beta). It will
also allow for the analysis of population density-dependence, and aligns well with the frequency for the
proposed productivity protocol framework under development by USFWS and Point Blue Conservation
Science (Nur, personal communication). Our recommended sampling approach also follows the 2013
objective as closely as possible, given the recent population density-dependence analysis done in
conjunction with Moulton et al. (2018) and the revised power analysis detailed below.
Sampling Approach All breeding colonies within the western population will be monitored (i.e., a
census) during a monitoring year. Breeding colonies will be monitored for the duration of the
monitoring strategy, even if no breeding is reported for a given year. New breeding colonies will be
monitored during the year they are discovered and for the remainder of the monitoring strategy, even if
no breeding is reported for a given year.
Conducting a census of all breeding colonies will provide the best understanding of pelican population
dynamics. When sampling, it is not possible to determine whether a decrease in abundance at a colony
reflects an actual decrease in the metapopulation or is complemented by an increase at an unmonitored
colony. Since there are few breeding colonies, monitoring all colonies will ensure the best chance of
detecting a population trend. If it is not possible to conduct a census, monitoring priority should be given
to the largest colonies since they have the largest influence on determining trend. Pelican use of
breeding locations is relatively stable, and new breeding colonies are typically found and reported with a
high degree of certainty without organized monitoring efforts. A completely randomized, dual-frame
(Haines and Pollock 1998), or similar sampling approach was not considered to be necessary or cost-
effective since there is minimal colony turnover and little need to devote a large amount of monitoring
effort to discover new breeding colonies.
Summary Statistics and Description of the Western Population At the time of the analysis, there were
21 active pelican breeding colonies in the western population. The two largest colonies, Gunnison Island
WMA, Utah and Anaho Island NWR, Nevada, comprise approximately 55% of the western population.
The seven largest colonies comprise 90% of the western population (Table A1).
Colonies were stratified into four size classes (>6,000, 5,999-2,000, 1,999-300, and 299-10 breeding
individuals) based on suspected differences in colony dynamics. Colony data from the last 10 annual
counts were used to calculate the mean number of breeding pairs and percent coefficient of variation of
the number of breeding pairs for the four size classes (i.e., strata; Table A1). These summary statistics
were used in the power analysis (see below). Monitoring recommendations may need to be adjusted if
these values change substantially in the future. For example, if the percent coefficient of variation values
increase, a greater number of sampling units will be needed to achieve the desired management
objective.
Power Analysis An initial power analysis was conducted in support of the 2013 Strategy using
Program R (R Development Core Team 2008) and Program Monitor (Gibbs and Ene 2010) to identify
the most cost effective sampling scheme (i.e., fewest number of total sampling units) that achieved the
monitoring objective. The original monitoring objective was to have the ability to detect a 5%
12change/year in the western population of pelicans with 80% power (β = 0.20) and a 10% Type I error
rate (α = 0.10). Nine temporal schemes were assessed, where monitoring of the 18 known breeding
colonies occurred every year, every other year, or every third year for 3, 5, 7, and 9/10 years in duration.
Details of this analysis are provided in the 2013 Monitoring Strategy.
Subsequent attempts to replicate the work in advance of this 2018 revision revealed that not all colony
data had been included in the original analysis. Specifically, many valid zero counts had inadvertently
been omitted, thus artificially reducing the coefficient of variation used to determine power. When the
full data set was used to determine appropriate coefficients of variation, the initial monitoring objective
was revealed to be overly optimistic (Table A2, Fig. A1). The revised power analysis, which replicated
the 2013 analysis approach (E. Roche, unpublished analysis; R Core Team 2018), indicated that the
original monitoring objective of detecting a 5% change/year was not possible to obtain, even if all
colonies were monitored every year (Table A2). This finding necessitated a change in monitoring
objective, from being able to detect a 5% change/year to being able to detect a 6% change/year.
Results from Power Analysis The power to detect trend increases as the number of years, duration of
years, and trend values increased (Table A2; Fig. A1). Monitoring >9 years in duration will most likely
be necessary to ensure detection of a 6% annual trend with approximately 80% power (Table A2; Fig.
A1). Shorter durations may be sufficient if trend values are greater than 6%. Several monitoring
schemes achieved the objective, but a two years on / two years off for a 10-year duration survey
schedule met the revised monitoring objective for the least cost. Power estimates to detect a 6% trend
were higher with more intensive monitoring, but the total number of units sampled was much greater
(Table A2; Fig. A1).
Monitoring Recommendation from Power Analysis The most cost effective sampling scheme that will
achieve the revised monitoring objective is to monitor two-years on / two-years off for 10 years,
beginning in 2017 (i.e., 2017-18, 2021-22, 2025-26).
13Table A1. Pelican breeding colony summary statistics and input values for the power analysis. Percent
coefficient of variation (% CV) was calculated using the last 10 available annual counts through 2016.
For colonies without available annual count data, the number of breeding individuals from the most
recent survey was reported and no percent coefficient of variation estimate was given.
Colony Size Total Count
# of Colonies Mean Colony Size % of Total
(Breeding (Breeding
in Size Class (Breeding Individuals) Population
Individuals) % CV Individuals)
>6,000 2 11,278 33% 22,557 55%
5,999-2,000 5 2,896 43% 14,482 35%
1,999-300 5 619 85% 3,094 8%
299-0 6 185 89% 1,108 3%
TOTAL 18 41,240 100%
Mean Colony Size
Colony (Breeding Individuals)
% CV
Gunnison Island WMA 11,454 24%
Anaho Island NWR 11,102 41%
Canyon Ferry Lake 4,067 23%
Clear Lake NWR 2,170 88%
Minidoka NWR 3,410 29%
Blackfoot Reservoir 2,097 44%
Badger Island, McNary NWR 2,738 30%
Molly Lake, Yellowstone NP 815 34%
Lower Klamath NWR 194 107%
Stum Lake 836 23%
Malheur NWR 406 163%
Arod Lake 575 121%
Island Park Reservoir 462 -
Crump Lake 200 -
Pelican Lake 177 -
Miller Sand Spit 268 -
Upper Klamath NWR 269 71%
Ruby Lake NWR 0 -
14Table A2. Projected power of five sampling approaches and schedules. For comparability with the 2013 analysis, all approaches were
assessed using the same distribution of colony sizes (Table A1), but using all available data through 2016. Note the 2013 monitoring
schedule, No. 2 (grey shading), could not meet the original monitoring objective of detecting a 5% change/year trend, with 80% power.
Sampling approach No. 4, a two-years on / two years off sampling schedule with 6 sampling events per 10 years, achieves the desired
minimum 80% power to detect a 6% change/year trend with the least effort and is the 2018 recommendation (blue shading). All sampling
approaches meeting the 80% minimum power are bolded.
Number of Units Sampled in Each Size Class Power to Detect a 1-15% Change/Year
Per Monitoring Year Trend in 10 years
Years Monitored
1,999-
>6,000 5,999-2,000 299-10 Effort / Total Units
No 0 1 2 3 4 5 6 7 8 9 Survey Approach 300 1% 5% 6% 7% 10% 15%
(100%) (100%) (100%) 10 Yrs Sampled1
(100%)
1 ● ● ● ● ● ● ● ● ● ● Every year 2 5 5 6 10 180 0.20 0.76 0.84 0.91 0.98 1.00
2 ● ● ● ● One on, Two off 2 5 5 6 4 72 0.28 0.66 0.72 0.76 0.90 0.96
3 ● ● ● ● ● ● ● Two on, One off 2 5 5 6 7 126 0.22 0.71 0.81 0.88 0.97 1.00
4 ● ● ● ● ● ● Two on, Two off 2 5 5 6 6 108 0.22 0.73 0.81 0.88 0.97 1.00
5 ● ● ● ● Two on, Three off 2 5 5 6 4 72 0.26 0.54 0.60 0.69 0.84 0.94
1
Currently there are 18 known colonies (units); each is sampled in a survey year. Survey effort is (number years sampled per decade)*(number colonies) = total sampled
units; e.g., the survey effort for the “Every year” approach is 10*18=180.
15Figure A1. Plot of projected power for five evaluated sampling approaches (numbering from Table A1). Approaches No.1, 3, and 4 are all
able to detect a 6%/year trend in 10 years’ time, but No. 4 does so with the least amount of effort.
16APPENDIX B: 2018 Data Sheet and Instructions
17Instructions
Use one data sheet per colony.
For counts taken outside of a colony, or by aerial photo, it is recommended that multiple counts of active
nests be taken. This may be done simultaneously by multiple observers or in two consecutive counts by one
observer. This will account for observer error.
When counting from within a colony, only one count is necessary and should be completed in a methodical
but timely fashion to minimize disturbance to the birds.
Counts of all adults and chicks can be taken as time allows. When cormorants or pelicans are nesting in
vegetation these counts provide additional helpful information if all nests are not visible.
Fill out the datasheet as completely as possible. If a GPS unit is not available, UTM coordinates can be
obtained using Google Earth or ArcGIS.
Datasheet Definitions
General Information:
o Time: start and end time, record in military format 0000-2400
o Status: Active = Breeding (nest building, courtship, incubation, eggs, or chicks observed)
Inactive = Non-breeding (no active nests, eggs, or chicks),
If the majority of birds are only engaging in nest building and courtship, the colony should be
visited again in a few weeks since the goal is to count the colony close to peak incubation.
Make note if you suspect the site is a roost site and not a breeding colony.
Survey Information:
o Survey Method/Vantage Point
Perimeter: count taken from the ground near the colony
Boat: count taken from the water near the colony
Aerial photo: count taken on aerial photos captured on a survey flight
Direct aerial: count taken by an observer on a survey flight
Within-colony: count taken from the ground inside the colony
o Survey Type
Full (complete) survey: all of the colony was visible and counted
Partial survey: colony was too large or not 100% visible, so a sample was counted.
% of colony counted: estimate the % of the colony that was visible and could be counted. If
less than 100% was counted, explain why in the notes (ex. Birds could be seen entering
vegetation but nests were obscured, or Colony was too large so a portion was sampled).
o Vantage Point Description (for counts conducted outside of the colony)
Vantage Location (UTMs): UTMs can be obtained in Google Earth if no GPS is available
Distance from colony (meters): record in meters if observing from the ground or a boat,
record in meters above ground level if observing from an aircraft
Vantage location description: brief description of observation location (ex: south bank of the
river SE of the colony)
Count Information
o Survey Target: N = Nest/Breeding Pair Count (required survey for this Strategy)
P = Productivity Count (recommended survey for pre-fledglings)
o Nests: Only active nests (i.e., attended by one or more adults or nests that contain eggs or young
chicks) should be counted. Do not include empty nests.
18 As most pelican colonies have a wide range of nest initiation dates, and chicks leave the nest
within a few weeks, counts may be a combination of nests with eggs or young chicks and
larger “creched” chicks found outside of a nest. One creched chick not directly associated
with a nest may be considered to equal one nest. If creched chicks are included in the active
nest total, please indicate this in the ‘Notes’ column, and include the # of creched chicks
counted in the ‘# Young’ column.
o Adults: If the ‘Nests’ count reflects a count of adults attending nests, as opposed to a direct count of
nests with eggs or chicks, please record the # of adults counted here.
o Young: If the colony is visited when some chicks have already creched, or the entire colony has
already left their nests (e.g. approaching fledging), record the number of chicks on the colony NOT
associated with a nest. The ‘Nests’ and ‘Young’ columns should both be filled out ONLY during
nest/breeding pair counts when there are still eggs or young in nests. If all young have left the nest,
the ‘Nests’ field should be left blank.
o Estimated Breeding Pairs: This field should reflect the total number of nests/pairs observed during a
nest/breeding pair count. This can be the sum of ‘Nests’ and ‘Young’ or an ‘Adult’ count corrected
by either multiplying the total number in the ‘Adult’ column by 1.5, or by using a locally-derived
corrected factor that accounts for ratio of adults present on a colony to the number of nests they
represent.
o Estimated Young Produced: If the ‘Young’ field is a total pre-fledgling count, these two fields
should be identical. If the ‘Young’ count is a sample of the total count, this field can be used for a
locally-derived corrected estimate of young produced.
19You can also read