Melekeok Conservation Network In Situ Water Quality Monitoring Report Palau - Pacific R2R
←
→
Page content transcription
If your browser does not render page correctly, please read the page content below

Melekeok Conservation Network In Situ
                         Water Quality Monitoring Report Palau

Melekeok Conservation Network
In Situ Water Quality Monitoring Report
Palau

                                                                 1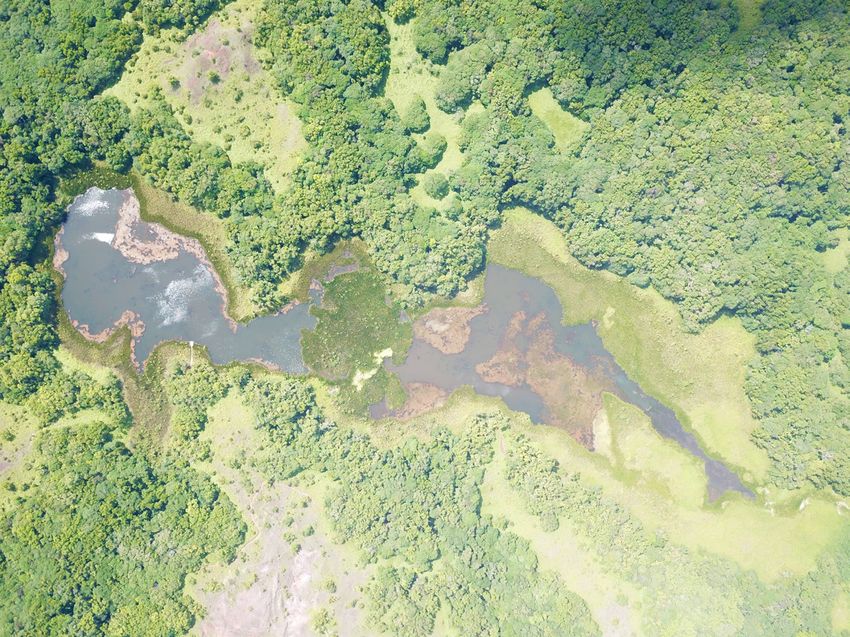
Melekeok Conservation Network
In Situ Water Quality Monitoring Report
                 Palau
                           By Leena M Mesebeluu
        Ministry of Natural Resources, Environment, & Tourism, Palau
                                 April 2021

 Produced by GEF Pacific International Waters Ridge to Reef Regional Project,
                    Pacific Community (SPC), Suva, Fiji

                               Suva, Fiji, 2021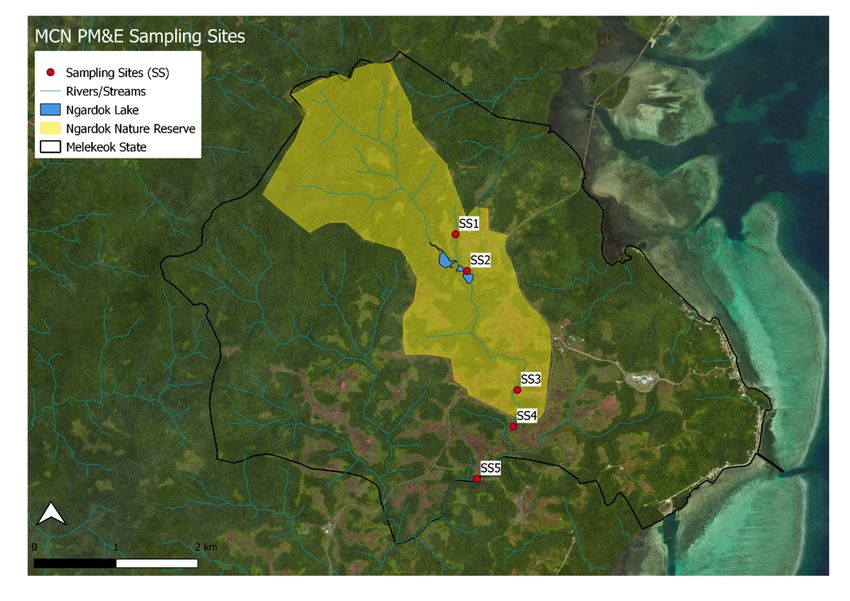
© Pacific Community (SPC) 2021
       All rights for commercial/for profit reproduction or translation, in any form, reserved.
         SPC authorises the partial reproduction or translation of this material for scientific,
         educational or research purposes, provided that SPC and the source document are
    properly acknowledged. Permission to reproduce the document and/or translate in whole,
    in any form, whether for commercial/for profit or non-profit purposes, must be requested
        in writing. Original SPC artwork may not be altered or separately published without
                                              permission.

                                        Original text: English

Citation: Mesebeluu, L. (2021) Melekeok Conservation Network In Situ Water Quality Monitoring
Report Palau. Suva, Fiji SPC, 33pp

Reviewed by: Jade Delevaux, George Naboutuiloma, Samasoni Sauni and Fononga Vainga Mangisi-
Mafileo.

Editorial and writing support: Seema Deo (Footprints in the Sand Consulting)

Layout and Design by Navneet Lal / Pacific Community (SPC)

           Produced by GEF Pacific International Waters Ridge to Reef Regional Project,
                              Pacific Community (SPC), Suva, Fiji

      Prepared for publication at SPC’s Suva Regional Office, Private Mail Bag, Suva, Fiji, 2021
                                     www.spc.int | spc@spc.int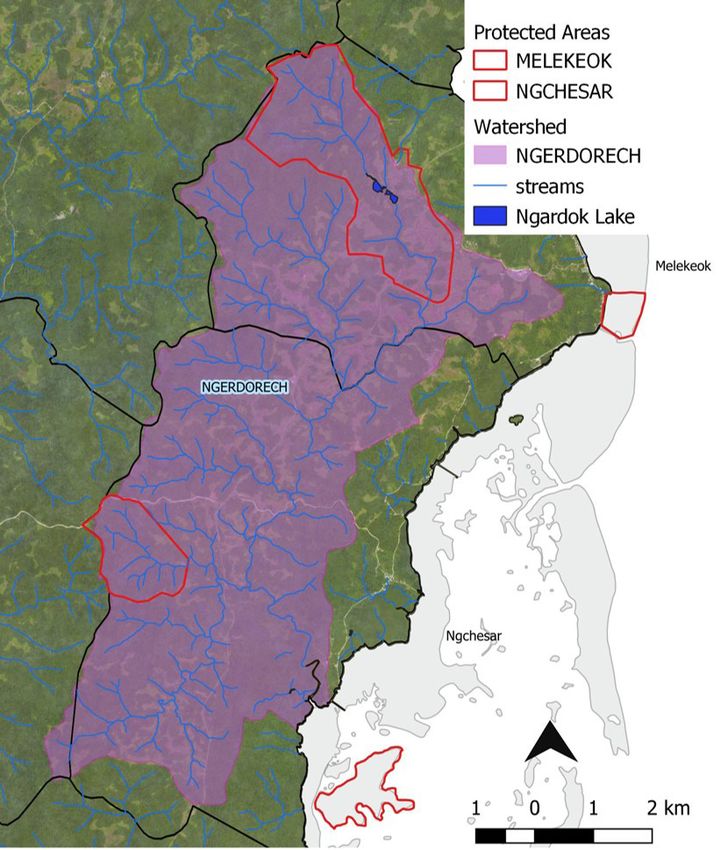
Melekeok Conservation Network In Situ
                                                                                                                                Water Quality Monitoring Report Palau

CONTENTS
Abbreviations................................................................................................................................ iv
List of Tables................................................................................................................................... v
List of Figures................................................................................................................................. v
Executive Summary........................................................................................................................ 1
1. Background................................................................................................................................ 1
2. Introduction............................................................................................................................... 3
3. Monitoring Approach................................................................................................................. 4
   3.1 Safety..................................................................................................................................................................4
   3.2 Water Quality Parameters..................................................................................................................................4
   3.3 Planning Meeting................................................................................................................................................6
   3.4 Site Selections.....................................................................................................................................................6
   3.5 Classroom Session..............................................................................................................................................7
   3.6 Equipment Training.............................................................................................................................................7
4. Implementation.......................................................................................................................... 8
   4.1 Sampling Location...............................................................................................................................................8
   4.2 Fieldwork..........................................................................................................................................................10
   4.3 Visit to a Certified Water Quality Lab in Guam.................................................................................................10
   4.4 Handover and Post 1 Year Fieldwork................................................................................................................11
5. Results...................................................................................................................................... 12
   5.1 Comparing Selected Parameters.......................................................................................................................12
   5.2 Comparing Nutrients between Sites.................................................................................................................12
   5.3 Water Level at SS3............................................................................................................................................13
6. Discussion................................................................................................................................. 14
   6.1 Water Quality Monitoring.................................................................................................................................14
   6.2 Preliminary Results...........................................................................................................................................14
   6.3 Future Prospects...............................................................................................................................................15
7. Conclusions.............................................................................................................................. 15
References.................................................................................................................................... 17
Appendices................................................................................................................................... 18
   Appendix 1: Safety..................................................................................................................................................18
       1. Field Safety.....................................................................................................................................................18
       2. Chemical Safety..............................................................................................................................................18
       3. Field Considerations.......................................................................................................................................18
   Appendix 2: Workplan............................................................................................................................................19
   Appendix 3: Maps and Site Photos.........................................................................................................................20
   Appendix 4: Nutrients.............................................................................................................................................24
   Appendix 5: Monitoring from September 2018 to September 2019......................................................................29
   Appendix 6: Water Depth at Ngeokib (Dam)..........................................................................................................32
   Appendix 7: Water Shortage Advisory....................................................................................................................33

                                                                                                                                                                                   iii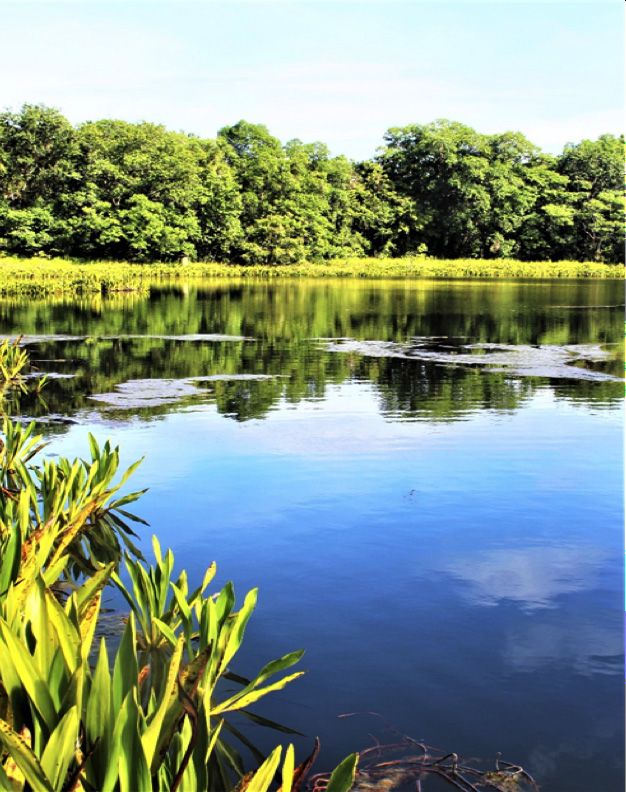
ABBREVIATIONS
     BWA		      Belau Watershed Alliance
     DO 		      Dissolved Oxygen
     EQPB		     Environmental Quality Protection Board
     FNU 		     Formazin Nephelometric Units
     GEF		      Global Environment Facility
     ICM		      Integrated Coastal Management
     IW		       International Waters
     IW R2R		   International Waters Ridge to Reef Project
     MCN		      Melekeok Conservation Network
     MNRET      Ministry of Natural Resources Environment and Tourism
     NNR		      Ngardok Nature Reserve
     NTU 		     Nephelometric Turbidity Units
     PAN 		     Protected Area Network
     SPC		      Pacific Community
     USGS 		    United States Geological Survey
     WERI		     Water and Environmental Research Institute
     YSI 		     Yellow Springs Instruments

iv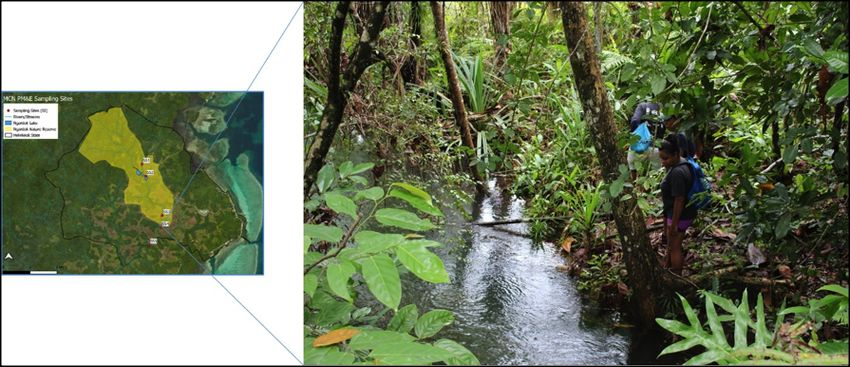
Melekeok Conservation Network In Situ
                                                                                                   Water Quality Monitoring Report Palau

LIST OF TABLES
Table 1. Water Quality Parameters................................................................................................. 4
Table 2. Locations and Descriptions of Monitoring Sites................................................................ 9

LIST OF FIGURES
Figure 1. (a) Ngerdorech Watershed. (b) Ngardok Lake.................................................................. 2
Figure 2. Southside of Ngardok Lake looking towards visitors’ floating dock................................. 3
Figure 3 Initial Planning Meeting held at Ngardok Nature Reserve Office...................................... 6
Figure 4 Site Selection Field Day..................................................................................................... 6
Figure 5 Classroom Session at MNRET Ngerulmud Office............................................................... 7
Figure 6. Equipment training at Euall.............................................................................................. 7
Figure 7. Map of Monitoring Sites................................................................................................... 8
Figure 8. Ms. Oberang Antonio conducting fieldwork and sample analyses................................ 10
Figure 9. Water Quality Team visit to WERI.................................................................................. 10
Figure 10. Handover Ceremony with MCN Board and Staff.......................................................... 11
Figure 11. Comparing Selected Parameters.................................................................................. 12
Figure 12. Comparing Nutrients between Sites............................................................................ 13
Figure 13. Showing water depths over the duration of sampling Sep-2018 till Sep-2019............ 13

                                                                                                                                           v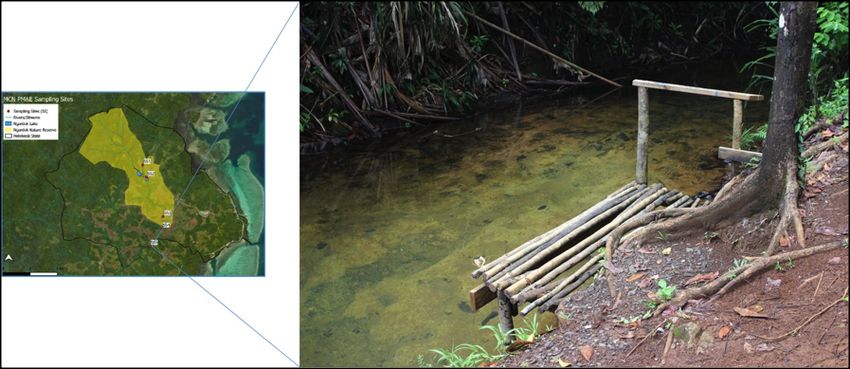
Lake Ngardok
     Babeldaob, Melekeok

vi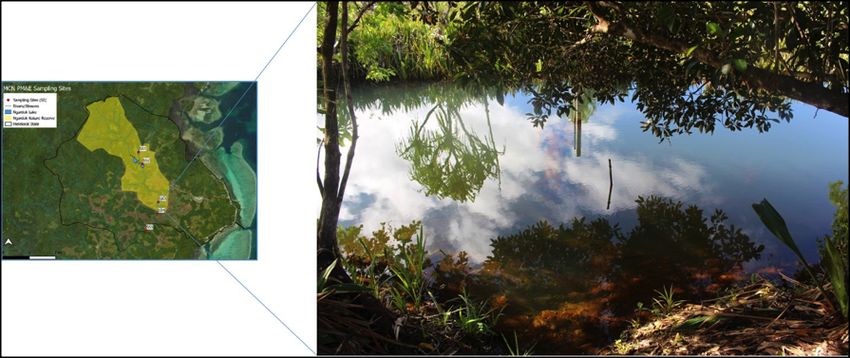
Melekeok Conservation Network In Situ
                                                                          Water Quality Monitoring Report Palau

EXECUTIVE SUMMARY
A partnership between the Palau International Waters Ridge to Reef (IW R2R) project, the Ministry
of Natural Resources, Environment and Tourism and the Melekeok Conservation Network (MCN)
enabled a one-year water quality monitoring at the Ngardok Nature Reserve (NNR). The Pacific
Community (SPC) Regional Programme Coordination Unit purchased the water quality test kits to
assist with the water quality monitoring work. The monitoring included classroom-type sessions, site
visits and field work. At the end of monitoring and field work, the test kits were handed over to MCN.

The NNR water quality monitoring programme delivered on the following outputs:

 •   Achieved the outcomes of Palau IW R2R demonstration project for increased local
     community and agency capacity in water quality monitoring and improved data collection
     for the development of a national catchment management plan for the participating
     Belau Watershed Alliance (BWA) states;
 •   Achieved goals for the NNR in providing research opportunities and capacity building for
     local researchers;
 •   Trained two MCN staff in water quality monitoring; and
 •   Collected a year’s worth of in situ water quality data and established a water quality
     programme for MCN.
Preliminary results from the in-situ water quality monitoring offered the following observations:

 •   Physical water properties vary slightly for dry and rainy months;
 •   Overall low levels of nutrients at the sites;
 •   Higher levels of Nitrate and Nitrite at sites located outside the protected area;
 •   Conductivity increased at all sites during the dry season;
 •   Stream levels correspond with rainfall;
 •   Ongoing monitoring is needed to validate trends and inform or complement current
     rehabilitation and restoration efforts at the NNR; and
 •   An existing need to improve the water quality monitoring if a water quality programme
     were to be established.

                                                                                                                  1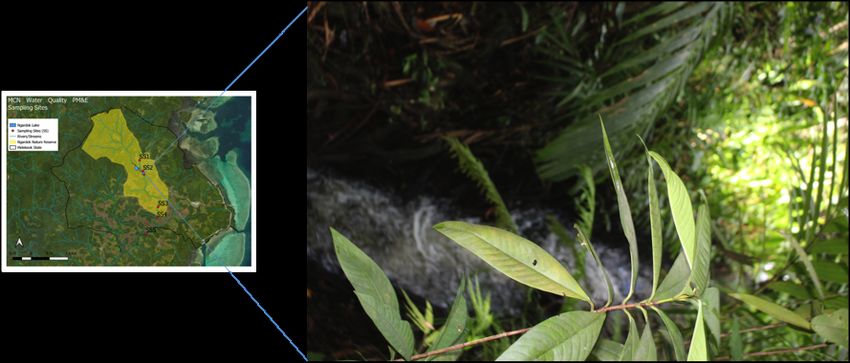
1. BACKGROUND
The Melekeok State Government through Melekeok State Public Law 4-32, which was enacted in
1997 and updated in 2010, created the Melekeok State Conservation Network (MCN). MCN includes
the Ngardok Nature Reserve (NNR) and Ngermedelim Marine Sanctuary. MCN has a management
plan which is currently used for managing the two protected areas. MCN has eight employees, all of
whom live in Melekeok State and who are active members of the Melekeok Community.
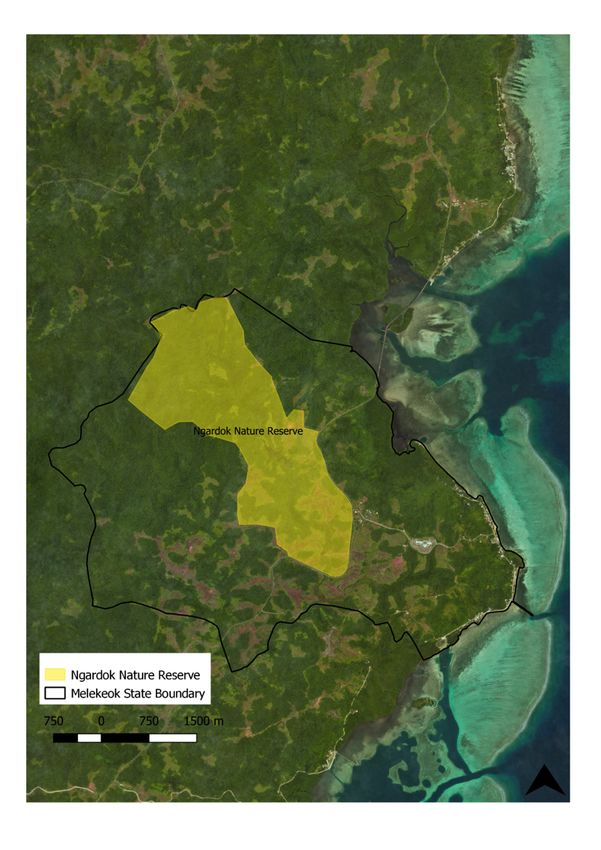
Ngardok Lake is the largest freshwater lake in Palau and the Micronesia region. The lake is Palau’s only
wetland to be designated as a Wetland of International Significance under the Ramsar Convention
on Wetlands. Ngardok Lake is an important component of the Ngerdorech watershed as the lake and
its tributaries are the headwaters for the watershed. Ngardok Lake and its surrounding forest are a
habitat for the endemic biib (Ptilinopus pelewensis), ius (Crocodylus porosus), and newly discovered
kesiamel (Osmoxylon ngardokense). Ngardok Lake is important to the Melekeok State community
as the lake and its tributaries flow to the Melekeok Dam. This dam provides water to the national
capital of Palau and the Melekeok State’s 277 residents.
Figure 1. (a) Ngerdorech Watershed. (b) Ngardok Lake.
The Palau Environment Quality Protection Board (EQPB) monitors piped water in Melekeok monthly.
A 1996 United States Geological Survey (USGS) study remains the most comprehensive water quality
study available for Ngardok Lake. To date, no water quality study has been conducted across the
Ngerdorech Watershed in Melekeok State.
The goals of the NNR include clean and abundant water, maintaining the ecological integrity of
Ngardok Lake, and providing research opportunities. Current interventions to meet these include
soil and forest rehabilitation, establishing best management practices, and surveillance.
MCN, through its valuable partners has developed robust techniques for monitoring terrestrial and
marine flora and fauna. The need was identified for training of staff on water quality monitoring
to enable the commencement of a water quality programme for MCN. The first of its kind, the
one-year water quality work conducted by the International Waters Ridge to Reef Project (IW R2R)
implemented by the Ministry of Natural Resources, Environment and Tourism ((MNRET) achieves
the goals for NNR set out in the MCN plan.
2Melekeok Conservation Network In Situ
Water Quality Monitoring Report Palau
2. INTRODUCTION
The MCN recognises the importance of water quality. The MCN management plan states specific
goals for the Ngardok Nature Reserve, which include ensuring clean and abundant water to meet
the needs of Melekeok State; maintaining the ecological integrity of Lake Ngardok and its natural
habitats; and providing opportunities for research on the organisms and natural systems within the
watersheds as well as the connected systems in the surrounding area.
Activities to meet these goals have centred around reforestation and education/outreach. No
activities have been previously undertaken for continuous water quality monitoring. Water quality
studies have been conducted either by visiting scientists or at one-time data collection.
The outcomes of Palau’s IW R2R project, implemented by the MNRET, calls for increased local
community and agency capacity for water quality monitoring and improved data collection for the
development of a national catchment plan for the participating Belau Watershed Alliance (BWA)
states. Component 1 of the Regional IW R2R programme provides national demonstration support
for R2R integrated coastal management and integrated water resource management (ICM/IWRM)
approaches such as through the procurement of water quality monitoring equipment.
To elevate staff capacity and implementing activities in their management plan, MCN partnered
with the IW R2R demonstration project implemented by MNRET to assist in the creation of a water
quality programme, a first for MCN.
The purpose of undertaking water quality monitoring in the NNR and the broader catchment is
to collect the necessary data and information to establish or review baseline indicators towards
understanding the current state of priority environmental threats caused by municipal waste
pollution, land use activities and natural disasters, including climate change. The results would assist
with future coordinated water quality monitoring of the NNR and broader catchment area, and most
importantly, inform future sustainable conservation and resource use of natural resources including
upscaling R2R investments and ICM planning.
This report provides a snapshot of the monitoring approach, initiation and implementation, results,
and discusses how to further improve MCN water monitoring capability. It is envisioned that this
report will be annexed to the next update of the MCN management plan.
Figure 2. Southside of Ngardok Lake looking towards visitors’ floating dock.
33. MONITORING APPROACH
3.1 Safety
As with any activity undertaken by the MCN, the utmost priority is for safety. Safety measures
(Appendix 1). were adopted from the Waterwatch Victoria Methods Manual and are also outlined
in the MCN Management Plan.
3.2 Water Quality Parameters
Limited water quality testing and funding availability means most water samples are sent off-island
for analysis. MCN thus, chose to conduct its water quality monitoring in situ. It is acknowledged that
in situ results may not be as accurate as certified laboratory analysis, however, in situ results provide
estimates that can be verified against laboratory standard methods in the future.
With assistance of the IW R2R Regional Programme Coordination Unit, a YSI multiparameter
multiprobe and a photometer were purchased. Table 1 outlines the parameters and EQPB acceptable
levels. Parameters were chosen based on the 1996 USGS study and considering what the available
monitoring instruments can measure. [with limitation to the water quality parameters available to
the monitoring instruments.]
Table 1. Water Quality Parameters
Parameters Description and EQPB Acceptable Sampling Method Collection
Levels
Temperature (°F) Important role in health and quality of YSI multiprobe Sample main
a water body. Temperature affects bio- current
logical, chemical, and physical features
of a river.
Temperature shall not vary by more
than 1.5-degree Fahrenheit (EQPB
2015)
Dissolved Oxygen Measure of how much oxygen is dis- YSI multiprobe Sample main
(mg/L) solved in water. current
DO concentrations shall not vary by
more than 25% from natural conditions
(EQPB 2015)
Conductivity (µS/ Ability of water to carry an electric YSI multiprobe Sample main
cm) current. Used as an indicator of salinity current
and concentrations of dissolved salts in
a water body
pH Measure of how acidic or basic water YSI multiprobe Sample main
is. A pH of 7 is called neutral, above 7 is current
basic (alkaline), and below 7 acidic.
pH variation shall not be greater than
0.2 pH units from natural conditions;
but not lower than a pH of 6.5 or
higher than a pH of 8.5 from other than
natural (EQPB 2015)
Total Dissolved Sum of all the substances, organic and YSI multiprobe Sample main
Solids (mg/L) inorganic, dissolved in water. current
4Melekeok Conservation Network In Situ
Water Quality Monitoring Report Palau
Parameters Description and EQPB Acceptable Sampling Method Collection
Levels
Turbidity (FNU) Measure or absence of soluble, sus- YSI multiprobe Sample main
pended particles that hinder the trans- current
mission of natural light at the surface
to the lower depths. Turbidity affects
the potential rate of photosynthesis,
growth of plant or algae in a water
body.
Turbidity shall not be greater than 5%
above natural conditions (EQPB 2015)
*FNU and NTU comparable, no con-
version of data values necessary if YSI
instrumentation is used to collect data
Ammonia (mg/L Occurs as breakdown product of nitrog- YSI 9300 Photometer Sample main
N) enous material in natural waters. current
Nitrate (mg/L N) Present in natural water. Enter water YSI 9300 Photometer Sample main
bodies through natural vegetation current
breakdown or using chemical fertilizer
or sewage effluent.
Nitrite (mg/L N) Found in natural waters and are prod- YSI 9300 Photometer Sample main
uct in the nitrogen cycle. Harmful to current
fish and aquatic life.
Phosphate Used in detergents. Fertilisers can YSI 9300 Photometer Sample main
contain phosphate; phosphate can also current
come from breakdown of plant and
animal waste.
Dam Water Level Possible context to Water Quality and Visual Survey Water
surroundings Meter in Dam
Presence and Type Possible context to Water Quality and Visual Survey
of Rubbish surroundings
Weather Possible context to Water Quality and General Observation
surroundings
53.3 Planning Meeting
An initial planning meeting introduced the IW R2R project and highlighted the objectives of MCN
and IW R2R relating to water quality. MCN staff proposed three sampling locations to monitor water
quality based on the 1996 USGS study on Ngardok Lake, the flow of the Ngerdorech River, land use
and safety.
A monitoring workplan was discussed and agreed upon (Appendix 2). It was decided that the sites
chosen would be monitored at least twice a month for the full year. The water quality team includes
the IW R2R project manager, MCN Conservation Officer and an MCN Ranger. It was noted that other
staff may assist if required.
Figure 3 Initial Planning Meeting held at Ngardok Nature Reserve Office
3.4 Site Selections
As a follow up to the planning meeting, the water quality monitoring team met to scout and plot the
proposed monitoring sampling sites. Initially, in the planning meeting, three sites located in the NNR
reserve were selected, however during the scouting, MCN staff took the initiative and proposed two
additional sites outside NNR following the downward direction of the Ngerdorech River. Section 4.1
of this report describes each of the sampling locations.
Figure 4 Site Selection Field Day
6Melekeok Conservation Network In Situ
Water Quality Monitoring Report Palau
3.5 Classroom Session
A day-long classroom session activity was organised for MCN. Topics discussed in this activity
included:
• Water cycle and watersheds
• Concepts of water quality
• Water quality parameters
• Land use
• Climate Change effects on weather
patterns
• Sampling Protocol to be used
MCN staff were able to share their
observations of NNR noting that some
streams are perennial while others are
intermittent and dry during summer Figure 5. Classroom Session at MNRET Ngerulmud Office
months.
Two additional classroom sessions were provided throughout the monitoring as refreshers to the
team.
3.6 Equipment Training
Prior to monitoring, the team went to one of the sampling sites to demonstrate and test in situ
sampling procedures. Tasks for the training included:
• Training on sampling protocol:
equipment, field gear, data
sheets, storage, preservation, and
transport of samples.
• Downloading data from the YSI
multiparameter multiprobe.
• Analysing samples using the YSI
Photometer.
• Basic quality assurance and quality
control requirements for water
quality when in the field based on
ISO17025; 2017.
Figure 6. Equipment training at Euall
• Disposal of used chemicals.
• Importance of instrument
calibration.
74. IMPLEMENTATION
4.1 Sampling Location
Sampling locations (Figure 7) include:
• (SS1) the bridge on the way to the lake;
• (SS2) the dock at the lake;
• (SS3) Ngeokib (Melekeok Water Dam);
• (SS4) Ngerkoranges;
• (SS5) Euall.
Appendix 3 contains a larger version of the map and site photos. Table 2 describes sampling site
locations.
Figure 7. Map of Monitoring Sites
8Melekeok Conservation Network In Situ
Water Quality Monitoring Report Palau
Table 2. Locations and Descriptions of Monitoring Sites
Site ID Location Palauan MCN Activities Land Use Other
Name
SS1 7.51643°N None Bird monitoring Ngardok Nature No stream flow during
134.60338°E Reserve dry season
Erosion control
and reforestation Stream passes Stream depth less
through a wooden than 1m
bridge. Stream reach ~ 1m
Soil type: Aimeliik Silt
Loam, bedded tuff
substratum,
12 to 30 percent
slopes
SS2 7.51242°N Ngardok Bird monitoring Ngardok Nature Ngardok Lake
134.60461°E Reserve
Erosion control Surface area of lake
and reforestation 0.09 km2
Floating dock for visi-
tors to lake
Soil type: Dechel, Silt
Clay, 0 to 2 percent
slopes
SS3 7.49888°N Ngeokib Fire Monitoring Ngardok Nature Shallow Stream ~10 m
134.60988°E Reserve Stream reach 5m
Erosion control
and reforestation Melekeok Water Soil type: Dechel, Silt
Dam Clay, 0 to 2 percent
slopes
SS4 7.49522°N Ngerkor- Fire Monitoring Farming activities Stream Depth ~ 12m
134.60983°E anges Stream reach ~6m
Recreation Area
Soil type: Dechel, Silt
Stream passes Clay, 0 to 2 percent
through Compact slopes
Road
SS5 7.48944°N Euall None Farming activities Stream Depth ~ 9m
134.60580°E Recreation Area Stream Reach ~7m
Stream pass- Soil type: Aimeliik Silt
es through old Loam, 30 to 50 per-
Melekeok Road cent slopes
94.2 Fieldwork
Monitoring occurred twice a month from September 2018 to September 2019. The lake and its
corresponding streams are not uniform in depth and width. For the YSI multiprobe, sampling locations
were sampled mid-depth except for site 1, which is a shallow stream. For nutrients, samples were
obtained by immersing a hand-held open bottle with the mouth of the bottle directed towards the
current.
Nutrient samples were obtained and analysed the same day (taken in the morning and analysed by
noon) at the NNR Field office. Field blanks and nutrient samples collected were prepared based on
YSI 9300 Photometer manual instructions.
Water level measurements were recorded at SS3 as a water level stick was present on the site.
Fieldwork data is provided in the appendices. Water levels were recorded in feet and converted to
metres for reporting.
Figure 8. Ms. Oberang Antonio conducting fieldwork and sample analyses
4.3 Visit to a Certified Water Quality Lab in Guam
Halfway through the monitoring in June 2019, the
water quality monitoring team, with funding from
the IW R2R project, had the opportunity to attend
the 30th Pacific Islands Environment Conference
on Guam. Prior to conference sessions, the team
visited the Water and Environmental Research
Institute of the Western Pacific (WERI), located
at the University of Guam. MCN staff had only
been exposed to in situ monitoring and analysis,
so the visit provided them with a glimpse of the
laboratory analysis aspect of monitoring. The
team also had the opportunity to meet with
WERI director, Dr. John Jenson, and University
of Guam Master of Science in Environmental
Science Program Chair, Dr. Joseph Rouse.
Figure 9. Water Quality Team visit to WERI
10Melekeok Conservation Network In Situ
Water Quality Monitoring Report Palau
4.4 Handover and Post One-Year Fieldwork
On November 14, 2019, a ceremony was held at the Ngardok Nature Reserve, where the IW R2R
project handed over water quality equipment and related items to the MCN. The ceremony was
attended by the MCN staff, MCN Board representatives, as well as the Protected Areas Network
Coordinator. At the ceremony, the MCN coordinator announced that water quality monitoring would
continue.
Figure 10. Handover Ceremony with MCN Board and Staff
115. RESULTS
As noted in Table 1, EQPB regulations for surface water require that variations should not exceed
natural conditions. Except for SS2 (Ngardok Lake), this is the first time in situ water quality monitoring
work has been conducted at the sites. It is noted that SS1 is an intermittent stream and was dry for a
couple of months, and as a result, SS1 had 16 sampling dates while SS2 to SS5 had 22 sampling dates.
5.1 Comparing Selected Parameters
Temperature results ranged from 78°F to 87°F.
The stream sites (SS1, SS3, SS4 and SS5) had
similar temperature patterns. SS2 (Ngardok Lake)
temperature values had greater fluctuations and
were higher than that of the other sites, with the
highest temperature recorded at 87.2°F.
Dissolved Oxygen (DO) varied across the sites. SS4
and SS5 had higher DO values (ranging from 5 mg/L
to 7 mg/L). SS2 and SS3 depict greater fluctuations
suggesting extent of flow rate as dictated by dry/
wet seasons.
Values measured for specific conductivity ranged
from about 30 µS/cm to 80 µS/cm, noting higher
values in the dry season, which suggests a strong
seasonal pattern. Specific conductivity values for
SS2 (Ngardok Lake) values ranged between 40 µS/
cm to 60 µS/cm.
Turbidity values followed similar patterns except
for SS1 with notable spikes in dry season. SS1 is a
shallow intermittent stream and was dry multiple
times. SS1 spike of 10 FNU was recorded two days
after a heavy rain event. Spikes for all the sites
were observed during periods of heavy rain. SS2
turbidity values ranged from 1 FNU to 6 FNU,
which is consistent with reported values in the
1996 USGS study. Figure 11. Comparing Selected Parameters
5.2 Comparing Nutrients between Sites
Low concentrations of nutrients were found at all the sites. The 1996 USGS study (at SS2) analysed
nutrients (nitrate and phosphate) according to the 1996 U.S. Environmental Protection Agency Safe
Drinking Water Act and reported results as less than the detection limit.
The bar graphs in Figure 12 provide a comparison of nutrient levels at each of the sites. SS1, SS2 and
SS3 are located within the NNR, while SS4 and SS5 are located outside the protected area.
12Melekeok Conservation Network In Situ
Water Quality Monitoring Report Palau
Figure 12. Comparing Nutrients between Sites
5.3 Water Level at SS3
For the monitoring period, water level in the Melekeok Dam (SS3) ranged from 2 m to 3 m. In April
2020, Palau’s National Emergency Committee issued a water shortage advisory for the Republic of
Palau. The advisory noted that, based on data from Palau’s Weather Service Office, February, March,
and April, are normally dry months for Palau with minimal rainfall. Figure 13 shows that SS3 water
levels were low for the same months in the monitoring period.
Figure 13. Showing water depths over the duration of sampling Sep-2018 till Sep-2019
136. DISCUSSION
6.1 Water Quality Monitoring
A participatory and consultative approach was used for planning out the water quality monitoring.
By engaging the MCN staff early in the process, involvement and ownership was realised. MCN staff
selected sampling locations, participated in the classroom and training sessions, and conducted the
year-long monitoring. The water monitoring was a first for MCN; as staff were trained and became
more comfortable, MCN agreed that monitoring will continue.
The monitoring delivered on Palau IW R2R was an outcome of increased local community and agency
capacity for water quality monitoring. Furthermore, it delivered on the goals of NNR to increase staff
capacity and to provide research opportunities for its natural systems.
6.2 Preliminary Results
The results of temperature monitoring for SS2 are like those of the 1996 USGS study which reports
Ngardok Lake near surface temperature between 82°F and 84°F. Ngardok Lake surface area is about
1 km2 and is much larger than the streams. In addition, the stream sites have canopy cover and are
not directly under the sun, which may account for their lower and more consistent temperature
values.
SS4 and SS5 are deeper streams with fast-flowing water. SS3 varied in DO concentration from
between 1.5 mg/L to 6 mg/L, which is notably low particularly in dry season, suggesting the site
is the most stagnant out of all the sites. The DO results for SS2 (Ngardok Lake) are like the 1996
USGS studies that report DO levels around 6 mg/L. The values measured for specific conductivity
potentially indicate groundwater seepage to the lake.
SS2 turbidity values ranged from 1 FNU to 6 FNU, which is consistent with reported values in the
1996 USGS study. This implies land-use activities such as land clearing and removal of trees and
vegetation, which in turn contribute to sedimentation and increased turbidity of the waterways,
including waste seepage, and inundation of lake or catchment banks.
The first assessments point out that the dry months of February, March and April are associated
generally with relatively high or increases in temperature, dissolved oxygen, and conductivity. As
flow rate decreases with shallow water depths, this translates to high water temperature and DO.
Land use activities outside the reserve influence export of sediment and waste pollution down
to areas adjacent to point source of discharges and are carried further downstream. This causes
potential differences in the readings of water quality parameters, including nutrients, particularly
considering circumstances where water movement upstream downstream is restricted during dry
months.
Increased turbidity was apparent during heavy rainfall suggesting the need for MCN to continue with
the restoration efforts in the barren lands of the Ngerdorech Watershed. The second assessment
showed that nutrients assessed in this study were low, suggesting low nutrient input to the lake. The
third assessment indicates a correlation in rainfall and SS3 stream levels.
These results are useful and can be treated as preliminary as sampling protocol is improved or
considered as baseline against future readings.
14Melekeok Conservation Network In Situ
Water Quality Monitoring Report Palau
6.3 Future Prospects
At the handover ceremony, the PAN Coordinator, Mr. Obichang Skebong congratulated MCN and
the Palau IW R2R on their partnership and year-long monitoring. He commended MCN for utilising
funding outside of PAN sources to increase staff capacity and achieve activities in their management
plan. The PAN coordinator also stressed the need for MCN to reach out and cross-train other Palau
PAN member States in their acquired skills. Mr. Skebong mentioned that two PAN States have
already expressed interest in the water quality monitoring work at MCN and he hoped to facilitate
discussions soon.
The water monitoring has also opened exciting new partnerships. Other agencies and research
institutions have learned of MCN activities and have shown expressions of interest for partnership.
In the first half of 2020, MCN partnered with the Palau Coral Reef Research Foundation to study
sedimentation and water quality at Ngardok Lake. Through this partnership, MCN will continue
the water quality monitoring work while the Coral Reef Research Foundation will install weather
devices, rain gauges and sediments traps around the lake. Another partnership in discussion is with
the United States Embassy in Palau to continue the water quality monitoring work and investigate a
hydrological watershed model for the NNR.
7. CONCLUSIONS
The ridge to reef concept is largely premised on science and evidence-based approaches to integrated
resource management and development planning. The one-year water quality sampling and
monitoring provides important new datasets, which will be useful in the revision or establishment of
baseline indicators associated with water, and more broadly ascertaining security and safe protection
of natural resources and increased community resilience against environment threats such as waste
pollution, natural disasters, and climate change.
Notably, the results at one site, SS2, are generally similar to those of the 1996 USGS study at the
same location, with respect to water temperature, conductivity, DO and turbidity. The results at
other sites are also equally important as baselines and for comparison against future water quality
readings of sampling and monitoring work. While most of the sampling sites were not covered in
the previous study and therefore comparisons cannot be drawn, the results can be still used to
inform policy decisions and ensure conservation and sustainable use of natural resources. It is also
important to note signs of potential groundwater seepage to the lake, which may be explained by an
increased level of land-use activities in areas outside the reserve.
The following are proposed recommendations for the consideration of the responsible agencies. It
is recommended:
(i) That improvements to the sampling protocol be continually reviewed, taking into
consideration changing circumstances and availability of resources. It is also important to
exercise caution not to make too many changes over time as this will affect comparability
and usefulness of results.
(ii) That reviews of sampling protocols and design also take into consideration challenges
experienced. For instance, there is overgrowth of vegetation and presence of large
saltwater crocodiles in the Beriber Stream, making water quality sampling there
challenging. It is also likely that such problems may extend to other areas of streams,
lakes, and the broader watershed catchment. The Beriber Stream is an outlet of Ngardok
Lake located within the Ngerdorech Watershed Catchment.
15(iii) That future sampling considers the frequency and location of sites to ensure comparability
of measured parameters. For example, SS1 is an intermittent stream and sampling there
was carried out sixteen (16) times over the year. SS2–SS5 streams were sampled 22 times
over the same year. SS1 and SS2 are potentially better representation of the headwaters
for the Ngerdoresch Watershed.
(iv) That future sampling takes into consideration water depths used to collect surface water,
which was generally less than a metre. The 1996 USGS study also sampled at different
depths and locations around the lake. Sampling was generally satisfactory except for
the site SS2, where water depth is shallower and mixing of the water column in the lake
restricted. This needs to be considered and endorsed by the MCN Board when sampling
at SS2, and to grant permission to install floating devices in the lake for purpose of
measuring mixing.
(v) That seasonality is an important feature and future data may be needed to support
trends in seasonality. The results of the current study support seasonality with dry
months February−April previously documented. It is recommended that a rain gauge is
installed at the Ngardok Lake Nature Reserve to monitor and document average rainfall.
The Beriber Stream and Ngardok Lake are dependent on rainfall and it is important to
measure its contribution.
(vi) That a partnership is established with the Bureau of Agriculture Forestry department to
measure canopy cover at each sampling site.
(vii) That the MCN Board considers and approves sampling extended into the future covering
both dry and wet seasons. The Board is also requested to consider investing in stream
data loggers to monitor sampling sites continuously into the future. A cost-benefit
analysis and feasibility study may be needed to inform policy discussion and decisions of
the MCN Board.
(viii) It is recommended that the MCN Board invest in back water quality test kits and
accessories, recognising that the IW R2R project kits may be donated to the Board
following project closure. Article IX para. 2 of the MOU between Palau and SPC requires
that “. . . equipment, non-expendable materials or other . . . financed by the project
shall be returned to UNDP . . . unless/otherwise agreed upon between Parties and in
consultation with SPC.”
(ix) That water quality monitoring is continued and remains important to validate trends
and inform or complement current rehabilitation and restoration efforts at the NNR.
When available, consideration may be given to extending field testing and laboratory
analysis of samples for metals, radioactivity and other parameters currently not covered
by the test kits.
16Melekeok Conservation Network In Situ
Water Quality Monitoring Report Palau
REFERENCES
Belau Watershed Alliance. 2011-2015. BWA 5-Year Strategic Action Plan. Palau: BWA.
Melekeok Conservation Network 2017. Melekeok Conservation Network Management Plan. Palau.
Palau National Emergency Commitee 2019. Water Shortage Advisory. Palau.
Republic of Palau 2015. 2015 Census of Population Housing and Agriculture for the Republic of Palau.
Palau: ROP.
United States Department of Agriculture, Natural Resources Conservation Service 2009. Soil Survey
of the Island of Palau. Retrieved from http://soils.usda.gov/survey/printed_surveys/
Yeung C.W. & Wong M.F. 1999.U.S. Department of the Interior Storage Capacity and Water Quality
of Lake Ngardok, Babeldaob Island, Republic of Palau, 1996-98. U.S. Geological Survey Water
Resources Investigations Report 99-4118. Honolulu: US Geological Survey.
17APPENDICES
Appendix 1: Safety
As with any activity undertaken by the Melekeok Conservation Network utmost priority is held for
safety. Safety measures below are taken from the Waterwatch Victoria Methods Manual. It is the
responsibility of the MCN PAN Coordinator as well as MCN staff that all safety measures are followed.
1. Field Safety
Below are general safety recommendations that should be taken into consideration while sampling
is undertaken in the field.
• Utilize a buddy system while out in the field. It is not recommended for one person to
undertake sampling.
• Let someone at the Ngardok Nature Field office know when heading out into field.
Likewise write in the NNR Board the time when persons left to the field. Let someone
know how long plan to be in the field.
• Wear proper clothing and footwear.
• Bring water.
• Utilize common sense when walking to site.
• Do not allow children to sample without adult supervision.
• Do not put yourself or others at risk.
2. Chemical Safety
Below are general safety recommendations that should be taken into consideration when working
with chemicals.
• Read and familiarize the warnings and first aid procedures of the chemicals.
• Make sure there is running water or water available in the event of an accidental spill.
• Always wear gloves when handling the chemicals.
• Empty waste chemicals onto designated bucket and dispose correctly.
• Provide adult supervision when children are using the chemicals and ensure they are
aware of the safety and dangers when using the chemicals.
• When finished using the chemicals ensure hands are washed.
3. Field Considerations
Below are general recommendations that should be taken into consideration while sampling is
undertaken in the field.
• If a recommendation is made to sample a new location within a private property, seek
permission first.
• Keep site as clean as possible by removing excess rubbish.
• If something is tampered or doesn’t look normal in the site notify MCN coordinator.
18Melekeok Conservation Network In Situ
Water Quality Monitoring Report Palau
Appendix 2: Workplan
Name Melekeok Conservation Network (MCN) Water Quality Monitoring
Project Palau R2R IW Project with MCN
Date May-18
Activity 2018 2019
May Jun July Aug Sep Oct Nov Dec Jan Feb Mar Apr May Jun Jul Aug Sept Oct Nov
Meet with MCN
Coordinator x
Initial Planning
Meeting with
MCN x
Field Site
Selection x
Classroom Session x x x
Monitoring Tools
Training x
Data Collection /
Field Work x x x x x x x x x x x x x
Preliminary Data
Analyses x
Hand Over
Monitoring Tools x
19Appendix 3: Maps and Site Photos 20
Melekeok Conservation Network In Situ
 Water Quality Monitoring Report Palau

                                         21
SS1 – “First Bench”
SS2 – Ngardok Lake Floating Dock
SS3 – Ngeokib, Melekeok Water Dam
22Melekeok Conservation Network In Situ
Water Quality Monitoring Report Palau
SS4 - Ngerkoranges
SS5 - Euall
Proposed Site – Beriber, Ngardok Late Outlet
23Appendix 4: Nutrients
Date Ammonia (mg/L) Nitrate (mg/L) Nitrite (mg/L) Phosphate (mg/L)
9/21/2018
SS1 NF/VLR 1 0.034 0 NF/VLR2
NF/VLR 3 0.049 0.16 NF/VLR5
SS2 0.003
NF/VLR 4 0.052 0.12
SS3 0.001
0.01 0.11
0.036
SS4 0 0
0.054
SS5 0.001
10/4/2018
SS1 0.03 0.077 0.002 0.22
SS2
0.02 0.06 0.001 0.47
SS3
0.03 0.068 0.005 0.06
SS4
0.03 0.098 0.002 0.19
SS5
0.02 0.119 0.003 0.27
10/31/2018
SS1 0.01 0.056 0.02 0.049
0.01 0.144
SS2 0.001 0.16
SS3 0.01 0.094
0 0.23
SS4
0.01 0.125
0.001 0.23
SS5 0
0.27
0.002 0.47
11/13/2018
SS1 0.01 0.076 0 0.38
SS2
0.01 0.118 0.003 0.45
SS3
0.07 0.061 0.001 0.25
SS4
0.02 0.049 0.001 0.4
SS5
0.01 0.123 0.002 0.3
11/20/2018
SS1 0.001 0.078 0 0.11
SS2
0.01 0.333 0.001 0.52
SS3
0.02 0.119 0.001 0.46
SS4
0.01 0.064 0.001 0.4
SS5
0.01 0.098 0.001 0.19
12/6/2018
SS1 0.01 0.099 0 0.22
SS2 0.02 0.064 0 0.49
SS3 0.02 0.065 0.25
0.003
0.06 0.117 0.17
SS4 0.001
0.03 0.051 0 0.17
SS5
12/19/2018
SS1 0.01 0.049 0.001 0.05
0.01 0.093 0.005 0.09
SS2
SS3 0.02 0.058 0.002 0.1
SS4
0.01 0.085 0.002 0.11
SS5
0.02 0.195 0.001 0.15
1/8/2019
SS1 0.08 0.233 0.007 0.39
0 0
SS2 0.094 0.31
24Melekeok Conservation Network In Situ
Water Quality Monitoring Report Palau
Date Ammonia (mg/l) Nitrate (mg/l) Nitrite (mg/l) Phosphate (mg/l)
SS3 0.02 0.135 0 0.2
SS4 0.01 0.049 0.002 0.16
SS5 0.01 0.082 0.002 0.05
1/22/2019
SS1 0.01 0.168 0 0.62
SS2 NF/VLR6 0.209 0.002 0.79
SS3 0 0.129 0.002 0.62
SS4 0.01 0.745 0 0.38
SS5 0.01 0.503 0.001 0.63
2/5/2019
SS1 0.01 0.286 0.001 0.38
SS2 NF/VLR 7
0.402 0.002 0.39
SS3 NF/VLR8 0
0.503 0.52
SS4 NF/VLR 9 0
0.835 0.48
SS5 0
0.97 0 0.35
2/19/2019
SS1 0.03 0.085 0 0.29
SS2 0 0.144 0.004 0.67
SS3 0.01 0.057 0.001 0.38
SS4 0.01 0.287 0.001 0.37
SS5 0.04 0.221 0 0.21
3/5/2019
SS1 NF/VLR10 NF/VLR10 NF/ NF/VLR10
SS2 0.01 0.147 VLR 0.001 0.94
SS3 10 0.002
SS4 0.01 0.153 0.2
0.01 0.266 0.001 0.11
SS5
0.04 0.418 0.001 0.11
3/19/2019
SS1 0.01 0.15 0.001 0.08
SS2 0.02 0.315 0 0.29
SS3 0.01 0.137 0 0.09
SS4 0 0.241 0.002 0.17
0.01 0
SS5 0.173 0.5
4/2/2019
25Date Ammonia (mg/l) Nitrate (mg/l) Nitrite (mg/l) Phosphate (mg/l)
SS1 NF/VLR11 NF/VLR 11 NF/ NF/VLR11
SS2 0.01 0.404 VLR11 0 0.52
SS3 0.02 0.07 0.004 0.43
SS4 0 0.366 0.71
0.001
SS5 0 0.46 0 0.22
4/16/2019
SS1 NF/VLR12 NF/VLR12 NF/VLR 12 NF/VLR12
SS2 0 0.438 0 1.15
SS3 0.01 0.138 0.001 0.51
SS4 0.471 0.33
0 NF/VLR 13 0.013
SS5 0.418 0 0.32
5/8/2019
26Melekeok Conservation Network In Situ
Water Quality Monitoring Report Palau
Date Ammonia (mg/l) Nitrate (mg/l) Nitrite (mg/l) Phosphate (mg/l)
SS1 NF/VLR14 NF/VLR14 NF/VLR14 NF/VLR14
SS2 0.02 0.292 0 1.05
SS3 0.01 0.153 0 0.28
SS4 0 0.61 0.001 0.032
SS5 0.01 0.59 0.001 0.27
5/24/2019
SS1 NF/VLR15 NF/VLR15 NF/VLR15 NF/VLR15
SS2 0.01 0.52 0.003 0.38
SS3
0 0.59 0 0.54
SS4
0.01 0.83 0.004 0.78
SS5
0.01 0.495 0.013 0.64
6/7/2019
SS1 0.02 0.295 0.001 0.46
SS2 0.01 0.17 0 0.92
SS3
0.03 0.418 0.001 0.43
SS4
0.04 0.317 0.001 0.35
SS5 0
0.03 0.421 0.68
6/18/2019
SS1 0 0.335 0 0.39
SS2 0.01 0.328 0.002 0.49
SS3 0.01 0.215 0.001 0.51 0.33
SS4
0.02 0.88 0.001 0.38
SS5
0.01 0.9 0.001
7/8/2019
SS1 0.01 0.449 0 0.26
SS2 0.01 0.334 0.002 0.58
SS3 0.01 0.545 0.001 0.39
SS4
0.01 0.77 0.001 0.77
SS5 0 0
0.494 0.29
8/21/2019
SS1 0.01 0.067 0 0.02 0.33
SS2 0 0.04 0.002 0.36
SS3 0 0.055 0 0.59
SS4 0.01 0
0.098 0.48
SS5 0.01 0.001
0.079
9/26/2019
SS1 0.01 0.115 0 0.38
SS2 0 0.052 0 0.37 0.34
SS3 0 0.122 0 0.48
SS4 0 0.104 0.42
0
SS5 0 0.141
0.002
27Notes:
• NF = No Stream Flow
• VLR = Value Lower than Range for YSI9300 Meter Reading
NF/VLR1: (SS1, 9/21/2018) Ammonia Value Lower than Range
NF/VLR2: (SS1, 9/21/2018) Phosphate Value Lower than Range
NF/VLR3: (SS2, 9/21/2018) Ammonia Value Lower than Range
NF/VLR4: (SS3, 9/21/2018) Ammonia Value Lower than Range
NF/VLR5: (SS3, 9/21/2018) Phosphate Value Lower than Range
NF/VLR6: (SS2, 1/22/2019) Ammonia Value Lower than Range
NF/VLR7: (SS2, 2/05/2019) Ammonia Value Lower than Range
NF/VLR8: (SS3, 2/05/2019) Ammonia Value Lower than Range
NF/VLR9: (SS4, 2/05/2019) Ammonia Value Lower than Range
NF/VLR10: (SS1, 3/05/2019) No Stream Flow, No values for all Parameters SS1
NF/VLR11: (SS1, 4/02/2019) No Stream Flow, No values for all Parameters SS1
NF/VLR12: (SS1, 4/16/2019) No Stream Flow, No values for all Parameters SS1
NF/VLR13: (SS5, 4/16/2019) Ammonia Value Lower than Range
NF/VLR14: (SS1, 5/08/2019) No Stream Flow, No values for all Parameters SS1 NF/VLR15: (SS1, 5/24/2019) No Stream
Flow, No values for all Parameters SS1
28Melekeok Conservation Network In Situ
Water Quality Monitoring Report Palau
Appendix 5:
Monitoring from September 2018 to September 2019
Date Sum of Temp (°F)Dissolved Oxygen(mg/L)Conductivity (µS/cm) pH Salinity (psu) Total Dissolved
Solids (mg/L) Turbidity (FNU)
21‐Sep‐18
SS1 79.3 5.96 36.1 7.73 0.01 23 1.42
SS2 84.4 6 62.8 7.41 0.03 38 0.49
SS3 80.2 4.41 53 6.85 0.02 33 3.31
SS4 80.1 5.94 48.9 7.28 0.02 31 0.3
SS5 79.8 6.83 45.3 7.45 0.02 29 0.46
4‐Oct‐18
SS1 79.2 5.96 40.1 7.45 0.02 25 4.5
SS2 84.7 5.16 66.3 7.2 0.03 40 0.62
SS3 80.2 2.87 60.6 6.99 0.03 38 2.48
SS4 80.2 5.66 52.9 7.16 0.02 33 0
SS5 79.6 6.74 49.5 7.21 0.02 31 0.56
31‐Oct‐18
SS1 79.6 5.77 33.6 7.67 0.01 21 1.35
SS2 82.7 5.12 56.4 7.21 0.02 35 1.57
SS3 80 4.96 47.2 7.11 0.02 30 3.83
SS4 80.2 6.05 44.7 7.18 0.02 28 0.33
SS5 79.7 6.96 42.3 7.27 0.02 27 0.34
13‐Nov‐18
SS1 79.7 5.71 34.8 7.37 0.01 22 1.94
SS2 82.2 4.59 55.8 7.23 0.02 34 1.8
SS3 80.3 5.34 44.5 7.31 0.02 28 2.3
SS4 80.3 6.02 44.5 7.32 0.02 28 0.47
SS5 80 6.84 40.4 7.34 0.02 25 0.54
20‐Nov‐18
SS1 79.5 5.45 31.8 7.23 0.01 20 1.42
SS2 80.5 3.05 35.7 6.68 0.01 22 1.79
SS3 79.5 5.66 38.4 7.46 0.02 24 1.91
SS4 79.5 6.16 38.2 7.42 0.02 24 1.31
SS5 79.7 6.79 37.6 7.34 0.02 24 0.86
6‐Dec‐18
SS1 80.2 6.12 38.7 8.1 0.02 24 1.72
SS2 84.2 6.08 60.1 7.54 0.02 36 0.79
SS3 81 4.38 51.3 7.29 0.02 32 1.86
SS4 81.1 6.01 47.3 7.52 0.02 29 0.12
SS5 80.4 6.84 45 7.49 0.02 28 0.32
19‐Dec‐18
SS1 not enough not enough not enough stream not enough not enough not enough not enough
stream flow stream flow flow stream flow stream flow stream flow stream flow
SS2 81.8 2.77 52.3 7.2 0.02 32 1.17
SS3 81.1 5.2 42.8 7.39 0.02 27 2.34
SS4 81 5.75 42.9 7.38 0.02 27 1.11
SS5 80.7 6.6 40.3 7.37 0.02 25 0.87
8‐Jan‐19
SS1 79.3 6.02 35.1 7.81 0.01 22 0.96
SS2 80.7 4.9 47.6 7.41 0.02 30 1.28
SS3 79.1 5.62 38.7 7.66 0.02 25 0.87
SS4 79.2 6.31 37.9 7.7 0.02 24 0.27
SS5 78.9 7.18 36.5 7.57 0.02 23 0.26
22‐Jan‐19
SS1 not enough not enough not enough stream not enough not enough not enough not enough
stream flow stream flow flow stream flow stream flow stream flow stream flow
SS2 83.2 6.07 60.8 7.9 0.03 37 0.51
SS3 80.4 5.04 50.1 7.84 0.02 31 1.11
SS4 80.4 6.13 46.3 7.77 0.02 29 0.15
SS5 80.2 6.92 44.9 7.79 0.02 28 0.22
29Date Sum of Temp (°F)Dissolved Oxygen(mg/L)Conductivity (µS/cm) pH Salinity (psu) Total Dissolved
Solids (mg/L) Turbidity (FNU)
5‐Feb‐19
SS1 79.1 6.34 42.6 8.76 0.02 27 1.58
SS2 82.6 5.19 66.3 8.08 0.03 41 0.67
SS3 80 4.66 56.3 7.93 0.02 35 1.98
SS4 79.9 5.92 50.5 7.82 0.02 32 0.1
SS5 79.6 6.89 48.5 7.79 0.02 31 0.41
19‐Feb‐19
SS1 78.2 5.77 40 8.02 0.02 26 10.51
SS2 82.7 5.08 69.2 7.68 0.03 42 0.81
SS3 79.4 3.57 61.7 7.38 0.03 39 2.48
SS4 79.6 5.54 53.8 7.57 0.02 34 0.02
SS5 79.3 6.86 51.5 7.74 0.02 33 0.58
5‐Mar‐19
SS1 not enough not enough not enough stream not enough not enough not enough not enough
stream flow stream flow flow stream flow stream flow stream flow stream flow
SS2 85 5.71 72.3 8.11 0.03 43 0.81
SS3 79.6 2.76 71.1 7.63 0.03 45 2.43
SS4 79.6 5.22 59.2 7.54 0.03 37 0
SS5 79.8 6.69 57.2 7.56 0.02 36 0.88
19‐Mar‐19
SS1 78.9 6.26 53.4 8.34 0.02 34 2.28
SS2 82 3.67 72.8 7.46 0.03 45 2.06
SS3 79.4 4.43 63.8 7.52 0.03 40 2.83
SS4 79.3 5.79 58.5 7.58 0.03 37 0.07
SS5 78.7 6.86 54.8 7.64 0.02 35 0.58
2‐Apr‐19
SS1 not enough not enough not enough stream not enough not enough not enough not enough
stream flow stream flow flow stream flow stream flow stream flow stream flow
SS2 86.3 6.2 73.4 8.02 0.03 43 1.28
SS3 79.9 1.55 74.7 7.2 0.03 47 3.31
SS4 80.3 4.74 62 7.27 0.03 39 0
SS5 80.6 6.36 60.4 7.44 0.03 38 1.16
16‐Apr‐19
SS1 not enough not enough not enough stream not enough not enough not enough not enough
stream flow stream flow flow stream flow stream flow stream flow stream flow
SS2 87.2 5.95 77 7.9 0.03 45 1.45
SS3 81.1 2.31 71.3 7.44 0.03 44 4.49
SS4 81.2 5.05 60.8 7.45 0.03 38 0.02
SS5 81.3 6.48 58.1 7.49 0.02 36 1.17
30Melekeok Conservation Network In Situ
Water Quality Monitoring Report Palau
Monitoring from September 2018 to September 2019
Date Sum of Dissolved Conductivity (µS/cm) pH Turbidity
Temp (°F) Oxygen- Salinity (psu) Total Dissolved Solids (mg/L) (FNU)
(mg/L)
8‐May‐19
SS1 not enough not enough not enough not enough not enough not enough not enough
stream flow stream flow stream flow stream flow stream flow stream flow stream flow
SS2 84.4 4.27 76.6 8.11 0.03 46 2.66
SS3 80.6 3.41 72 7.85 0.03 45 3.55
SS4 80.6 5.34 60.5 7.72 0.03 38 0
SS5 80.3 6.67 56.3 8.03 0.02 35 0.83
7‐Jun‐19
SS1 79.9 5.75 43.6 8.22 0.02 27 3.09
SS2 82.4 4.26 62.2 7.75 0.03 38 2.84
SS3 81 5.01 53 7.93 0.02 33 2.5
SS4 80.9 5.89 51.8 7.87 0.02 32 0.73
SS5 80.4 6.74 46.7 7.81 0.02 29 0.66
18‐
Jun‐19
SS1 80 5.67 40.3 7.78 0.02 25 3.76
SS2 85.3 5.68 65.5 7.75 0.03 39 1.35
SS3 81 4.79 54.9 7.72 0.02 34 2.28
SS4 80.8 6 50.4 7.81 0.02 31 0.41
SS5 80.3 6.83 45.8 7.81 0.02 29 0.44
8‐Jul‐19
SS1 79.3 5.69 41.9 8.47 0.02 27 1.63
SS2 82.9 4.93 60.8 7.87 0.03 37 1.28
SS3 79.8 5.21 49.9 7.93 0.02 31 2.17
SS4 79.7 6.23 46.6 7.92 0.02 29 0.57
SS5 79 6.85 42.9 7.83 0.02 27 0.59
15‐Jul‐19
SS1 78.8 5.19 33 7.66 0.01 21 2.85
SS2 77.8 3.04 40.9 7.42 0.02 26 4.14
SS3 78.1 5.48 38.2 7.67 0.02 25 2.94
SS4 78.2 5.86 38.3 7.63 0.02 25 3.56
SS5 78.5 6.5 37 7.65 0.02 24 1.87
21‐
Aug‐19
SS1 79.3 5.77 35.8 8.55 0.01 23 1.13
SS2 82.8 5.38 59.2 8.39 0.02 36 1.49
SS3 80.4 5.54 46.8 8.59 0.02 29 0.97
SS4 79.9 6.19 47.8 8.27 0.02 30 1.14
SS5 79.8 6.88 45.8 8.26 0.02 29 0.4
26‐
Sep‐19
SS1 79.5 5.98 36.1 9.36 0.01 23 2.63
SS2 84.1 5.41 58.5 8.34 0.02 35 1.11
SS3 80.3 4.76 51.4 8.84 0.02 32 1.02
SS4 80 6.12 49.2 8.75 0.02 31 0.23
SS5 79.3 6.87 47.4 8.95 0.02 30 0.33
31Appendix 6: Water Depth at Ngeokib (Dam)
Date Water Depth Water Depth
(ft) (m)
21/09/2018 8 2.4
4/10/2018 8 2.4
31/10/2018 9 2.7
13/11/2018 9 2.7
20/11/2018 9 2.7
6/12/2018 8.5 2.6
19/12/2018 9.5 2.9
8/01/2019 9 2.7
22/01/2019 8.5 2.6
5/02/2019 8.5 2.6
19/02/2019 8 2.4
5/03/2019 7.5 2.3
19/03/2019 8 2.4
2/04/2019 7.5 2.3
16/04/2019 7 2.1
8/05/2019 8 2.4
24/05/2019 8 2.4
7/06/2019 9 2.7
18/06/2019 8.5 2.6
8/07/2019 8.5 2.6
15/07/2019 9.5 2.9
21/08/2019 9 2.7
26/09/2019 8.5 2.6
32Melekeok Conservation Network In Situ
Water Quality Monitoring Report Palau
Appendix 7: Water Shortage Advisory
Appendix 7: Water Shortage Advisory
NATIONAL EMERGENCY COMMITTEE Planning, Mitigation,
P.O. Box 100 Preparedness, Response
Koror, Republic of Palau 96940
and Recovery, The
Tel # (680) 587-6366/6367, Fax# (680) 587-6368
essential ingredients for
E-mail: palaunemo@gmail.com / nemo@palaugov.org a successful Disaster
Management.
FOR IMMEDIATE RELEASE
April 7, 2020
PUBLIC ADVISORY
WATER SHORTAGE ADVISORY
The National Emergency Committee (NEC) is placing the Republic of Palau under “Water
Shortage WATCH” beginning April 8, 2020 and informs the general public that water reservoir
levels at Ngerimel and Ngerikiil, Airai have fallen drastically in recent days due to lack of rainfall
and high consumption of water. The NEC advises the general public that should water levels
continue to fall drastically as it did in recent days, the Republic will be put on Water Shortage
WARNING and a water rationing schedule will be implemented by the Palau Public Utilities
Corporation.
Water Conservation is instrumental in addressing water shortage. The NEC is encouraging the
general public including the public and private sector to practice water conservation measures by
minimizing water use and limit water use to ESSENTIALS only, as advised by the Palau Public
Utilities Corporation.
The general public is also advised that car washing, water blasting, and non-essential use of water
is PROHIBITED at this time until further notice as advised by the Palau Public Utilities
Corporation. The public is advised to conserve water whenever possible.
Historical data from the Palau National Weather Service Office indicate that the months of
February, March and April are normal dry months for the Republic of Palau with minimal
rainfall. The amount of rainfall forecast for Palau for the months of April to May 2020 may not
be sufficient to maintain adequate water levels in Palau’s two main water reservoirs (Ngerimel
and Ngerikiil), including main water sources in all other States.
The Palau Public Utilities Corporation (PPUC) will continue to monitor water levels and inform
the NEC and the general public accordingly.
37
33You can also read