Third Quarter 2019 Investor Presentation - Managing Key Value Drivers to Maximize Full Cycle Returns - United Rentals

Page created by Wesley Leonard
 
CONTINUE READING
Third Quarter 2019 Investor Presentation - Managing Key Value Drivers to Maximize Full Cycle Returns - United Rentals
Third Quarter 2019 Investor Presentation
Managing Key Value Drivers to Maximize Full Cycle Returns

   United Rentals, Inc., 100 First Stamford Place, Stamford, CT 06902. © 2018 United Rentals, Inc. All rights reserved.
Third Quarter 2019 Investor Presentation - Managing Key Value Drivers to Maximize Full Cycle Returns - United Rentals
Introductory Information
Unless otherwise specified, the information in this presentation, including forward-looking statements related to our outlook, is as of our most recent earnings call held on October 17, 2019. We make no
commitment to update any such information contained in this presentation.
Certain statements in this presentation are forward-looking statements within the meaning of Section 21E of the Securities Exchange Act of 1934, as amended, and the Private Securities Litigation Reform Act
of 1995, known as the PSLRA. These statements can generally be identified by the use of forward-looking terminology such as "believe," "expect," "may," "will,“ "should," "seek," "on-track," "plan," "project,"
"forecast," "intend," "anticipate,“ “target,” or the negative thereof or comparable terminology, or by discussions of vision, strategy, outlook or guidance. These statements are based on current plans,
estimates and projections, and, therefore, you should not place undue reliance on them. No forward-looking statement can be guaranteed, and actual results may differ materially from those projected.
Factors that could cause actual results to differ materially from those projected include, but are not limited to, the following: (1) the challenges associated with past or future acquisitions, including BakerCorp
and BlueLine, such as undiscovered liabilities, costs, integration issues and/or the inability to achieve the cost and revenue synergies expected; (2) a slowdown in North American construction and industrial
activities, which could reduce our revenues and profitability; (3) our significant indebtedness, which requires us to use a substantial portion of our cash flow for debt service and can constrain our flexibility in
responding to unanticipated or adverse business conditions; (4) the inability to refinance our indebtedness at terms that are favorable to us, or at all; (5) the incurrence of additional debt, which could
exacerbate the risks associated with our current level of indebtedness; (6) noncompliance with covenants in our debt agreements, which could result in termination of our credit facilities and acceleration of
outstanding borrowings; (7) restrictive covenants and amount of borrowings permitted under our debt agreements, which could limit our financial and operational flexibility; (8) an overcapacity of fleet in the
equipment rental industry; (9) inability to benefit from government spending, including spending associated with infrastructure projects; (10) fluctuations in the price of our common stock and inability to
complete stock repurchases in the time frame and/or on the terms anticipated; (11) our rates and time utilization being less than anticipated; (12) our inability to manage credit risk adequately or to collect
on contracts with customers; (13) our inability to access the capital that our business or growth plans may require; (14) the incurrence of impairment charges; (15) trends in oil and natural gas could
adversely affect demand for our services and products; (16) our dependence on distributions from subsidiaries as a result of our holding company structure and the fact that such distributions could be
limited by contractual or legal restrictions; (17) an increase in our loss reserves to address business operations or other claims and any claims that exceed our established levels of reserves; (18) the
incurrence of additional costs and expenses (including indemnification obligations) in connection with litigation, regulatory or investigatory matters; (19) the outcome or other potential consequences of
litigation and other claims and regulatory matters relating to our business, including certain claims that our insurance may not cover; (20) the effect that certain provisions in our charter and certain debt
agreements and our significant indebtedness may have of making more difficult or otherwise discouraging, delaying or deterring a takeover or other change of control of us; (21) management turnover and
inability to attract and retain key personnel; (22) our costs being more than anticipated, and the inability to realize expected savings in the amounts or timeframes planned; (23) our dependence on key
suppliers to obtain equipment and other supplies for our business on acceptable terms; (24) our inability to sell our new or used fleet in the amounts, or at the prices, we expect; (25) competition from
existing and new competitors; (26) security breaches, cybersecurity attacks, failure to protect personal information, compliance with data protection laws and other significant disruptions in our information
technology systems; (27) the costs of complying with environmental, safety and foreign laws and regulations as well as other risks associated with non-U.S. operations, including currency exchange risk
(including as a result of Brexit), and tariffs; (28) labor difficulties and labor-based legislation affecting our labor relations and operations generally; (29) increases in our maintenance and replacement costs,
and/or decreases in the residual value of our equipment; and (30) the effect of changes in tax law. For a more complete description of these and other possible risks and uncertainties, please refer to our
Annual Report on Form 10-K for the year ended December 31, 2018, as well as to our subsequent filings with the SEC. The forward-looking statements contained herein speak only as of the date hereof, and
we make no commitment to update or publicly release any revisions to forward-looking statements in order to reflect new information or subsequent events, circumstances or changes in expectations.

Note: This presentation provides information about free cash flow, EBITDA, adjusted EBITDA and adjusted EPS, which are non-GAAP financial measures. This presentation includes a reconciliation between
free cash flow and GAAP cash from operations, as-reported and pro forma reconciliations between both adjusted EBITDA and EBITDA, on the one hand, and GAAP net income, on the other hand, a
reconciliation between both adjusted EBITDA and EBITDA, on the one hand, and GAAP cash from operations, on the other hand, a reconciliation between adjusted EPS and GAAP EPS and a reconciliation
between forward-looking free cash flow and forward-looking GAAP cash from operations. Information reconciling forward-looking adjusted EBITDA to GAAP financial measures is unavailable to the company
without unreasonable effort. The company is not able to provide reconciliations of forward looking adjusted EBITDA to GAAP financial measures because certain items required for such reconciliations are
outside of the company’s control and/or cannot be reasonably predicted, such as the provision for income taxes. Preparation of such reconciliations would require a forward-looking balance sheet, statement
of income and statement of cash flow, prepared in accordance with GAAP, and such forward-looking financial statements are unavailable to the company without unreasonable effort. The company provides a
range for its adjusted EBITDA forecast that it believes will be achieved, however it cannot accurately predict all the components of the adjusted EBITDA calculation.

                                                                                                                                                                                                                         2
                                                 United Rentals, Inc., 100 First Stamford Place, Stamford, CT 06902. © 2018 United Rentals, Inc. All rights reserved.
Third Quarter 2019 Investor Presentation - Managing Key Value Drivers to Maximize Full Cycle Returns - United Rentals
Contents

                                      1. Introduction
                                      2. End-Market Overview
                                      3. Company Overview
                                      4. Summary of Key Financial Data
                                      5. Appendix

United Rentals, Inc., 100 First Stamford Place, Stamford, CT 06902. © 2018 United Rentals, Inc. All rights reserved.   3
Third Quarter 2019 Investor Presentation - Managing Key Value Drivers to Maximize Full Cycle Returns - United Rentals
1                                      Introduction

United Rentals, Inc., 100 First Stamford Place, Stamford, CT 06902. © 2018 United Rentals, Inc. All rights reserved.
Third Quarter 2019 Investor Presentation - Managing Key Value Drivers to Maximize Full Cycle Returns - United Rentals
Maximizing value creation across the
cycle by balancing growth, margins and
     free cash flow to drive returns

   Aggressive management of key value drivers within our control

                                                                   5
Third Quarter 2019 Investor Presentation - Managing Key Value Drivers to Maximize Full Cycle Returns - United Rentals
Company overview
                                                                                                                                                                          (1)
                                                                                                                       #1 Market Share
                                                                                                                            • 2018 total revenue $8.0 billion (+21.2% Y/Y)
                                                                                                                            • 2018 adjusted EBITDA(2) $3.86 billion (+22.1% Y/Y; 48.0% margin)

                                                             United                                                    1,172 locations across North America(3)
                                                             Rentals
                                                                                                                            • 1,032 branches in the U.S.; locations in 49 of 50 states
             Other                                            13%
             77%                                                                                                            • 140 branches in Canada; locations in all 10 provinces

                                                                                                                       $15.0B of fleet comprised of ~680,000 units(4)
                                                                                                                       Highly diversified product and end-market mix
                                                                                                                       Team of approximately 19,000 employees(5)

                                        United Rentals is the North American equipment rental leader
(1)   North American market share is based on 2018 rental revenues, including pre-acquisition BakerCorp and BlueLine revenues, and ARA industry estimates.
(2)   Adjusted EBITDA is a non-GAAP measure. See the tables provided elsewhere in this presentation for reconciliations to the most comparable GAAP measures.
(3)   As of September 30, 2019. Excludes 11 European branches in France, Germany, the United Kingdom and the Netherlands. Total branch count 1,183.
(4)   As of September 30, 2019. Average fleet age 48.1 months.
(5)   As of September 30, 2019.

                                                   United Rentals, Inc., 100 First Stamford Place, Stamford, CT 06902. © 2018 United Rentals, Inc. All rights reserved.
                                                                                                                                                                                                 6
Third Quarter 2019 Investor Presentation - Managing Key Value Drivers to Maximize Full Cycle Returns - United Rentals
Our customers and the benefits of renting vs. owning
                                                  Customer Mix*                                                                                                           Why Customers Rent Instead of Buy
       Other
                                                                                                                                                                          •   Manage risk
       • Municipalities                                                                                                                                                   •   Control expenses and inventory
       • Government                                                                                                   Industrial /                                        •   The right equipment for any job
         Agencies                                             5%                                                      non-construction
                                                                                                                                                                          •   24/7 customer care
       • Homeowners
                                                                                                                      •    Oil & gas                                      •   Save on storage/warehousing
                                                                                                                      •    Chemical                                       •   Reduce downtime
                                                                                                                      •    Manufacturing
                                           Customer                                              48%                                                                      •   No need for maintenance
                                                                                                                      •    Food & beverage
       Non-residential                 47%  needs                                                                                                                         •   Save on disposable costs
                                                                                                                      •    Pulp & paper
       construction                                                                                                                                                       •   Equipment tracking
       • Commercial                                                                                                                                                       •   Conserve capital
       • Contracting
       • Maintenance & repair

                                Despite diverse needs, customers derive many benefits from renting
*Note: Based on 2018 rental revenue, excluding BlueLine and BakerCorp.

                                                   United Rentals, Inc., 100 First Stamford Place, Stamford, CT 06902. © 2018 United Rentals, Inc. All rights reserved.
                                                                                                                                                                                                                7
Third Quarter 2019 Investor Presentation - Managing Key Value Drivers to Maximize Full Cycle Returns - United Rentals
Branch locations

                                                                                                                                                                       North American
                                                                                                                                                                       branch count 1,172(1)
                                                                                                                                                                       • General Rentals: 822 locations
                                                                                                                                                                       • Specialty: 350 locations(2)

                                                                                                                                                                       Largest U.S. states by
                                                                                                                                                                       number of locations(1)
                                                                                                                                                                       •   Texas: 153
                                                                                                                                                                       •   California: 112
                                                                                                                                                                       •   Florida: 67
                                                                                                                                                                       •   Louisiana: 49
                                                                                                                                                                       •   Georgia: 43

                                                       Largest and broadest footprint in North America
(1) As of September 30, 2019, 1,172 locations in North America and 11 in Europe, for total branch count of 1,183.
(2) Specialty includes Tools and Reliable Onsite Services locations that are part of our General Rentals reporting segment. Total branch count of 361, including 11 European locations.

                                                United Rentals, Inc., 100 First Stamford Place, Stamford, CT 06902. © 2018 United Rentals, Inc. All rights reserved.                                      8
Third Quarter 2019 Investor Presentation - Managing Key Value Drivers to Maximize Full Cycle Returns - United Rentals
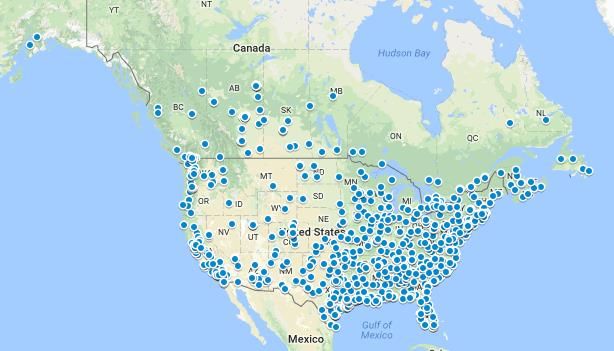
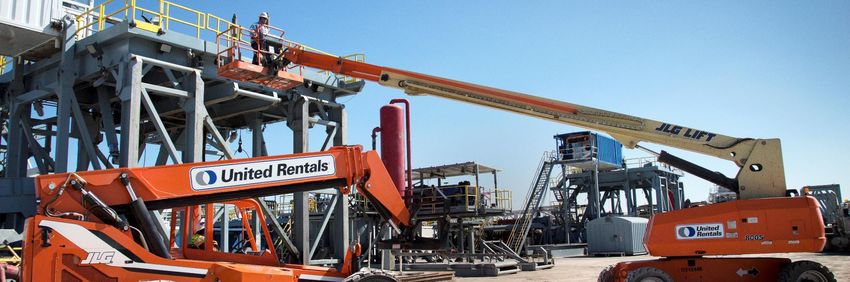
Diverse end-market exposure

                                                                                                                                      Non-Res Construction
                                                                                                                                      Infrastructure
                                                                                                                                      Residential
                                                                                                                                      Upstream O&G
                                                                                                                                      Midstream O&G
                                                                                                                      2018 Revenue    Downstream O&G
                                                                                                                        by Vertical   Chemical Processing
                                                                                                                                      Power
                                                                                                                                      Industrial Manufacturing
                                                                                                                                      Metals & Minerals
                                                                                                                                      Consumer-related
                                                                                                                                      All Other

                        Broad customer base helps reduce volatility

           United Rentals, Inc., 100 First Stamford Place, Stamford, CT 06902. © 2018 United Rentals, Inc. All rights reserved.
                                                                                                                                                                 9
Third Quarter 2019 Investor Presentation - Managing Key Value Drivers to Maximize Full Cycle Returns - United Rentals
A decade of continued financial improvement…
                     Total Revenue                                                                             Adjusted EBITDA(1)                                                            Adjusted EPS(1)

  $9,000M                                                                                    $4,500M                                                                            $18
  $8,000M                                                                                    $4,000M                                                                            $16
                                   CAGR
  $7,000M                                                                                    $3,500M                                   CAGR                                     $14
                                   9.4%                                                                                                                                                                CAGR
  $6,000M                                                                                    $3,000M                                  13.7%                                     $12
                                                                                                                                                                                                      18.6%
  $5,000M                                                                                    $2,500M                                                                            $10
  $4,000M                                                                                    $2,000M                                                                             $8
  $3,000M                                                                                    $1,500M                                                                             $6
  $2,000M                                                                                    $1,000M                                                                             $4
  $1,000M                                                                                      $500M                                                                             $2
        $0                                                                                         $0                                                                            $0                                                 (2)
                      2008              2013               2018                                                        2008                     2013                     2018              2008            2013              2018

    Strong revenue growth                                                                      Powerful EBITDA growth                                                           Meaningful EPS growth
    •   Trailing 5-year CAGR: +10.2%                                                           •    Trailing 5-year CAGR: +11.0%                                                •   Trailing 5-year CAGR: +27.1% vs. +7.2% for the
    •   Trailing 10-year CAGR: +9.4%                                                           •    Trailing 10-year CAGR: +13.7%                                                   S&P 500 over the same period
                                                                                                                                                                                •   Trailing 10-year CAGR: +18.6% vs. +11.6% for the
    Improved diversification                                                                   Sharply higher margins                                                               S&P 500 over the same period
    •   Increased industrial exposure                                                          •    Adj. EBITDA margins almost +200 bps vs. 2013
                                                                                                                                                                                Tax reform to materially benefit future EPS
    •   Increased non-cyclical specialty exposure                                              •    Adj. EBITDA margins up over 1,500 bps vs. 2008

                                        Ongoing transformation of the company’s financial performance
Notes:
(1) Adjusted EBITDA and Adjusted EPS are non-GAAP measures. See the tables provided elsewhere in this presentation for reconciliations to the most comparable GAAP measures.
(2) 2018 reflects a reduction in the U.S. federal corporate statutory rate from 35% to 21% as a result of the Tax Cuts and Jobs Act (the “Tax Act”) enacted in December 2017, which contributed $2.92 of adjusted EPS in 2018.

                                                      United Rentals, Inc., 100 First Stamford Place, Stamford, CT 06902. © 2018 United Rentals, Inc. All rights reserved.
                                                                                                                                                                                                                                          10
…that has ultimately been reflected in free cash flow
 Adjusted
Free Cash                                                             2011-2018 Free Cash Flow Conversion: 103%(2)
Flow ($M)

$1,800

                                                                                                                                                                                    FCF/EBITDA(1)
$1,300                                                                                                                                                                                 27.5%

      $800                                   FCF/EBITDA(1)
                                                20.4%

      $300

 -$200
                 2002        2003         2004        2005              2006              2007              2008              2009              2010              2011       2012    2013   2014    2015   2016   2017   2018

                                                 Durable Free Cash Flow generated throughout the cycle
(1)    Free Cash Flow (FCF) and EBITDA are non-GAAP financial measures. See the Appendix for reconciliations to the most comparable GAAP measures for 2009-2018.
(2)    Reflects average annual adjusted free cash flow relative to reported net income with 2017 net income adjusted to exclude tax reform benefits.

                                                      United Rentals, Inc., 100 First Stamford Place, Stamford, CT 06902. © 2018 United Rentals, Inc. All rights reserved.
                                                                                                                                                                                                                            11
Driving and extending our competitive advantages
• Company transformed to be considerably
  more profitable and efficient

• Operations, technology and culture
  differentiate us, and make us far more agile                                                                                                                     Maximize
                                                                                                                                                                    revenue
                                                                                                                                                                 potential with
• Diversified end-market exposure across customers,                                                                                                              current & new
  verticals and geographies                                                                                                                                       customers

• Strong balance sheet and robust cash generation with
  disciplined approach to smart capital allocation provide                                                                                      Leverage powerful              Leverage growth
  powerful optionality                                                                                                                          cash flow; deliver            through efficiency
                                                                                                                                                    industry                   and productivity
                                                                                                                                                 leading returns                  initiatives
• Focused on balancing growth, margins, returns and FCF
  to maximize long-term value creation for our shareholders

    Operating model supports self-reinforcing growth, margins, returns and cash generation

                         United Rentals, Inc., 100 First Stamford Place, Stamford, CT 06902. © 2018 United Rentals, Inc. All rights reserved.
                                                                                                                                                                                                   12
2                                      End-market overview

United Rentals, Inc., 100 First Stamford Place, Stamford, CT 06902. © 2018 United Rentals, Inc. All rights reserved.
U.S. equipment rental industry overview
          Combined U.S. General Rental and Construction & Industrial Equipment                                                                                                            The U.S. equipment rental market has outgrown its
                              Rental Market Size ($bn)                                                                                                                                    underlying market by over 50% in the last 20 years
                                                                                                                                                                                        400%                  Indexed Growth: US Equipment Rental Market
                                                                                                                                                                                                              Indexed Growth: Total US Construction Spending
 $60B                                                                                                                                                                                   300%
                                                                                                                                   CAGR
                                                                                  20-year                                       since 2009                                              200%
 $50B                                                                             CAGR                                            6.6%                                                  100%
                                                                                   5.3%
                                                                                                                                                                                         0%
 $40B

                                                                                                                                                                                                                                                         2005
                                                                                                                                                                                               1997
                                                                                                                                                                                                       1998
                                                                                                                                                                                                               1999
                                                                                                                                                                                                                      2000
                                                                                                                                                                                                                             2001
                                                                                                                                                                                                                                    2002
                                                                                                                                                                                                                                           2003
                                                                                                                                                                                                                                                  2004

                                                                                                                                                                                                                                                                2006
                                                                                                                                                                                                                                                                        2007
                                                                                                                                                                                                                                                                               2008
                                                                                                                                                                                                                                                                                      2009
                                                                                                                                                                                                                                                                                             2010
                                                                                                                                                                                                                                                                                                    2011
                                                                                                                                                                                                                                                                                                            2012
                                                                                                                                                                                                                                                                                                                   2013
                                                                                                                                                                                                                                                                                                                          2014
                                                                                                                                                                                                                                                                                                                                 2015
                                                                                                                                                                                                                                                                                                                                        2016
                                                                                                                                                                                                                                                                                                                                               2017
                                                                                                                                                                                                                                                                                                                                                      2018
 $30B
                                                                                                                                                                                                         Largest players capturing a growing
                                                                                                                                                                                                      share of the U.S. equipment rental market
 $20B                                                                                                                                                                                          Top 10 U.S. Rental Companies as % of Total Industry Revenues
                                                                                                                                                                                        35%                                                                                                                                               32%
                                                                                                                                                                                                                                                                                                                          30%
                                                                                                                                                                                        30%                                                                            26%            27%                  27%
 $10B                                                                                                                                                                                                                                               24%
                                                                                                                                                                                        25%                       22%               23%
                                                                                                                                                                                               20%
                                                                                                                                                                                        20%
  $0B
                                                                                                                                                                                        15%
                                            2002

                                                                                  2007

                                                                                                                         2012
         1997

                1998

                       1999

                              2000

                                     2001

                                                   2003

                                                          2004

                                                                   2005

                                                                          2006

                                                                                          2008

                                                                                                  2009

                                                                                                          2010

                                                                                                                  2011

                                                                                                                                  2013

                                                                                                                                         2014

                                                                                                                                                 2015

                                                                                                                                                         2016

                                                                                                                                                                2017

                                                                                                                                                                        2018
                                                                                                                                                                                        10%
                                                                                                                                                                                               2010              2011               2012           2013                2014           2015             2016               2017            2018

                                Equipment rental value proposition continues to drive secular penetration
Sources: Company reports, ARA, RER, and U.S. Census Bureau (based on most current data available)

                                                                 United Rentals, Inc., 100 First Stamford Place, Stamford, CT 06902. © 2018 United Rentals, Inc. All rights reserved.                                                                                                                                                                        14
Real total U.S. construction spending climbing…
                               Real total U.S. construction spend per capita                                        10-year avg                          20-year avg   30-year avg   40-year avg
 $6,000

 $5,500

 $5,000

 $4,500

 $4,000

 $3,500

 $3,000

 $2,500
            1964
            1965
            1966
            1967
            1968
            1969
            1970
            1971
            1972
            1973
            1974
            1975
            1976
            1977
            1978
            1979
            1980
            1981
            1982
            1983
            1984
            1985
            1986
            1987
            1988
            1989
            1990
            1991
            1992
            1993
            1994
            1995
            1996
            1997
            1998
            1999
            2000
            2001
            2002
            2003
            2004
            2005
            2006
            2007
            2008
            2009
            2010
            2011
            2012
            2013
            2014
            2015
            2016
            2017
            2018
                              …Yet U.S. construction investment remains below long-term average
Sources: U.S. Census Bureau

                                           United Rentals, Inc., 100 First Stamford Place, Stamford, CT 06902. © 2018 United Rentals, Inc. All rights reserved.
                                                                                                                                                                                                   15
Consensus forecast for U.S. construction put-in-place
                                                                                                                                                                                  Year-over-Year
     Percent Change
                                                                                                                                                                          2019                     2020
     Commercial Total                                                                                                                                                     +3.5%                    +0.6%
     Office                                                                                                                                                               +5.1%                    +1.2%
     Retail and Other Commercial                                                                                                                                          +1.9%                    +0.4%
     Lodging/Hotel                                                                                                                                                        +3.9%                    -0.7%
     Industrial Total                                                                                                                                                     +4.8%                    +2.7%
     Institutional Total                                                                                                                                                  +4.8%                    +2.9%
     Healthcare                                                                                                                                                           +4.0%                    +3.6%
     Education                                                                                                                                                            +5.5%                    +4.1%
     Non-Residential Total                                                                                                                                                +4.4%                    +2.4%
          Consensus High                                                                                                                                                  +6.3%                    +4.5%
          Consensus Low                                                                                                                                                   +3.0%                    -0.9%

                                                                        Growth expected through at least 2020
Source: American Institute of Architects (most recent forecast as of July 17, 2019).
Note: Includes Dodge, IHS Economics, Moody’s Economy, FMI, CMD, Associated Builders & Contractors and Wells Fargo Securities.

                                                   United Rentals, Inc., 100 First Stamford Place, Stamford, CT 06902. © 2018 United Rentals, Inc. All rights reserved.
                                                                                                                                                                                                           16
3                                      Company overview

United Rentals, Inc., 100 First Stamford Place, Stamford, CT 06902. © 2018 United Rentals, Inc. All rights reserved.
Strategic evolution over 20+ years
       1997–2008                                                                              2009–2013                                                   2014–present
Become a market leader                                              Optimize scale, diversify,                                                     Building on and transforming
                                                                    and drive profitable growth                                                    the Core
                                                                                          2009: Increased focus
                                                                                          on customer service and                                        Continued build-up of
      1997: Founded / IPO                                                                 improving returns through                                      GenRent platform
                                                                                          financial and operating
                                                                                          discipline
                                                                                                                                                         Increased focus on Specialty
                                                                                                                                                         business to increase returns
                                                                                          2009–2011: Introduction of                                     and reduce volatility through
      1998–2001: Becomes the
                                                                                          Operation United; focused                                      cross-selling
      largest equipment rental
                                                                                          on process improvements to
      company in North America
                                                                                          streamline branch                                              Development of services
      through ~250 acquisitions
                                                                                          operations & logistics                                         businesses and solutions to
                                                                                                                                                         increase customer relevance
                                                                                                                                                         and competitive differentiation
      2002–2008: Strong organic                                                           2012–2013: Acquisition and
      growth in powerful up cycle                                                         integration of RSC                                             Launch of digital capabilities
                                                                                                                                                         to better serve customers and
                                                                                                                                                         support internal efficiency

                            United Rentals, Inc., 100 First Stamford Place, Stamford, CT 06902. © 2018 United Rentals, Inc. All rights reserved.
                                                                                                                                                                                         18
Growth and margin opportunities

Revenue Related                                                                                                    Cost and Margin Related

 • Capitalize on ongoing secular shift                                                                                 • Further leveraging of LEAN
   towards rental over ownership                                                                                               • Optimization of operating costs (COR & SG&A)
 • Leverage cross-selling to capture more
                                                                                                                               • Continual improvement of labor productivity
   wallet share and maximize cyclical growth
                                                                                                                       • Fixed cost leverage via organic and M&A growth
 • Evolve sales strategies and asset base to
   better serve customers and capture secular                                                                          • Mix shift as Specialty outpaces total growth
   opportunities (infrastructure, digital, etc.)                                                                       • Product and customer mix
 • Differentiate services through new                                                                                  • Further leveraging of technology and systems
   technologies and accelerated innovation
 • Smart M&A

                     Optimizing growth and margins to maximize value creation

                        United Rentals, Inc., 100 First Stamford Place, Stamford, CT 06902. © 2018 United Rentals, Inc. All rights reserved.                                   19
People & culture as differentiating assets
• Highly engaged, committed and diverse workforce
  •   Very strong engagement across all categories inline or better-than Towers Watson US High Performing Company Benchmark
  •   Industry leading low-turnover rate, which helps drive better customer experience via continuity, consistency, and lower costs
  •   Multiple internal communications platforms ensure active 2-way dialogue (town-halls, social media platform, all-employee calls, branch visits, etc.)
  •   Diversity embraced top to bottom with measurable goals and achievement across key groups including Women United, Together United and
      Veteran’s United

• Strong commitment to supporting each other
  •   High participation in employee-managed 501(c)(3) United Compassion Fund which provides financial assistance to those in need
      • Over $2.3 million already allocated to United Rentals’ employees and families in need

• Strong supporter of Veteran Groups
  •   Over 10% of workforce is made up of U.S. and Canadian veterans
  •   Nationally recognized military friendly employer
      • #7 ranked company on G.I. Jobs list for top 100 Military Friendly Employers & #2 for Military Friendly Spouse Employers

• Excellent employee-generated ratings via independent assessments
  •   Peer-best ratings on Glassdoor across key categories including Overall Rating, Recommend to a Friend, CEO Approval, Career Opportunities, etc.
  •   Named to Forbes 2018 global list of “World’s Best Employers”

                            Strong, diverse and committed team of ~19,000 employees
                                  United Rentals, Inc., 100 First Stamford Place, Stamford, CT 06902. © 2018 United Rentals, Inc. All rights reserved.
                                                                                                                                                         20
Competitive positioning aided by structural advantages

    Size, Breadth and                                                  Benefits of Scale,                                                    Investments in
    Diversity of Fleet                                               Scope & Diversification                                                   Technology

     Strong Balance                                           Strong Culture Focused                                                          Proven
    Sheet + Cash Flow                                      on Customers & Shareholders                                                    Management Team

                  Focus on driving and extending our leadership position

                   United Rentals, Inc., 100 First Stamford Place, Stamford, CT 06902. © 2018 United Rentals, Inc. All rights reserved.
                                                                                                                                                              21
Online digital strategy and results

Attract new customers                                                           Accelerate new business                                                           Extend service offerings
• Convenience                                                                   • Simplified experience                                                           • Telematics
• Availability                                                                  • Full visibility                                                                 • Training
• Flexibility                                                                   • Audit Trail                                                                     • Integration
                                                                                                                                                                  • Consumption

       31,000 new customers                                                                    Digital commerce revenue                                              1,000+ customer benchmark
 gained via digital commerce in 2018                                                                  +45% in 2018                                                  assessments performed in 2018
Note: Data presented on an annual basis.

                                           United Rentals, Inc., 100 First Stamford Place, Stamford, CT 06902. © 2018 United Rentals, Inc. All rights reserved.
                                                                                                                                                                                                    22
                                                                                                                                                                                                    20
Total Control®: Adoption Continues to Grow and Deepen

TC Feature Highlights                                                                   Customer Growth 2018                                                 User Adoption 2018
• Rental Fleet Management
                                                                                   TC CUSTOMERS                                                          “Calls for Pick Up”
• Find My Fleet                                                                               Revenue                                     $1.8 billion      via TC and         +32% YoY
                                                                                                                                                          Digital Solutions
• Invoices and bill pay                                                                Total Accounts                                            9,380

• Reporting and KPI metrics
• Advanced Project Tracking                                                                 REVENUE
                                                                                                                                                           Reservations
                                                                                            GROWTH                                                            Placed           +30% YoY
• GPS Alerts                                                                                                                                              Digitally via TC
                                                                                       TC Customers                                              +39%
• Technology integrations, e.g., SAP®
                                                                                    Same Customers                                               +18%

       Providing tangible value for customers and building loyalty to United Rentals

                          United Rentals, Inc., 100 First Stamford Place, Stamford, CT 06902. © 2018 United Rentals, Inc. All rights reserved.
                                                                                                                                                                                          23
Telematics & FAST
                                                                                                                                              Field Automation
   Telematics & Related Technologies
                                                                                                                                        Systems & Technologies (FAST)
 Internal Benefits:                                                                                                      Internal Benefits:

   – Performance monitoring and service alerts                                                                                     – Increased driver and dispatcher productivity

   – More efficient location and pick-up capabilities                                                                              – Improved fleet efficiency

   – Overtime and revenue recovery                                                                                                 – Reduced fuel consumption

                                                                                                                                   – Safety benefits
 Customer Benefits:
                                                                                                                                   – Environmental benefits
   – Visibility into equipment utilization

   – Ability to more easily locate equipment

   – Billing and Account access

   – Fuel alerts

         Using technology to drive greater efficiencies and improve customer experience

                              United Rentals, Inc., 100 First Stamford Place, Stamford, CT 06902. © 2018 United Rentals, Inc. All rights reserved.
                                                                                                                                                                                    24
Investing in Specialty services

Trench Safety                 Power & HVAC                                                    Fluid Solutions                                            Tool Solutions                  Onsite Services
• Excavation support          • Complete solutions for                                        • Full range of equipment                                  • Tool trailers stocked         • Plastic port-a-potties,
  solutions, confined space     mobile power and air flow                                       to contain, transfer, and                                  with hoisting, torqueing,       luxury restroom trailers,
  entry equipment and                                                                           treat fluids                                               pipe fitting, and air tools     sinks, and showers
  customer training           • Used for disaster
                                response,                                                     • Used by municipalities,                                  • Used during refinery          • Core rental item used
• Used for construction,        plant shut downs,                                               industrial plants, and                                     and other industrial            across all types of
  utility installs, manhole     commercial renovations,                                         mining, construction,                                      shutdowns, and also at          special events,
  work, and other               and seasonal                                                    municipal and agri-                                        large construction sites        construction sites, and
  underground applications      climate control                                                 business customers                                                                         industrial projects

                     Aggressive growth in Specialty improves returns with reduced volatility

                                  United Rentals, Inc., 100 First Stamford Place, Stamford, CT 06902. © 2018 United Rentals, Inc. All rights reserved.
                                                                                                                                                                                                                25
(1)
Specialty provides strong growth opportunities

                                                                                                                                                                                                          $1,904M
                                                                                                                                                                                           $1,719M         $184M

                                                                                                                                                                                $1,254M
                                                                                                                                                                     $1,021M
                                                                                                                                   $931M
                                                                                                 $823M

                                                              $471M
                                  $297M

                                    2012                        2013                                2014                             2015                                2016    2017        2018           2018
                                                                                                                                                                                                                    (2)
                                                                                                                                                                                          As Reported     Pro Forma

 Specialty as a %
 Total Revenues
                                     7.2%                        9.5%                             14.5%                              16.0%                              17.7%    18.9%      21.4%          21.4%

               Specialty represented ~21% of total revenue in 2018 on a path to a $2 billion+ target

(1) Tool Solutions was added in 2013 and Fluid Solutions was added in April 2014.
(2) 2018 pro forma includes full-year impact of BlueLine and BakerCorp acquisitions.
Note: Data includes 1) Fluid Solutions, Trench Safety and Power & HVAC and 2) Reliable Onsite Services and Tools revenues, which are included in our General Rentals reporting segment.

                                                         United Rentals, Inc., 100 First Stamford Place, Stamford, CT 06902. © 2018 United Rentals, Inc. All rights reserved.
                                                                                                                                                                                                                          26
Capital allocation strategy

                    Manage                                                                                                                                                                   Return Excess
                    Leverage                                                                                        Invest in Growth                                                         Cash to
                                                                                                                                                                                             Stockholders
  • Target leverage range over                                                                                                                                                      • $1.25 billion repurchase
      the cycle of 2.0x–3.0x.                                                                           Organic                                                          M&A         program commenced in July
  • Net       leverage(1)
                    of 2.7x                                                                                                                                                          2018. $1.050 billion purchased
                                                                                   • Continued organic                                                • Balance sheet strategy
      at September 30, 2019.                                                                                                                                                         through September 30, 2019.
                                                                                       investments to support                                             creates flexibility to
  • Credit ratings:                                                                    growth and boost                                                   pursue strategic assets   • Since 2012, United Rentals has
                                                                                       productivity.                                                      as opportunities arise.    returned $3.5 billion to
              • S&P: BB
                                                                                   • Opened 30 specialty                                              • Acquisition of National      shareholders, representing 33%
              • Moody’s: Ba2                                                           branches in 2018.                                                  Pump in 2014 and           of total issued shares.
                                                                                       Opened 32 through                                                  BakerCorp in 2018
                                                                                       September 30, 2019.                                                expanded specialty.
                                                                                                                                                      • Acquisitions of NES
                                                                                                                                                          and Neff in 2017 and
                                                                                                                                                          BlueLine in 2018 to
                                                                                                                                                          support our ‘grow the
                                                                                                                                                          core’ strategy.

                         Disciplined, prudent, efficient, and opportunistic approach to capital allocation
(1)   Leverage ratio calculated as total debt, net of cash, excluding original issuance discounts, premiums, and deferred financing, divided by adjusted EBITDA.

                                                          United Rentals, Inc., 100 First Stamford Place, Stamford, CT 06902. © 2018 United Rentals, Inc. All rights reserved.
                                                                                                                                                                                                                       27
M&A strategy: Disciplined and opportunistic

             Strategic                                                                            Financial                                                      Cultural

• Proactively supports growth in                                   • Invest capital at attractive returns                                           • Safety
  attractive markets                                                 over cycle
                                                                                                                                                    • Talent
• Difficult to replicate organically                                   • Revenue growth
                                                                       • Margin opportunities                                                       • Ethics and integrity
• Access to new customers
                                                                       • Manage leverage                                                            • Management philosophy
• Enhance cross-selling
                                                                       • Internal Rate of Return                                                    • Customer focus
• Best practice adoption
                                                                       • ROIC
• Geographic coverage                                                                                                                               • Community
                                                                       • Volatility
• Diversification

     Proven integration capabilities are a key advantage in realizing greater value from M&A

                             United Rentals, Inc., 100 First Stamford Place, Stamford, CT 06902. © 2018 United Rentals, Inc. All rights reserved.
                                                                                                                                                                              28
Record of value creation through M&A
        RSC               National Pump                                           NES                                      Neff Rentals                     BakerCorp                   BlueLine
       (2012)                 (2014)                                             (2017)                                      (2017)                           (2018)                     (2018)
 • Size: $4.2B            • Size: $780M                               • Size: $965M                                     • Size: $1.3B                    • Size: $720M            • Size: $2.1B
   transaction value        transaction value                           transaction value                                 transaction value                transaction value        transaction value
   (cash and stock)         (cash)                                      (cash)                                            (cash)                           (cash)                   (cash)
 • Type: ‘Grow-the-       • Type: Specialty                           • Type: ‘Grow-the-                                • Type: ‘Grow-the-               • Type: Specialty        • Type: ‘Grow-the-
   core’ gen rent           adjacency in the                            core’ gen rent                                    core’ gen rent                   adjacency in the         core’ gen rent
   acquisition              pump rental sector                          acquisition                                       acquisition                      fluid control sector     acquisition
 • Rationale: Positions   • Rationale: Expand                         • Rationale:                                      • Rationale:                     • Rationale: Expand      • Rationale: Bolstered
   URI as leader in         offerings in higher                         Strengthened aerial                               Introduced new dirt              offerings in higher      URI’s position as a
   North American           margin / return                             capabilities and                                  capabilities and                 return and lower         leader in the North
   rental industry          assets                                      added two-way                                     expertise in                     volatility assets        American rental
                                                                        cross-selling                                     infrastructure;                • Value: Targeted          industry while also
 • Value: Targeted        • Value: Delivered on
                                                                        opportunities                                     provided two-way                 $19M cost savings        adding to presence
   $200M cost savings       growth thesis by
                                                                                                                          cross-selling                    and $60M of cross-       with local and mid-
   from branch              capitalizing on                           • Value: Targeted
                                                                                                                          opportunities                    sell revenue             sized customer
   consolidation and        cross-selling                               $40M cost savings
                                                                                                                                                           opportunity              segment
   overhead                 opportunity                                 and $35M of revenue                             • Value: Targeted
   rationalization          • Secured foothold                          cross-sell opportunity                            $35M cost savings                                       • Value: Targeting
   • Exceeded initial          in energy-related                                                                          and $15M of revenue                                       $45M cost savings
       cost savings            end markets                                                                                cross-sell opportunity                                    and $35M of cross-
       estimates -                                                                                                                                                                  sell revenue
                            •   Strongly
       Raised target to                                                                                                                                                             opportunity
                                diversified into
       $230M - $250M                                                                                                                                                                •   First phase of
                                core construction                                                                                                                                       integration largely
                                and industrial                                                                                                                                          complete
                                markets

  With 20 years of execution experience for 275+ transactions, team has successfully integrated
   assets in different environments and across the spectrum from bolt-ons to transformational
                                  United Rentals, Inc., 100 First Stamford Place, Stamford, CT 06902. © 2018 United Rentals, Inc. All rights reserved.
                                                                                                                                                                                                              29
4                                      Summary of key
                                       financial data

United Rentals, Inc., 100 First Stamford Place, Stamford, CT 06902. © 2018 United Rentals, Inc. All rights reserved.
Key financial results snapshot
                                                                                                                                                                                                  Adjusted Earnings per Share
                     Total Revenue ($M)                                                                         Adjusted EBITDA(1) ($M)
                                                                                                                                                                                                           (EPS)(1,2)
     2018 5-Year CAGR:                       2019 Implied Growth:                                  2018 5-Year CAGR:                                  2019 Implied Growth:                               2018 5-Year CAGR:
          +10.2%                                   +15.6%                                               +11.0%                                               +13.3%                                            27.1%

$10,000
                                                                                             $5,000                                                                                         $18
 $9,000                                                                                      $4,500                                                                                         $16
 $8,000                                                                                      $4,000                                                                                         $14
 $7,000                                                                                      $3,500
                                                                                                                                                                                            $12
 $6,000                                                                                      $3,000
                                                                                                                                                                                            $10
 $5,000                                                                                      $2,500
                                                                                                                                                                                             $8
 $4,000                                                                                      $2,000
                                                                                                                                                                                             $6
 $3,000                                                                                      $1,500
 $2,000                                                                                      $1,000                                                                                          $4

 $1,000                                                                                         $500                                                                                         $2

     $0                                                                                            $0                                                                                        $0
             2014        2015       2016        2017        2018         2019F
                                                                                  3                          2014            2015           2016           2017           2018    2019F 3         2014    2015          2016        2017   2018

                                         Robust growth and increased profitability across the current cycle
  Notes:
  (1) Adjusted EBITDA and Adjusted EPS are non-GAAP measures. See the tables provided elsewhere in this presentation for reconciliations to the most comparable GAAP measures.
  (2) 2017 EPS excludes a one-time benefit from the Tax Act of $8.05. 2018 reflects a reduction in the U.S. federal corporate statutory rate from 35% to 21% as a result of the Tax Act, which contributed $2.92 of adjusted EPS.
  (3) 2019F reflects the mid-point of guidance.

                                                           United Rentals, Inc., 100 First Stamford Place, Stamford, CT 06902. © 2018 United Rentals, Inc. All rights reserved.
                                                                                                                                                                                                                                              31
Structural changes are key to increased margins
                                     Adjusted EBITDA Margin (%)
                                                                                                                                                                              Key Drivers of Margin Gains
        Adjusted EBITDA margins
       +1,400 bps above prior peak
                                                                                                                                                                        • Strong fixed-cost absorption
60%
                                                                                                                                                                          • Cyclical leverage (e.g., SG&A as % of sales)
50%                                                                                                                                                                       • M&A cost synergies (e.g., RSC, NES, Neff)

40%                                                                                                                                                                     • Operational efficiency gains
                                                                                                                                                                          • Process improvements (e.g., LEAN, 5S, etc.)
30%
                                                                                                                                                                          • Technology (e.g., logistics, CORE, telematics)
20%
                                                                                                                                                                        • Improved mix
10%                                                                                                                                                                       • Shift towards higher margin Specialty
0%
                                                                                                                                                                          • Improved segment/end-market mix
        2008       2009      2010       2011   2012       2013          2014           2015          2016          2017          2018         2019F                       • De-emphasis of low margin/return businesses

                                                                                                                                                                        • Improved used equipment sales strategies

                                                        Dramatic cycle-over-cycle margin improvement
Note: 2019F reflects mid-point of guidance.

                                                 United Rentals, Inc., 100 First Stamford Place, Stamford, CT 06902. © 2018 United Rentals, Inc. All rights reserved.
                                                                                                                                                                                                                             32
Consistent free cash flow generation

$1,600
                                                                                                                                                                                                                                                                                $1,500
$1,400
                                                                                                                                                                                                                                                        $1,334
                                                                                                                                                                                                          $1,195
$1,200

                                                                                                                                                                                                                                  $983
$1,000
                                                                                                                                                                                    $924

 $800

 $600                                                                                                                                                        $574

                                                                                                                                      $421
 $400                                       $367
                  $335
                                                                $227
 $200
                                                                                        $23                   $(73)
    $0
                                                                                                                                                                                                                                                                                           (3)
-$200
                 2008                   2009                   2010                   2011                   2012                    2013                   2014                   2015                   2016                    2017                   2018                  2019F

                                                                                                                                                                                                                                                             (2)
                                  $5.0B of free cash flow generated over last 5 years, with a strong outlook
 Notes:
 (1) Free cash flow is a non-GAAP measure. See tables provided elsewhere in this presentation for reconciliations to the most comparable GAAP measure. Merger and restructuring related payments were first reported for 2012. The information required to determine the amount of merger and restructuring
 related payments for periods prior to 2012 is unavailable without unreasonable effort. Free cash flow for 2012 and subsequent periods above excludes merger and restructuring related payments.

 (2) Reflects 5 year period from 2014 to 2018, excluding merger and restructuring related payments.

 (3) 2019F reflects mid-point of guidance

                                                                                                                                                                                                                                                                                                 33
3Q Results

                                                                                                                                               • $2.488 billion (17.6% Y/Y as reported; +5.3% Y/Y
   Total Revenue
                                                                                                                                                      pro forma*)

                                                                                                                                               • $1.207 billion (48.5% margin; -150 bps Y/Y as
   Adjusted EBITDA**
                                                                                                                                                      reported; -40 bps Y/Y pro forma*)

                                                                                                                                               • $1.387 billion, after gross purchases of $1.974
   Net Rental Capital Expenditures (YTD)
                                                                                                                                                      billion

   Net Cash Provided by Operating Activities
                                                                                                                                               • $2.582 billion
   (YTD)

   Free Cash Flow** (YTD)                                                                                                                      • $1.104 billion***

 *Pro forma reflects the combination of United Rentals, BakerCorp and BlueLine for 2018.

**Adjusted EBITDA and Free Cash Flow are non-GAAP measures. See the tables provided elsewhere in this presentation for reconciliations to the most comparable GAAP measures.
***Excludes aggregate merger and restructuring related payments of $22M.

                                                         United Rentals, Inc., 100 First Stamford Place, Stamford, CT 06902. © 2018 United Rentals, Inc. All rights reserved.
                                                                                                                                                                                                    34
2019 Financial outlook

  Total Revenue                                                                                                                          • $9.25 billion to $9.35 billion

  Adjusted EBITDA*                                                                                                                       • $4.35 billion to $4.4 billion

                                                                                                                                         • $1.25 billion to $1.35 billion, after gross
  Net Rental Capital Expenditures
                                                                                                                                                purchases of $2.05 billion to $2.15 billion

  Net Cash Provided by Operating Activities                                                                                              • $2.9 billion to $3.05 billion

  Free Cash Flow*                                                                                                                        • $1.45 billion to $1.55 billion**

*Adjusted EBITDA and Free Cash Flow are non-GAAP measures. See the table provided elsewhere in this presentation for a reconciliation of forecasted Free Cash Flow to the most comparable GAAP measure. Information
reconciling forecasted adjusted EBITDA to the most comparable GAAP financial measures is unavailable to the company without unreasonable effort, as discussed in the “Introductory Information” slide.
**Excludes merger and restructuring related payments. FCF outlook assumptions include 2019 cash taxes of $235M and cash interest of $565M.

                                                   United Rentals, Inc., 100 First Stamford Place, Stamford, CT 06902. © 2018 United Rentals, Inc. All rights reserved.
                                                                                                                                                                                                                      35
Fleet productivity: overview
• Fleet Productivity provides greater insight into the interplay and combined impact of key decisions made by
  managers every day across (a) rental rates, (b) time utilization, and (c) changes in mix on our Owned
  Equipment Rental Revenue (i.e., the revenue we generate with our owned rental assets).
  • Mix includes impact of changes in customer mix, fleet mix, geographic mix and business mix (i.e., Specialty).

  Fleet Productivity is a metric that better explains how the combined changes in rental rates, time utilization,
  and mix come together to produce revenue and how management flexes the combination of these factors to
  drive efficient growth and benefits returns.

• Fleet Productivity is a comprehensive measure that combines the impact of the change in rental rates plus
  the impact of changes in time utilization plus the revenue impact from changes in mix in one metric.

 Fleet Productivity provides better insight into the decisions made to optimize growth and returns

                            United Rentals, Inc., 100 First Stamford Place, Stamford, CT 06902. © 2018 United Rentals, Inc. All rights reserved.
                                                                                                                                                   36
Fleet productivity: historical results                                                                                                                                                      (1)

                                                                                                                      As Reported Historical Results
                                      Actual YoY                         Assumed YoY Impact of
                                                                                                                                                       Fleet                                              Contribution from                             Reported YoY Change
                                      Change in                          OEC Inflation on Rental
                                                                                                                                                   Productivity(2)                                       Ancillary and Re-Rent                           in Rental Revenue
                                     Average OEC                               Revenue
  1Q 2016                                   2.8%                                          (1.5%)                                                           (2.3%)                                                     0.3%                                          (0.7%)
  2Q 2016                                   1.6%                                          (1.5%)                                                           (1.7%)                          **                         0.3%                                          (1.3%)
  3Q 2016                                   1.7%                                          (1.5%)                                                           (1.1%)                                                     0.5%                                          (0.3%)
  4Q 2016                                   2.6%                                          (1.5%)                                                            0.8%                                                     (0.3%)                                          1.6%
  1Q 2017                                   3.9%                                          (1.5%)                                                            1.4%                                                      0.6%                                           4.4%
  2Q 2017(3)                               14.3%                                          (1.5%)                                                            0.7%         * (NES)                                      0.1%                                          13.5%
                                                                                                                                                                        * (NES)
  3Q 2017         *                        15.7%                                          (1.5%)                                                            1.7%                                                      0.3%                                          16.2%
  4Q 2017(3)                               27.5%                                          (1.5%)                                                            0.5% * *(Neff)
                                                                                                                                                                     (Neff)                                           0.3%                                          26.8%
  1Q 2018
                  *                        27.7%                                          (1.5%)                                                           (0.8%)                                                    (0.3%)                                         25.1%
  2Q 2018                                  16.2%                                          (1.5%)                                                            4.5%                                                      0.1%                                          19.3%
                                                                                                                                                                 * (BakerCorp)
  3Q 2018(3)      *                        19.5%                                          (1.5%)                                                            2.3% * (BakerCorp)
                                                                                                                                                                 * (BlueLine)
                                                                                                                                                                                                                      0.8%                                          21.2%
  4Q 2018(3)      *                        18.8%                                          (1.5%)                                                            1.5% * (BlueLine)                                         2.0%                                          20.8%
  1Q 2019                                  23.7%                                          (1.5%)                                                           (1.3%)                                                     2.1%                                          23.0%
  2Q 2019                                  23.2%                                          (1.5%)                                                           (3.1%)                                                     1.6%                                          20.2%
  3Q 2019                                  18.1%                                          (1.5%)                                                           (1.3%)                                                     0.1%                                          15.4%

  3Q 2019 PF(4)                             4.4%                                         (1.5%)                                                             1.7%                                                     (0.4%)                                          4.2%
(1)   Provided on an As Reported basis, except as otherwise noted.                                                                                           (3)    Denotes quarter in which URI closed a material acquisition (NES = 2Q17; Neff = 4Q17; BakerCorp = 3Q18; BlueLine = 4Q18).
(2)   Fleet Productivity reflects the combined impact of changes in rental rates, time utilization, and mix that contribute to                               (4)    Provided on a Pro Forma basis, as if BakerCorp and BlueLine had been acquired January 1, 2018.
      Owned Equipment Rental revenue (OER).

                                                                United Rentals, Inc., 100 First Stamford Place, Stamford, CT 06902. © 2018 United Rentals, Inc. All rights reserved.
                                                                                                                                                                                                                                                                                       37
Balance sheet strength continues to improve
                              (1)
      Leverage Ratio
                                                                                                                                 Actual                 Forecast
                   (2)
           4.6x

                                             (3)
                                    3.6x
                                                                                                                                                                                                        (5)
                                                              3.0x                                                                                                                         (4)   3.1x
                                                                                              2.9x                            2.8x                                                  2.9x                       2.8x
                                                                                                                                                                                                                      (6)
                                                                                                                                                              2.7x
                                                                                                                                                                                                                            ~2.6x

          2011                      2012                     2013                            2014                            2015                            2016                   2017         2018         2018PF        2019F

                                                            2.0x – 3.0x targeted leverage range across the cycle
(1)   Leverage Ratio calculated as total debt and QUIPs, net of cash, excluding original issuance discounts, premiums, and deferred financing divided by adjusted EBITDA.
(2)   Pro Forma assumes RSC acquisition occurred on January 1, 2011 and excludes cost synergies.
(3)   Pro Forma assumes RSC acquisition occurred on January 1, 2012.
(4)   Reflects leverage as reported, which includes borrowings related to the acquisitions of both NES and Neff without full-year benefits of EBITDA contribution.
(5)   Reflects leverage as reported, which includes borrowings related to the acquisitions of both Baker and BlueLine without full-year benefits of EBITDA contribution.
(6)   Reflects leverage pro forma, which includes borrowings related to the acquisitions of both Baker and BlueLine and assumes full-year benefits of EBITDA contribution from those acquisitions.

                                                             United Rentals, Inc., 100 First Stamford Place, Stamford, CT 06902. © 2018 United Rentals, Inc. All rights reserved.
                                                                                                                                                                                                                                    38
No maturities of long-term debt until 2023 ($M)
                                                                                                                                                                                                            Total Liquidity of $2.161B***

5000                                                                                                                                                                                                      Fixed vs. Floating Ratio: 70%/30%
4500
4000                                                                                                                         $3,750
3500
3000                                                                                                                        $2,051
                                                                                                                          Unused ABL                   $2,540
                                                                                                                            Facility
2500
                                                                                                                                                           $990                   $2,100
2000                                                                                                                                                       Term
                                                                                                                                                          Loan B                    $1,100                  $1,673
                                                                                                                                                                                     6.5%
1500                                                                                                                                                       $750
                                                                                                                                                                                   Senior
                                                                                                                                                                                  Unsecured
                               $975                                                               $1,000                                             4.625% Senior                  Notes     $1,000
                                                                                                                                                       Unsecured                                             4.875%**
1000                        $50 A/R Unused
                                                                                                                             $1,699*
                                                                                                                                                         Notes                                                Senior               $750
                                                                                                  4.625%                    Used ABL                                                $1,000
                                                                                                                                                          $800                                  5.5%        Unsecured
                                $925                                                               Senior                    Facility                                              5.875%                                           5.25%
                                                                                                                                                                                               Senior          Notes
 500                            A/R                                                               Secured
                                                                                                                                                          5.5%
                                                                                                                                                         Senior
                                                                                                                                                                                    Senior
                                                                                                                                                                                              Unsecured                            Senior
                           Securitization                                                          Notes                                               Unsecured
                                                                                                                                                                                  Unsecured                                       Unsecured
                               Used                                                                                                                                                 Notes       Notes
                                                                                                                                                         Notes                                                                      Notes
   0
            2019               2020               2021                   2022                       2023                      2024                       2025                      2026        2027          2028       2029       2030

                                                   Long-term debt maturities extend well into the next decade
       Note: as of September 30, 2019.
         *Includes $57M in Letters of Credit.
        **Comprised of two separate 4.875% notes, a note with $1,669M principal amount and a note with $4M principal amount.
       ***Includes total cash, cash equivalents and availability under ABL and AR facilities.

                                                           United Rentals, Inc., 100 First Stamford Place, Stamford, CT 06902. © 2018 United Rentals, Inc. All rights reserved.
                                                                                                                                                                                                                                              39
5                                      Appendix

United Rentals, Inc., 100 First Stamford Place, Stamford, CT 06902. © 2018 United Rentals, Inc. All rights reserved.
Adjusted Earnings Per Share GAAP Reconciliation
      We define “earnings per share – adjusted” as the sum of earnings per share – GAAP, as-reported plus the impact of the following special items: merger related costs, merger related intangible asset amortization, impact on depreciation
      related to acquired fleet and property and equipment, impact of the fair value mark-up of acquired fleet, restructuring charge, asset impairment charge and loss on repurchase/redemption of debt securities and amendment of ABL facility.
      Management believes that earnings per share - adjusted provides useful information concerning future profitability. However, earnings per share - adjusted is not a measure of financial performance under GAAP. Accordingly, earnings per
      share - adjusted should not be considered an alternative to GAAP earnings per share. The table below provides a reconciliation between earnings per share – GAAP, as-reported, and earnings per share – adjusted.

                                                                                                                                                                                       Three Months Ended             Nine Months Ended
                                                     $ Millions                                                                                                                             September 30,               September 30,

                                                                                                                                                                                        2019             2018         2019           2018
                                                      Earnings per share - GAAP, as-reported
                                                                                                                                                                                   $        5.08     $   4.01     $   10.66      $    9.34
                                                      After-tax impact of:

                                                      Merger related costs (2)
                                                                                                                                                                                             —           0.09          0.01           0.12
                                                      Merger related intangible asset amortization (3)
                                                                                                                                                                                            0.63         0.42          1.90           1.18
                                                      Impact on depreciation related to acquired fleet and property and equipment (4)
                                                                                                                                                                                            0.07         0.02          0.33           0.19
                                                      Impact of the fair value mark-up of acquired fleet (5)
                                                                                                                                                                                            0.14         0.11          0.55           0.47
                                                      Restructuring charge (6)
                                                                                                                                                                                            0.02         0.09          0.15           0.13
                                                      Asset impairment charge (7)
                                                                                                                                                                                            0.02            —          0.06             —
                                                      Loss on repurchase/redemption of debt securities and amendment of ABL facility
                                                                                                                                                                                             —              —          0.30             —
                                                      Earnings per share - adjusted
                                                                                                                                                                                   $        5.96     $   4.74     $   13.96      $   11.43
                                                      Tax rate applied to above adjustments (1)
                                                                                                                                                                                            25.1 %       25.4 %        25.3 %         25.3 %

(1)     The tax rates applied to the adjustments reflect the statutory rates in the applicable entities.                                                                        (4)     Reflects the impact of extending the useful lives of equipment acquired in the RSC, NES, Neff, BakerCorp and BlueLine
(2)     Reflects transaction costs associated with the NES, Neff, BakerCorp and BlueLine acquisitions. We have made a number of acquisitions in the                                     acquisitions, net of the impact of additional depreciation associated with the fair value mark-up of such equipment.
        past and may continue to make acquisitions in the future. Merger related costs only include costs associated with major acquisitions that                               (5)     Reflects additional costs recorded in cost of rental equipment sales associated with the fair value mark-up of rental
        significantly impact our operations. The historic acquisitions that have included merger related costs are RSC, which had annual revenues of                                    equipment acquired in the RSC, NES, Neff and BlueLine acquisitions and subsequently sold.
        approximately $1.5 billion prior to the acquisition, and National Pump, which had annual revenues of over $200 million prior to the acquisition.                        (6)     Primarily reflects severance and branch closure charges associated with our closed restructuring programs and our current
        NES had annual revenues of approximately $369 million, Neff had annual revenues of approximately $413 million, BakerCorp had annual                                             restructuring program. We only include such costs that are part of a restructuring program as restructuring charges. Since the
        revenues of approximately $295 million and BlueLine had annual revenues of approximately $786 million.                                                                          first such restructuring program was initiated in 2008, we have completed four restructuring programs. We have cumulatively
(3)     Reflects the amortization of the intangible assets acquired in the RSC, National Pump, NES, Neff, BakerCorp and BlueLine acquisitions.                                          incurred total restructuring charges of $331 million under our restructuring programs.
.                                                                                                                                                                               (7)     Reflects write-offs of leasehold improvements and other fixed assets.

                                                                     United Rentals, Inc., 100 First Stamford Place, Stamford, CT 06902. © 2018 United Rentals, Inc. All rights reserved.
                                                                                                                                                                                                                                                                                                    41
EBITDA and Adjusted EBITDA GAAP Reconciliations
EBITDA represents the sum of net income, provision for income taxes, interest expense, net, depreciation of rental equipment, and non-rental depreciation and amortization. Adjusted EBITDA represents EBITDA plus the sum of the merger
related costs, restructuring charge, stock compensation expense, net, and the impact of the fair value mark-up of acquired fleet. These items are excluded from adjusted EBITDA internally when evaluating our operating performance and for
strategic planning and forecasting purposes, and allow investors to make a more meaningful comparison between our core business operating results over different periods of time, as well as with those of other similar companies. The
EBITDA and adjusted EBITDA margins represent EBITDA or adjusted EBITDA divided by total revenue. Management believes that EBITDA and adjusted EBITDA, when viewed with the Company’s results under GAAP and the
accompanying reconciliation, provide useful information about operating performance and period-over-period growth, and provide additional information that is useful for evaluating the operating performance of our core business without
regard to potential distortions. Additionally, management believes that EBITDA and adjusted EBITDA help investors gain an understanding of the factors and trends affecting our ongoing cash earnings, from which capital investments are
made and debt is serviced.

The table below provides a reconciliation between net income and EBITDA and adjusted EBITDA.
                                                                                                                                                                                 Three Months Ended               Nine Months Ended
                                               $ Millions                                                                                                                             September 30,                  September 30,
                                                                                                                                                                                     2019           2018           2019            2018
                                               Net income
                                                                                                                                                                             $         391      $     333     $       836      $      786
                                               Provision for income taxes
                                                                                                                                                                                       119            127             245             265
                                               Interest expense, net
                                                                                                                                                                                       147            118             478             339
                                               Depreciation of rental equipment
                                                                                                                                                                                       417            343           1,211             988
                                               Non-rental depreciation and amortization
                                                                                                                                                                                       102             75             311             213
                                               EBITDA (A)
                                                                                                                                                                             $       1,176      $     996     $     3,081      $    2,591
                                               Merger related costs (1)
                                                                                                                                                                                        —              11                 1             14
                                               Restructuring charge (2)
                                                                                                                                                                                            2           9              16               15
                                               Stock compensation expense, net (3)
                                                                                                                                                                                        14             30              45               73
                                               Impact of the fair value mark-up of acquired fleet (4)
                                                                                                                                                                                        15             13              58               53
                                               Adjusted EBITDA (B)
                                                                                                                                                                             $       1,207      $   1,059     $     3,201      $    2,746

 A) Our EBITDA margin was 47.3% and 47.1% for the three months ended September 30, 2019 and 2018, respectively, and 44.7% and 45.1% for the nine months ended September 30, 2019 and 2018, respectively.
 B) Our adjusted EBITDA margin was 48.5% and 50.0% for the three months ended September 30, 2019 and 2018, respectively, and 46.4% and 47.8% for the nine months ended September 30, 2019 and 2018, respectively.

(1)   Reflects transaction costs associated with the NES, Neff, BakerCorp and BlueLine acquisitions. We have made a number of acquisitions in the                      (2)       Primarily reflects severance and branch closure charges associated with our closed restructuring programs and our current
      past and may continue to make acquisitions in the future. Merger related costs only include costs associated with major acquisitions that                                  restructuring program. We only include such costs that are part of a restructuring program as restructuring charges. Since
      significantly impact our operations. The historic acquisitions that have included merger related costs are RSC, which had annual revenues of                               the first such restructuring program was initiated in 2008, we have completed four restructuring programs. We have
      approximately $1.5 billion prior to the acquisition, and National Pump, which had annual revenues of over $200 million prior to the acquisition.                           cumulatively incurred total restructuring charges of $331 million under our restructuring programs.
      NES had annual revenues of approximately $369 million, Neff had annual revenues of approximately $413 million, BakerCorp had annual                              (3)       Represents non-cash, share-based payments associated with the granting of equity instruments.
      revenues of approximately $295 million and BlueLine had annual revenues of approximately $786 million.                                                           (4)       Reflects additional costs recorded in cost of rental equipment sales associated with the fair value mark-up of rental
                                                                                                                                                                                 equipment acquired in the RSC, NES, Neff and BlueLine acquisitions and subsequently sold.

                                                              United Rentals, Inc., 100 First Stamford Place, Stamford, CT 06902. © 2018 United Rentals, Inc. All rights reserved.
                                                                                                                                                                                                                                                                                              42
Reconciliation of Net Cash Provided by Operating Activities
      to EBITDA and Adjusted EBITDA
      The table below provides a reconciliation between net cash provided by operating activities and EBITDA and adjusted EBITDA.

                                                                                                                                                                                 Three Months Ended           Nine Months Ended
                                                                    $ Millions                                                                                                       September 30,              September 30,
                                                                                                                                                                                    2019            2018       2019         2018
                                                                    Net cash provided by operating activities
                                                                                                                                                                                $     992       $    474     $ 2,582    $   2,123
                                                                    Adjustments for items included in net cash provided by operating activities but excluded
                                                                    from the calculation of EBITDA:
                                                                    Amortization of deferred financing costs and original issue discounts
                                                                                                                                                                                        (3)            (3)       (11)           (9)
                                                                    Gain on sales of rental equipment
                                                                                                                                                                                        76            57        224           196
                                                                    Gain on sales of non-rental equipment
                                                                                                                                                                                        —               1          3               4
                                                                    Gain on insurance proceeds from damaged equipment
                                                                                                                                                                                            6           4        18             18
                                                                    Merger related costs (1)
                                                                                                                                                                                        —             (11)        (1)         (14)
                                                                    Restructuring charge (2)
                                                                                                                                                                                        (2)            (9)       (16)         (15)
                                                                    Stock compensation expense, net (3)
                                                                                                                                                                                       (14)           (30)       (45)         (73)
                                                                    Loss on repurchase/redemption of debt securities and amendment of ABL facility
                                                                                                                                                                                        —              —         (32)           —
                                                                    Changes in assets and liabilities
                                                                                                                                                                                       (81)          336        (217)         (68)
                                                                    Cash paid for interest
                                                                                                                                                                                      179            166        480           379
                                                                    Cash paid for income taxes, net
                                                                                                                                                                                        23            11         96             50
                                                                    EBITDA                                                                                                      $ 1,176         $    996     $ 3,081    $   2,591
                                                                    Add back:
                                                                    Merger related costs (1)
                                                                                                                                                                                        —             11           1            14
                                                                    Restructuring charge (2)
                                                                                                                                                                                            2           9        16             15
                                                                    Stock compensation expense, net (3)
                                                                                                                                                                                        14            30         45             73
                                                                    Impact of the fair value mark-up of acquired fleet (4)
                                                                                                                                                                                        15            13         58             53
                                                                    Adjusted EBITDA                                                                                             $ 1,207         $   1,059    $ 3,201    $   2,746

(1)   Reflects transaction costs associated with the NES, Neff, BakerCorp and BlueLine acquisitions. We have made a number of acquisitions in the                        (2)     Primarily reflects severance and branch closure charges associated with our closed restructuring programs and our current
      past and may continue to make acquisitions in the future. Merger related costs only include costs associated with major acquisitions that                                  restructuring program. We only include such costs that are part of a restructuring program as restructuring charges. Since the first
      significantly impact our operations. The historic acquisitions that have included merger related costs are RSC, which had annual revenues of                               such restructuring program was initiated in 2008, we have completed four restructuring programs. We have cumulatively incurred
      approximately $1.5 billion prior to the acquisition, and National Pump, which had annual revenues of over $200 million prior to the acquisition.                           total restructuring charges of $331 million under our restructuring programs.
      NES had annual revenues of approximately $369 million, Neff had annual revenues of approximately $413 million, BakerCorp had annual                                (3)     Represents non-cash, share-based payments associated with the granting of equity instruments.
      revenues of approximately $295 million and BlueLine had annual revenues of approximately $786 million.                                                             (4)     Reflects additional costs recorded in cost of rental equipment sales associated with the fair value mark-up of rental equipment
                                                                                                                                                                                 acquired in the RSC, NES, Neff and BlueLine acquisitions and subsequently sold.

                                                                     United Rentals, Inc., 100 First Stamford Place, Stamford, CT 06902. © 2018 United Rentals, Inc. All rights reserved.
                                                                                                                                                                                                                                                                                                     43
Pro Forma EBITDA and Adjusted EBITDA GAAP
      Reconciliations
      The pro forma information below for the third quarter of 2018 reflects the combination of United Rentals, BakerCorp and BlueLine. Prior to our acquisitions of BakerCorp and BlueLine, BakerCorp and BlueLine management used different EBITDA and
      adjusted EBITDA definitions than those used by United Rentals. The information below reflects BakerCorp and BlueLine historical information presented in accordance with United Rentals’ definitions of EBITDA and adjusted EBITDA. The management of
      BakerCorp and BlueLine historically did not view EBITDA and adjusted EBITDA as liquidity measures, and accordingly the information required to reconcile these measures to the statement of cash flows is unavailable to the company. The table below
      provides a calculation of as-reported and pro forma net income and EBITDA and adjusted EBITDA for the third quarter of 2019 and 2018.

                                                                                                                                                                Three Months Ended                                 Three Months Ended

                                                 $ Millions                                                                                                         September 30,                                    September 30,
                                                                                                                                                                 2019               2018               2018                2018             2018

                                                                                                                                                                                      As-
                                                                                                                                                            As-reported            reported          BakerCorp            BlueLine        Pro forma
                                                 Net income (loss)
                                                                                                                                                           $         391       $       333       $         (59)       $        —      $        274
                                                 Provision for income taxes
                                                                                                                                                                     119               127                    (4)              —               123
                                                 Interest expense, net
                                                                                                                                                                     147               118                    9                32              159
                                                 Depreciation of rental equipment
                                                                                                                                                                     417               343                    2                50              395
                                                 Non-rental depreciation and amortization
                                                                                                                                                                     102                    75                2                   2             79
                                                 EBITDA (A)
                                                                                                                                                           $       1,176       $       996       $         (50)       $        84     $      1,030
                                                 Merger related costs (1)
                                                                                                                                                                        —                   11                57                  2             70
                                                 Restructuring charge (2)
                                                                                                                                                                        2                   9                 —                —                   9
                                                 Stock compensation expense, net (3)
                                                                                                                                                                      14                    30                —                —                30
                                                 Impact of the fair value mark-up of acquired fleet (4)
                                                                                                                                                                      15                    13                —                —                13
                                                 Other (5)
                                                                                                                                                                        —                   —                 —                   4                4
                                                 Adjusted EBITDA (B)
                                                                                                                                                           $       1,207       $     1,059       $            7       $        90     $      1,156

       A) Our as-reported EBITDA margin was 47.3% and 47.1% for the three months ended September 30, 2019 and 2018, respectively, and pro forma EBITDA margin was 43.6% for the three months ended September 30, 2018.
       B) Our as-reported adjusted EBITDA margin was 48.5% and 50.0% for the three months ended September 30, 2019 and 2018, respectively, and pro forma adjusted EBITDA margin was 48.9% for the three months ended September 30, 2018.

(1)   Reflects transaction costs associated with the NES, Neff, BakerCorp and BlueLine acquisitions. We have made a number of acquisitions in the                       (2)     Primarily reflects severance and branch closure charges associated with our closed restructuring programs and our current
      past and may continue to make acquisitions in the future. Merger related costs only include costs associated with major acquisitions that                                 restructuring program. We only include such costs that are part of a restructuring program as restructuring charges. Since the first
      significantly impact our operations. The historic acquisitions that have included merger related costs are RSC, which had annual revenues of                              such restructuring program was initiated in 2008, we have completed four restructuring programs. We have cumulatively incurred total
      approximately $1.5 billion prior to the acquisition, and National Pump, which had annual revenues of over $200 million prior to the acquisition.                          restructuring charges of $331 million under our restructuring programs.
      NES had annual revenues of approximately $369 million, Neff had annual revenues of approximately $413 million, BakerCorp had annual                               (3)     Represents non-cash, share-based payments associated with the granting of equity instruments.
      revenues of approximately $295 million and BlueLine had annual revenues of approximately $786 million. The BakerCorp and BlueLine merger                          (4)     Reflects additional costs recorded in cost of rental equipment sales associated with the fair value mark-up of rental equipment
      costs reflect merger related costs recognized by BakerCorp and BlueLine prior to the acquisitions.                                                                        acquired in the RSC, NES, Neff and BlueLine acquisitions and subsequently sold.
                                                                                                                                                                        (5)     Includes various adjustments reflected in historic adjusted EBITDA for BakerCorp and BlueLine.

                                                                     United Rentals, Inc., 100 First Stamford Place, Stamford, CT 06902. © 2018 United Rentals, Inc. All rights reserved.
                                                                                                                                                                                                                                                                                                 44
You can also read