J.P. Morgan Energy, Power & Renewables Conference - JUNE 23, 2021 - Seeking Alpha
←
→
Page content transcription
If your browser does not render page correctly, please read the page content below
J.P. Morgan Energy, Power & Renewables Conference
JUNE 23, 2021
Forward Looking Statements
The inf ormation in this presentation has been prepared as at June 18, 2021. Certain statements contained in this news release constitute "forward-looking statements" within the meaning of the United States Private
Securities Litigation Reform Act of 1995 and "forward-looking information" under the provisions of Canadian prov incial securities laws and are referred to herein as "forward-looking statements". All statements, other
than statements of historical fact, that address circumstances, events, activities or developments that could, or may or will occur are forward looking statements. When used in this news release, the words
"anticipate", "could", "estimate", "expect", "f orecast", "f uture", "plan", "possible", "potential", "will" and similar expressions are intended to identify forward-looking statements. Such statements include, without
limitation: statements regarding the impact of the COVID-19 pandemic and measures taken to reduce the spread of COVID-19 on the Company 's future operations, including its employ ees and overall business; the
Company's f orward-looking guidance, including metal production, estimated ore grades, recovery rates, project timelines, drilling results, lif e of mine estimates, total cash costs per ounce, AISC per ounce, minesite
costs per tonne, other expenses, cash flows and free cash f low; the estimated timing and conclusions of technical studies and ev aluations; the methods by which ore will be extracted or processed; statements
concerning the Company's expansion plans at Kittila, Meliadine Phase 2, the Amaruq underground project and the Odyssey project, including the timing, f unding, completion and commissioning thereof and
production therefrom; statements about the Company's plans at the Hope Bay mine; statements about the potential for the Hope Bay mine to be a 250,000 to 300,000 ounces of gold per year operation; statements
concerning other expansion projects, recovery rates, mill throughput, optimization and projected exploration, including costs and other estimates upon which such projections are based; statements regarding timing
and amounts of capital expenditures, other expenditures and other cash needs, and expectations as to the f unding thereof; estimates of future mineral reserv es, mineral resources, mineral production and sales; the
projected dev elopment of certain ore deposits, including estimates of exploration, development and production and other capital costs and estimates of the timing of such exploration, dev elopment and production or
decisions with respect to such exploration, dev elopment and production; estimates of mineral reserves and mineral resources and the effect of drill results on f uture mineral reserves and mineral resources;
statements regarding the Company's ability to obtain the necessary permits and authorizations in connection with its proposed or current exploration, dev elopment and mining operations and the anticipated timing
thereof; statements regarding anticipated future exploration; the anticipated timing of events with respect to the Company's mine sites; statements regarding the sufficiency of the Company's cash resources;
statements regarding future activ ity with respect to the Company's unsecured revolving bank credit facility; future dividend amounts and payment dates; and statements regarding anticipated trends with respect to the
Company's operations, exploration and the f unding thereof. Such statements reflect the Company's views as at the date of this news release and are subject to certain risks, uncertainties and assumptions, and
undue reliance should not be placed on such statements. Forward-looking statements are necessarily based upon a number of f actors and assumptions that, while considered reasonable by Agnico Eagle as of the
date of such statements, are inherently subject to signif icant business, economic and competitive uncertainties and contingencies. The material f actors and assumptions used in the preparation of the forward looking
statements contained herein, which may prove to be incorrect, include, but are not limited to, the assumptions set f orth herein and in management's discussion and analysis ("MD&A") and the Company's Annual
Inf ormation Form ("AIF") for the y ear ended December 31, 2020 f iled with Canadian securities regulators and that are included in its Annual Report on Form 40-F for the year ended December 31, 2020 ("Form 40-F")
filed with the U.S. Securities and Exchange Commission (the "SEC") as well as: that governments, the Company or others do not take additional measures in response to the COVID-19 pandemic or otherwise that,
indiv idually or in the aggregate, materially affect the Company's ability to operate its business; that cautionary measures taken in connection with the COVID-19 pandemic do not affect productiv ity; that measures
taken relating to, or other effects of, the COVID-19 pandemic do not affect the Company's ability to obtain necessary supplies and deliver them to its mine sites; that there are no signif icant disruptions affecting
operations; that production, permitting, development, expansion and the ramp up of operations at each of Agnico Eagle's properties proceeds on a basis consistent with current expectations and plans; that the
relev ant metal prices, foreign exchange rates and prices f or key mining and construction supplies will be consistent with Agnico Eagle's expectations; that Agnico Eagle's current estimates of mineral reserves, mineral
resources, mineral grades and metal recov ery are accurate; that there are no material delays in the timing for completion of ongoing growth projects; that seismic activity at the Company's operations at LaRonde,
Goldex and other properties is as expected by the Company; that the Company's current plans to optimize production are successful; and that there are no material variations in the current tax and regulatory
env ironment. Many f actors, known and unknown, could cause the actual results to be materially different f rom those expressed or implied by such forward looking statements. Such risks include, but are not limited
to: the extent and manner to which COVID-19, and measures taken by governments, the Company or others to attempt to reduce the spread of COVID-19, may affect the Company, whether directly or through
eff ects on employee health, workforce productivity and availability (including the ability to transport personnel to the Meadowbank Complex, Meliadine mine and the Hope Bay mine which operate as fly-in/f ly-out
camps), travel restrictions, contractor availability, supply availability, ability to sell or deliver gold dore bars or concentrate, availability of insurance and the cost thereof, the ability to procure inputs required for the
Company's operations and projects or other aspects of the Company's business; uncertainties with respect to the effect on the global economy associated with the COVID-19 pandemic and measures taken to reduce
the spread of COVID-19, any of which could negatively affect f inancial markets, including the trading price of the Company's shares and the price of gold, and could adv ersely affect the Company's ability to raise
capital; the volatility of prices of gold and other metals; uncertainty of mineral reserves, mineral resources, mineral grades and mineral recovery estimates; uncertainty of future production, project development, capital
expenditures and other costs; foreign exchange rate f luctuations; f inancing of additional capital requirements; cost of exploration and development programs; seismic activity at the Company's operations, including
the LaRonde Complex and Goldex mine; mining risks; community protests, including by First Nations groups; risks associated with foreign operations; gov ernmental and environmental regulation; the volatility of the
Company's stock price; and risks associated with the Company's currency, f uel and by -product metal derivative strategies. For a more detailed discussion of such risks and other factors that may affect the
Company's ability to achiev e the expectations set forth in the f orward-looking statements contained in this news release, see the AIF and MD&A filed on SEDAR at www.sedar.com and included in the Form 40-F f iled
on EDGAR at www.sec.gov, as well as the Company's other filings with the Canadian securities regulators and the SEC. Other than as required by law, the Company does not intend, and does not assume any
obligation, to update these forward-looking statements.
Currency
All amounts in this presentation are expressed in U.S. dollars except as otherwise noted.
Further Information
For f urther details on Agnico Eagle’s first quarter 2021 results, please see the Company's news release dated April 29, 2021.
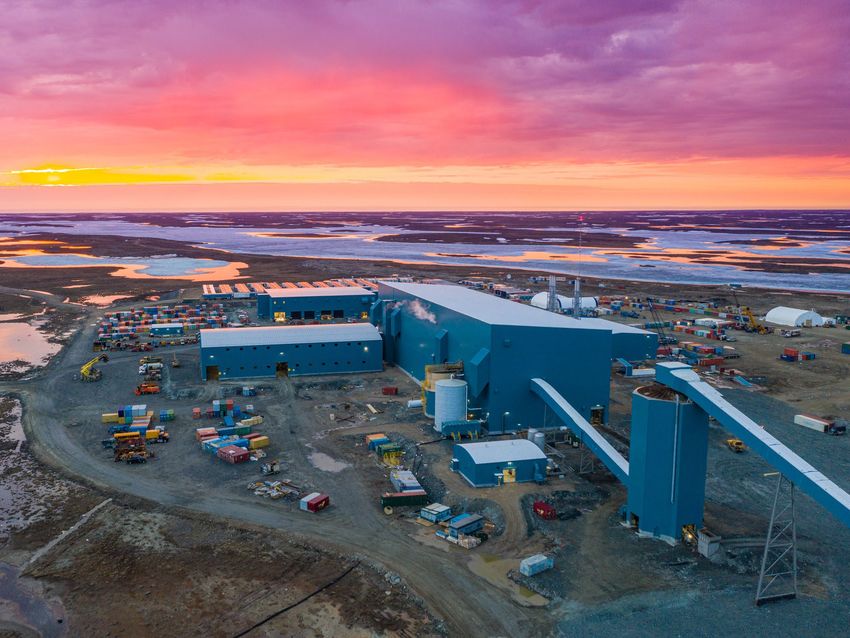
Front Cover
Agnico Eagle’s Meliadine taken in the second quarter of 2019.
J.P. Morgan 2021 Energy, Power & Renewables Conference 2
Notes to Investors
Note Regarding the Use of Non-GAAP Financial Measures

This presentation discloses certain measures, including "total cash costs per ounce", "all-i n sustaining costs per ounce“, "minesite costs per tonne“, "operating ma rgin" a nd “f ree cash-f low” that are
not standardized measures under IFRS. These measures may not be comparable to similar measures reported by other gold mining companies. For a reconciliation of these measures to the most
directly comparable f inancial inf ormation reported in the consolidated f inancial statements prepared in accordance with IFRS and f or an explanation of how man agement uses these measures, see
"Non-GAA P Financial Perf ormance Measures" in the MD&A f iled on SEDAR at www.sedar.com and included in the Form 6-K f iled on EDGAR at www.sec.gov , as well as the Company 's other f ilings
with the Canadian securities regulators and the SEC.

The total cash costs per ounce of gold produced is reported on both a by -product basis (deducting by -product metal rev enues f rom production costs) and co-product basis (without deducting by -
product metal rev enues). Unless otherwise specif ied total cash costs per ounce of gold produced is reported on a by -product basis in this presentation. The total cash costs per ounce of gold
produced on a by -product basis is calculated by adjusting production costs as recorded in the consolidated statements of income (loss) f or by -product rev enues, inv entory production costs, smelting,
ref ining and marketing charges and other adjustments, and then div iding by the number of ounces of gold produced. The total cash costs per ounce of gold produced on a co-product basis is
calculated in the same manner as the total cash costs per ounce of gold produced on a by -product basis except that no adjustment is made f or by -product metal rev enues. Accordingly , the
calculation of total cash costs per ounce of gold produced on a co-product basis does not ref lect a reduction in production costs or smelting, ref ining and marketing charges associated with the
production and sale of by -product metals. The total cash costs per ounce of gold produced is intended to prov ide inf ormation about the cash-generating capabilities of the Company 's mining
operations. Man agement also uses this measure to monitor the perf ormance of the Company 's mining operations. As market prices f or gold are quoted o n a per ounce basis, using the total cash
costs per ounce of gold produced on a by -product basis measure allows management to assess a mine's cash-generating capabilities at v arious gold prices.

All-in sustaining costs per ounce ("AISC") is used to sho w the f ull cost of gold production f rom current operations. The Company calculates all-in sustaining costs per ounce of gold produced on a
by -product basis as the aggregate of total cash costs on a by -product basis, sustaining capital expenditures (including capitali zed explor ation), general and administrativ e expenses (including stock
options), lease pay ments related to sustaining assets and reclamation expenses, and then div iding by the number of ounces of gold produced. The all-in sustaining costs per ounce of gold produced
on a co-product basis is calculated in the same manner as the all-in sustaining costs per ounce of gold prod uced on a by -product basis, except that the total cash costs per ounce on a co-pro duct
basis are used, meaning no adjustment is made f or by -product metal rev enues. Management is aware that these per ounce measures of perf ormance can be aff ected by f luctuations in foreign
exchange rates and, in the case of total cash costs per ounce of gold produced on a by -product basis, by -product metal prices. Management compensates for these inherent limitations by using
these measures in conjunction with minesite costs per tonne (discussed below) as well as other data prep ared in accordance with IFRS. The World Gold Council ("WGC") is a non-re gulatory market
dev elopment organization f or the gold industry. Although the WGC is not a mining industry regulatory organization, it has worked closely with its member companies to dev elop relev ant non-GAAP
measures. The Company f ollows the guidance on all-in sustaining costs released by the WGC in Nov ember 2018. Adoption of the all-in sustaining costs metric is v oluntary and, notwithstanding the
Company 's adoption of the WGC's guidance, all-in sustaining costs per ounce of gold produced reported by the Company may not be comparable to data reported by other gold mining companies.
The Company believ es that this measure prov ides helpf ul inf ormation about operating perf ormance. Howev er, this non-GAAP measure should be considered together with other data prepared in
accordance with IFRS as it is not necessarily indicativ e of operating costs or cash f low measures prepared in accordance with IFRS.

Minesite costs per tonne are calculated by adjusting production costs as recorded in the consolidated statements of income (loss) f or inv entory production costs and other adjustments, and then
div iding by tonnes of ore processed. As the total cash costs per ounce of gold produced can be aff ected by f luctuations in by product metal prices and f oreign exchange rates, management believ es
that minesite costs per tonne prov ide additional inf ormation regarding the perf ormance of mining operations, eliminating the impact of v ary ing production lev els. Management also uses this measure
to determine the economic v iability of mining blocks. As each mining block is ev aluated based on the net realizable v alue of each tonne mined, in order to be economically v iable the estimated
rev enue on a per tonne basis must be in excess of the minesite costs per tonne. Management is a ware that this per ton ne measure of perf ormance can be impacted by f luctuations in processing
lev els and compensates f or this inherent limitation by using this measure in conjunction with production costs prepared in accordance with IFRS.

Operating margi n is not a recogni zed measure und er IFRS and this data may not be comparable to data presented by other gold pro ducers. This measure is calculated by excluding the f ollowing
f rom net income (loss) as recorded in the condensed interim consolidated f inancial statements: Income and mining taxes expense; Other expenses (income); Foreign currency translation loss (gain);
Gain (loss) on deriv ativ e f inancial instruments; Finance costs; General and administrativ e expenses; Amortization of property , plant and mine dev elopment; Exploration and corporate dev elopment
expenses; and Impairment losses (rev ersals). The Company believ es that operating margin is a usef ul measure that represents the operating perf ormance of its mines associated with the ongoing
production and sale of gold and by -product metals. Management uses this measure internally to plan and f orecast future operating results. This measure is intended to prov ide inv estors with
additional inf ormation about the Company ’s underly ing operating results and should be ev aluated in conjunction with other data prepared in accordance with IFRS.

Free cash f low is calculated by deducting additions to property , plant and mine dev elopment from cash prov ided by operating activities including changes in non-cash working capital balances.
Manag ement uses free cash f low to assess the av ailability of cash, af ter f unding operations and capital expenditures, to operate the business without additional borrowing or drawing down on the
Company 's existing cash balance.

Note Regarding Production Guidance

The gold pr oduction guidance is based on the Company 's mineral reserv es but includes contingencies and assumes metal prices and f oreign exchange rates that are diff erent f rom those used in the
mineral reserv e estimates. These f actors and others mean that the gold production guidance presented in this presentation does not reconcile exactly with the production models used to support
these mineral reserv es.

                                                                                                                                   J.P. Morgan 2021 Energy, Power & Renewables Conference                      3
Building A Long Term, Sustainable, Self Funding Business
Solid Operating Performance Growing at a Steady, Measured Pace
Strong operational and safety performance at all 24% production growth forecast from 2020 to
of the Company’s key mines in Q1 2021 2024 supported by record mineral reserve
Second consecutive quarter of record gold A growing exploration story at existing assets
production in Q1 2021 with better than forecast
costs Opportunities to secure the project pipeline and
add value from longer term projects
Strong Financial Position Consistent Strategy
$1.3B of available liquidity (March 31, 2021) Strategy is to grow production per share by
focusing on geological potential
Moody’s initiated ratings in February 2021 with
ratings at Baa2 with stable outlook. DBRS Established a competitive advantage in low-
Morningstar and Fitch ratings reaffirmed in April geopolitical risk, pro-mining jurisdictions
2021 with ratings at BBB with stable outlook
Recognized for our leading industry practices in
A cash dividend has been declared every year ESG by independent research agencies
since 1983
J.P. Morgan 2021 Energy, Power & Renewables Conference 4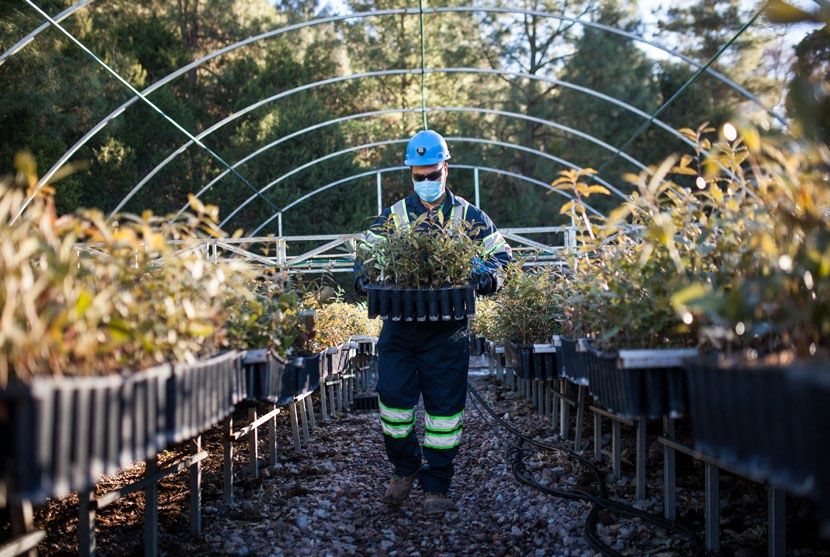
ESG is Central to our Strategy to Build a High Quality Business
Battery-powered equipment, Kittila
Filtered tailings
Oberon Weber Solar wall to heat LaRonde mill
2020 Sustainability Report provides an updated climate change strategy – Key initiatives
include the adoption of a net-zero emissions target for 2050 and the initial disclosure of Scope 3
emissions
GHG Scope 1 and 2 emissions reported for 2020 – At 0.40 t.CO2eq/oz, the Company has
one of the lowest GHG emissions intensity in peer group, achieved by sourcing 52% of its
electricity needs from renewable sources and ongoing GHG reductions initiatives. Other
alternatives such as wind power generation are also being evaluated in Nunavut
Achieved one of the lowest combined lost-time accident and restricted work frequency
(employees and contractors) at 1.02 in the Company’s history
Continued support and investment in local communities through a challenging year
ESG Rank
Recognized for
our leading Credit Suisse 1
industry practices Bloomberg
2
in ESG by Sustainalytics Winner of the 2020 Towards
Sustainable Mining® (TSM)
independent Thomson Reuters 2
Environmental Excellence Award from
research agencies MSCI Rating AA the Mining Association of Canada
Source: Credit Suisse ESG Report, Bloomberg, Thompson Reuters, MSCI website J.P. Morgan 2021 Energy, Power & Renewables Conference 5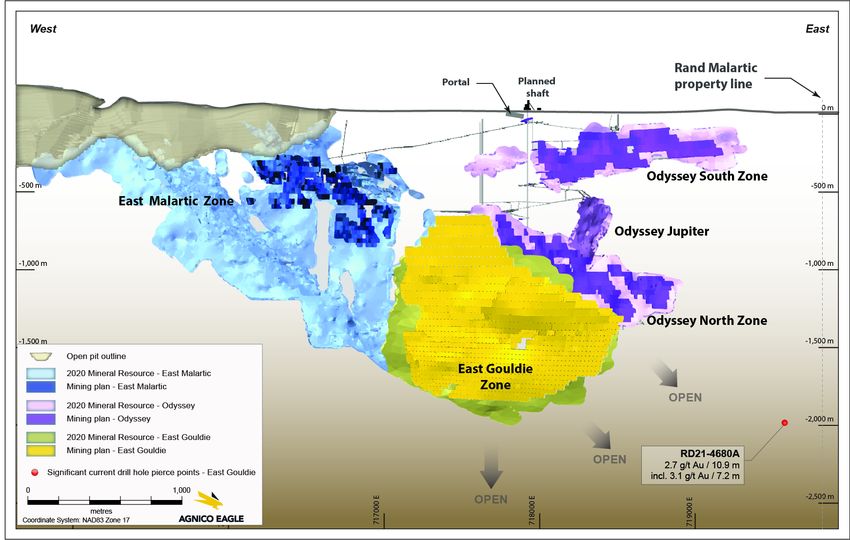
Diversified Operations in Regions with High Geological Potential
Robust Production in Premier Mining Jurisdictions in North America and Europe

CANADA, NUNAVUT1
Hope Bay
Meadowbank Complex
Meliadine
740 koz @ cash cost $826/oz
P&P:      M&I:      Inf.:
6.9Moz 3.7Moz       3.6Moz
1. Production, cash cost, mineral reserves
and mineral resources exclude Hope Bay
mine.

                                                                                                                                             EUROPE
                                                                                                                                             Kittila
 MEXICO                                                                                                                                       250 koz @ Cash Cost $760/oz
 Pinos Altos                                                                                                                                 P&P:      M&I:      Inf.:
 La India                                                                                                                                    4.1Moz    2.0Moz    2.7Moz
 Santa Gertrudis (Project)
 200 koz @ cash cost $818/oz
 P&P:       M&I:       Inf.:
 1.1Moz     2.0Moz     2.5Moz                                                                                                                 CANADA, ABITIBI
                                                                                                                                              Goldex
                                                                                                                                              Canadian Malartic (50%)
TOTAL2                                                                                                                                        LaRonde Complex
Production (Koz)                  2,047.5                                                                                                     Upper Beaver (Project)
Cash-cost ($/oz)                 700 - 750                                                                                                    Hammond Reef (Project)
                                                                                                                                              858 koz @ cash cost $621/oz
AISC ($/oz)    950 - 1,000
                                                                                                                                              P&P:      M&I:        Inf.:
P&P:      M&I:   Inf.:
                                                                                                                                              12.0Moz 7.7Moz        14.5Moz
24.1Moz 15.4Moz 23.3Moz
2. Totals are indicative of total producing,
dev eloping and exploration assets. Totals     Note:   Production, cash-cost and AISC are as per 2021 Guidance; Mineral Reserves and Mineral Resources as of December 31, 2020.
exclude Hope Bay mine.                                 See AEM February 11, 2021 press release and appendix for detailed breakdown of mineral reserves and mineral resources.

Source: Company filings.                                                                                        J.P. Morgan 2021 Energy, Power & Renewables Conference            6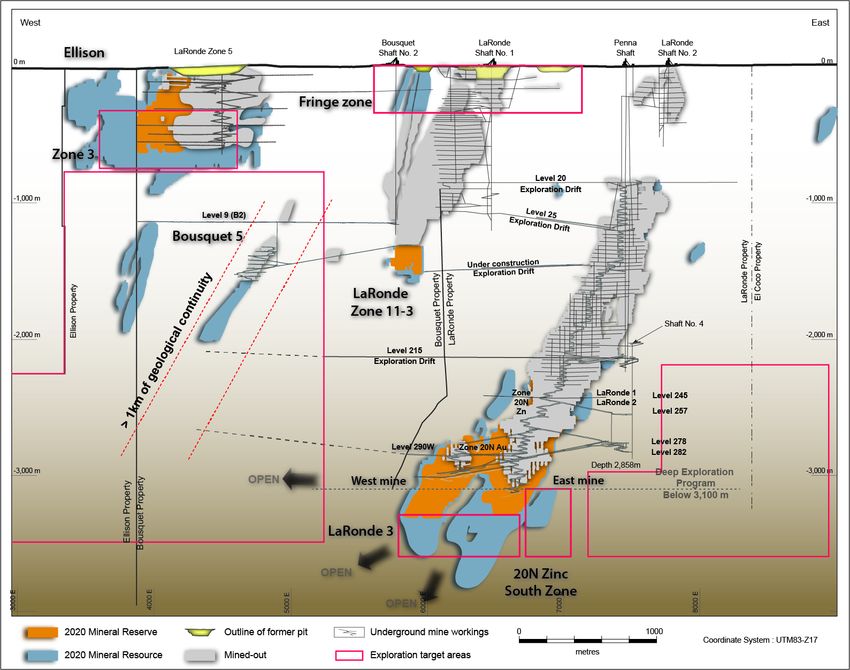
Low Jurisdictional Risk, Low Complexity

                                                                               INCREASED JURISDICTION MINING-RELEVANT RISK

                                                                                                                                                                                        14

                                                                                                                             Barrick                                                    12
INCREASED BUSINESS COMPLEXITY

                                                                                                                                                                                        10

                                                                                                                                                                                             Number of Operating Countries
                                                                                                  Newmont

                                                                                                                                                                                        8

                                                                                                                                       Kinross
                                                                                                                                                                                        6

                                                 Agnico Eagle
                                                                                        Yamana                                                   Newcrest            IAMGOLD            4

                                                                                                                 Eldorado Gold                       Centerra Gold

                                                                                                                                                                                        2

                                                            Kirkland Lake

                                                                                                                                                                                        0
                                80                             75                      70                   65                         60                      55                  50
                                Bubble size represents 2021 gold production guidance         Jurisdiction Mining-Relevant Risk

        Source: World Risk Report 2019, Mining Journal; Agnico Eagle; Companies’ websites

                                                                                                                                  J.P. Morgan 2021 Energy, Power & Renewables Conference                      7
2020 Gold Mineral Reserves and Mineral Resources
Gold Mineral Reserves Increase to Record Level
AEM’s Global Reserves, Measured and Indicated Resources and Inferred Resources
70 (2011-2020)
60
Ounces Gold (millions)
50
40
30
20
10
0
2011 2012 2013 2014 2015 2016 2017 2018 2019 2020
As of December 31
Reserves M&I Resources Inferred Resources
Year-end 2020 gold mineral reserves increased by 12% to 24.1 million ounces of gold
Measured and indicated mineral resources decreased by 15% to 15.3 million ounces
Inferred mineral resources increased by 9% to 23.4 million ounces
A $125/oz change in gold price assumptions would result in a 5.6% change in gold mineral
reserves
Note: See AEM February 11, 2021 press release and appendix for detailed breakdown of mineral reserves and mineral resources. J.P. Morgan 2021 Energy, Power & Renewables Conference 8
Mineral Resources and Mineral Reserves are exclusive of Hope Bay.
Gold Production Forecast to Increase by 24% from 2020 to 2024
Expansion of Current Operations Drive Steady Production Growth

                            2.40                                                                                                                   $1,000

                                                                                                                                                   $950
                            2.20                                                                                              2.15
                                                                                                                   2.13                            $900
                                                                                                        2.10
                                                                                              2.05
                                                                                                                                                   $850
                            2.00
Gold Ounces (in Millions)

                                                                                                                                                   $800

                                                                         1.78                                                                      $750
                            1.80

                                                                                                                                                            Cash Costs
                                                                                   1.74
                                                        1.71
                                          1.67   1.66                                                                                              $700
                                                               1.63
                            1.60                                                                                                                   $650

                                   1.43                                                                                                            $600
                            1.40
                                                                                                                                                   $550

                                                                                                                                                   $500
                            1.20
                                                                                                                                                   $450

                            1.00                                                                                                                   $400
                                   2014   2015   2016   2017   2018     2019       2020      2021E     2022E      2023E      2024E    2025E &
                                                                                                                                      onwards

                                                                      Production          Cash Costs

                                                                                                       J.P. Morgan 2021 Energy, Power & Renewables Conference            9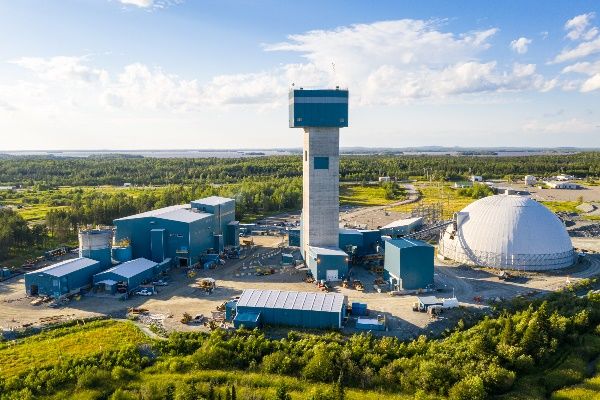
Focused on Growing Value on a per Share Basis
Consistent Strategy that Works
Grow per share gold production at a measured and sustainable rate
Production per 1000 shares Compound Annual NAV per Share CAGR from 2005 to 2020 of 11%
Growth Rate (“CAGR”) from 2005 to 2022 of 7% vs an average of 3% for North American Peers
vs an average of -5% for North American Peers
15% NAVPS CAGR
Production Per 1000 Shares (January 1, 2005 – March 19, 2021)
10.0
11%
9.0
10%
8.0
7.0
5%
6.0 5% 4% 4%
3% 3%
5.0
1%
4.0
0%
3.0
2.0
1.0 -5%
-
Source: Company reports Source: Scotia bank Global Banking and Markets, Bloomberg
* Peers Av erage includes Barrick, Newmont, Kinross, Y amana, IAMGOLD
J.P. Morgan 2021 Energy, Power & Renewables Conference 10Mine Site Extensions & Pipeline Projects Provide Added Value
Disciplined Capital Spending Supports Long Term Gold Production > 2 Moz/year
Scope
2021 2030
Approximate
2025 Growth
Capital
Intensity
Annual
Production
(koz/y r)
20N Zn South Zone
LaRonde Complex 400
Extension of old Bousquet at depth
Extensions to the M zone, Deep 2 and
Goldex – Evaluating potential to increase mining rates (Deep 1, Deep 2, South zone) 150
South zone
Canadian Malartic – OP CM OP & Odyssey UG Odyssey UG 275
Mine Sites1
Meadowbank Open Pit Extension2
Amaruq OP & UG 400 - 500
Complex UG below permafrost 2
Extension of known deposits
Meliadine – Phase 2 extension to 6kptd in 2025 370
Regional upside
Kittila to 2Mtpa Kittila Expansion to 2.35Mtpa2 250 - 300
Pinos Altos – Testing deep potential
Pinos Altos 125
Satellites – Cubiro, Reyna de Plata, Madrono deposits
La India – Oxide La India – Sulphide / Chipriona2 80
Hope Bay – Doris Hope Bay – Madrid & Boston2 250 - 300
Pipeline1
Santa Gertrudis 2 125
Approximate Grow th Capital Intensity Kirkland Lake – Upper Beaver2 180 - 240
>$700M $450M to $150M toAgnico Eagle’s Growing Business
Positioned to Generate Strong Free Cash Flow
2,400,000
Potential uses of rising
2,200,000 cash flow:
2,000,000
Funding internal
1,800,000 pipeline projects
1,600,000 Reduce net debt
1,400,000 Increase dividends
1,200,000
Increase exploration
1,000,000 spending
800,000 Potential Total
600,000
A $100/oz change in gold
400,000 price assumptions would
result in ~$200 million
200,000
change in Mine Operating
- Margin
2015 2016 2017 2018 2019 2020 2021E 2022E 2023E 2024E
Sustaining Capex Growth Capex & Capitalized Exploration
Mine Operating Margin (Au $1800/oz)*
* Mine Operating Margin = ounces x (gold price – total cash costs per ounce).
Mine Operating Margin based on Realized Gold Price for years 2015 to 2020 and based on $1800/oz gold price for years 2021 to 2024
J.P. Morgan 2021 Energy, Power & Renewables Conference 12Successful M&A and Exploration Strategy
Significant Value Added, Key Deposits Still Open and Positioned to Deliver More Value
Mined through 2020 (koz) Proven & Probable (koz) Measured & Indicated (koz) Inferred (koz) Cost per Oz ($)
Kittila Meadowbank Meliadine Pinos Altos Canadian Malartic (50%)
(Including Amaruq) (incl Odyssey Project) 11,894 koz
9,677 koz 9,468 koz
9,034 koz
+147% +80% +103%
+246%
5,853 koz
5,020 koz
4,671 koz
3,830 koz +122%
2,800 koz
2,100 koz
2005 2020 2007 2020 2010 2020 2006 2020 2014 2020
$273
$173
$121
$54 $48
$37 $40 $43
$24
$10
Purchase Discovery Purchase Discovery Purchase Discovery Purchase Discovery Purchase Discovery
See AEM February 11, 2021 press release and appendix for detailed breakdown of mineral reserves and J.P. Morgan 2021 Energy, Power & Renewables Conference 13
mineral resources.Building Value Through the Drill Bit
A Growing Exploration Story at Existing Assets
$0.0
2021 $5.0
Exploration
$10.0
Budget
$15.0
Developing 3 new exploration drifts below the historic
LaRonde Complex $14.1 Bousquet mine and drilling targets at Zone 5, Zone 6,
Zone 20N and Zone 20N Zn South
Focused on conversion drilling on the M Zone, Deep 1,
Goldex $6.5 Deep 2 and South zones.
Conversion drilling focused on infilling and expanding of
Canadian Malartic $15.0 the East Gouldie Zone and initiate Odyssey UG
conversion drilling from the ramp
Conversion and exploration drilling focused on testing
Meadowbank Complex $7.0 open-pit and UG extensions at Amaruq
Mine Sites
Conversion drilling at the Tiriganiaq, Normeg and
Meliadine $8.3 Wesmeg deposits, as well as exploration drilling of the
Tiriganiaq, Wesmeg, Pump and F-Zone deposits
Delineation and expansion drilling to support production
Hope Bay $11.1 and extend life of mine at Doris
Drilling focused on converting and expanding the known
Kittila $14.3 mineralized zones, including deep extensions of the
deposits
Infill and expand the mineral resource at Cubiro and as
Pinos Altos $3.9 well as testing the depth potential of the Cerro Colorado,
Santo Nino and Reyna East zones
Drilling to investigate for shallow, near surface oxide
La India $4.0
targets and to grow and infill the Chipriona polymetallic
sulphide deposit
See AEM February 11, 2021 press release and appendix for detailed breakdown of mineral reserves and J.P. Morgan 2021 Energy, Power & Renewables Conference 14
mineral resources.Canadian Malartic – Odyssey Underground (50% Ownership)
Initial 17-year Mine Life based on only 50% of known Mineral Resources
Highlights:
Mineral Resource (100% basis):
M&I: 0.9Moz, 2.01g/t
Inf.: 13.6Moz, 2.38g/t
Total Production over initial
17-year mine life:
6.93 Moz (100% basis)
Average annual production
from 2029 to 2039 (100% basis):
~ 545 Koz of gold,
Cash costs of ~$630/oz
970-metre step-out drill hole
identifies a potentially
significant extension to the
East Gouldie Zone
East Malartic – 3,500tpd East Gouldie – 12,500tpd Odyssey – 3,500tpd
Initial Production – 2028 Initial Production - 2027 Odyssey South: 2023 to 2027
Full Production: 2030 to 2039 Ramp-up: 2027 to 2029 Odyssey North: 2030 to 2038
Mineral Resource: Full Production: 2030 to 2038 Mineral Resource:
• M&I: 0.9Moz, 2.01g/t Mineral Resource M&I: 0.1Moz, 1.90g/t
• Inf.: 5.3Moz, 1.91g/t Inf.: 6.4Moz, 3.17g/t Inf.: 1.8Moz, 2.05g/t
See AEM February 11, 2021 press release and appendix for detailed breakdown of mineral reserves and J.P. Morgan 2021 Energy, Power & Renewables Conference 15
mineral resources.LaRonde Mine – Revisiting Camp Scale Exploration
Focus on enhancing current operations and extending mine life beyond 2030
Short to mid term
focus:
• LaRonde 3 – Zone
20N & Zone 6
• Zone 20N Zn South :
new resource, open at
depth and to the east
• LZ5 at depth, Zone 3,
Ellison
• Fringe zone, near
surface
Longer term focus:
• Explore extensions of
historical Bousquet
Mines and to the East
• Drill test historical
mineral resources and
mineral inventory at
Zone 3-1, 3-4 and
Deep Ellison
J.P. Morgan 2021 Energy, Power & Renewables Conference 16Building Value Through the Drill Bit
Expanding Pipeline Potential in Operating Regions
2021
$0.0 Exploration
$5.0 Budget$15.0
$10.0
Short term: Drilling targets around Madrid deposit
Hope Bay $5.1 Long Term: Focused on Boston deposit and other
regional targets
Exploration and conversion drilling at Upper Beaver in
Kirkland Lake $14.0
advance of an internal evaluation. Exploration drilling on
several regional targets
Focused on expanding the mineral resource, testing the
Pipeline
Santa Gertrudis $11.0 extensions of high-grade structures such as Amelia, and
exploring new oxide targets
Investigating geological analogs to our existing Abitibi
Regional Abitibi $3.1 operations on our large regional land package
Investigating various geological targets around existing
Regional Nunavut $9.0 minesites and on our large regional land holdings
Evaluating a variety of targets both regionally and on
Regional Mexico $12.2 existing land holdings
Compile historic information, redefine regional targets
Douay/Joutel JV through geophysics, drilling of highest priority targets and
Ventures
$3.3
Joint-
tests VMS targets (13,500m of drilling)
Drill and expand existing targets and identify and test
Colombia JV $3.8 new targets on the property (16,000m of drilling)
See AEM February 11, 2021 press release and appendix for detailed breakdown of mineral reserves J.P. Morgan 2021 Energy, Power & Renewables Conference 17
and mineral resources.Agnico Eagle’s Long History of Returning Value to Shareholders
Dividend growth of 20% CAGR since 2010
$250,000 $2,500
~$1.3B in cumulative dividends
$200,000
over the last 38 years $2,000
$150,000 $1,500
(In Thousands)
US$ per ounce
$100,000 $1,000
$50,000 $500
$- $-
2010 2011 2012 2013 2014 2015 2016 2017 2018 2019 2020
Total Annual Dividend Average Gold Price
J.P. Morgan 2021 Energy, Power & Renewables Conference 18Superior Share Performance Since 1998
Agnico Eagle Has Consistently Outperformed Gold and Gold Equities
10000%
AEM US Equity Gold Spot S&P 500 Index XAU Index
AEM US Equity
CAGR
1000%
12.69%
Gold Spot CAGR
8.35%
100%
S&P 500 Index CAGR
6.00%
XAU Index CAGR
10%
3.81%
Source: Bloomberg – August 3, 1998 to June 17, 2021
J.P. Morgan 2021 Energy, Power & Renewables Conference 19Summary: Quality Business – Growing Production and Free Cash Flow
24% production growth forecast from 2020 to 2024 drives increasing free cash flow
Maintains a competitive advantage in low-geopolitical risk, pro-mining jurisdictions
Industry leading ESG performance, announcing a net-zero emissions target by 2050 and
the initial disclosure of Scope 3 emissions
38 years of consecutive dividends
Ongoing exploration success, with focus on pipeline projects and near mine opportunities:
• Potentially significant extension to the East Gouldie Zone at the Odyssey Project
• Drilling focused on Doris mine and Madrid deposit at Hope Bay
• Best drill hole intersection ever reported from Upper Beaver in Kirkland Lake
Strategy drives consistent share price outperformance
J.P. Morgan 2021 Energy, Power & Renewables Conference 20Click to edit Master title style
APPENDIX
J.P. Morgan 2021 Energy, Power & Renewables ConferenceOperating Results
Record Quarterly Production
Q1 2021
Production* Total Cash Costs** Operating Margin
(Gold oz) ($/oz) ($000’s)
Northern Business
LaRonde Complex 93,078 $541 $106,326
Goldex 34,650 $623 $38,739
Canadian Malartic (50%) 89,550 $617 $103,748
Kittila 60,716 $798 $58,703
Meadowbank 79,965 $1,123 $49,950
Meliadine 96,126 $628 $100,961
Southern Business
Pinos Altos 29,175 $838 $26,426
Creston Mascota 4,252 $193 $7,634
La India 17,033 $936 $18,275
Total – excluding Hope Bay 504,545 $729 $510,762
Hope Bay 12,259 $929 $11,230
Total 516,804 $734 $521,992
* Gold production includes pre-commercial production from Tiriganiaq at Meliadine (8.1koz in Q1 2021)
** Excludes pre-commercial production
Q1 2021 Revenue by Metal Q1 2021 Total Operating Margin – $522.0M
LaRonde
Creston Complex, 20%
Mascota, 2%
Base Metals Hope Bay, 2%
1%
Gold La India, 4% Canadian Malartic (50%),
97% 20%
Silver Pinos Altos, 5%
2%
Goldex, 7%
Meliadine, 19%
Meadowbank, 10%
Kittila, 11%
J.P. Morgan 2021 Energy, Power & Renewables Conference 22Financial Highlights
Operating Results Drive Strong Cash Flow
Q1 2021 Q1 2020
Realized Gold Price ($/oz) $1,780 $1,579
Revenues (millions) $934.4 $671.9
Net Income (loss) (millions) $136.1 ($21.6)
Net Income (loss) per share (basic) $0.56 ($0.09)
Cash provided by operating activities* (millions) $356.4 $163.4
Operating Cash flow per share * (basic) $1.47 $0.68
* After changes in non-cash components of w orking capital
J.P. Morgan 2021 Energy, Power & Renewables Conference 23Financial Position
Financial Flexibility Remains Strong After Acquisition of TMAC Resources
As of March 31, 2021, the Company
Strong Available Liquidity - $1.3B* had strong liquidity with $132.0M in
cash and cash equivalents and $1.2B
$132 M (excluding $300M accordion) in
undrawn credit lines available
In Q1 2021, a total of ~$340.9 million
$1,200 M was spent in connection with the
acquisition of TMAC Resources Inc.
Cash and cash equivalents Undrawn credit facilities
Low share count of 244M fully diluted
shares after 63 years of operating
*As at March 31, 2021, excluding $300M accordion history
Debt Maturities** Committed to maintaining an
investment grade credit rating.
$300 DBRS Morningstar and Fitch Ratings
$250 $225
$250
reaffirmed credit ratings in April 2021
$200
$200
$150 $155
$150
$110
$100
$100 $100 $90 $100 $95 Agency Rating
$50 Fitch BBB (Stable)
$- $-
$- DBRS BBB (Stable)
2021 2022 2023 2024 2025 2026 2027 2028 2029 2030 2031 2032 2033
**As at March 31, 2021, million Moody’s Baa2 (Stable)
J.P. Morgan 2021 Energy, Power & Renewables Conference 24Abitibi Region
Production Q1 2021 Production Highlights
and Costs
LaRonde Complex
93,078 ozs • Ramp-up of mining activities in the West mine area at the LaRonde mine continues to progress as planned. An average
production rate of 1,221 tpd wasachieved, slightly above the forecast of 1,150 tpd
at a production cost of • LZ5 mine achieved a record production of 3,140 tpd, well above forecast. The strong performance was driven by continuous
$688/oz and total optimization of automated equipment
cash costs of $541/oz
• Production from automated equipment was above targets both at LaRonde (26% of mucking done from surface) and LZ5 (21%
Proven & probable of the production mucking and hauling done from surface)
gold reserves: 3.8Moz • A planned ten-day maintenance shutdown wascompleted in May 2021 at the LaRonde Complex.
• Three exploration drifts being developed to explore areas located 1 to 3 km from surface below LZ5 and west of the 20N Zone
are progressing as planned. Initial exploration drilling is expected to commence in Q3 2021
Canadian Malartic (50%)
89,550 ozs • In Q1 2021, record tonnes were mined in January. Mill performance was above target, processing 5,262,686 tonnes (or 58,467
tpd) (100% basis) in Q1 2021
at a production cost of • At Barnat pit, overburden stripping was completed in April 2021. Softer ground conditions are expected to increase the milling
$619/oz and total rate
cash costs of $617/oz
• Tailings disposal is expected to transition to in-pit deposition once the Canadian Malartic pit is completed in 2023. The
Proven & probable Canadian Malartic team is developing a plan to increase the flexibility for tailings disposal prior to the transition
gold reserves: 2.2Moz • At the Odyssey U/G project, the ramp is progressing on schedule and on budget. Approximately 362m of development were
completed in Q1 2021. In addition, shaft preparation work is underway. Construction on the headframe foundation is expected
to start in Q2 2021
• Drilling has identified a potentially significant extension to East Gouldie suggesting that the current mineral resources could be
expanded significantly down-plunge towardsthe east
Goldex
34,650 ozs • The Rail-Veyor operated above target at 7,065 tpd in Q1 2021 and for the first time the Rail-Veyor was operated remotely from
surface. The demonstrated ability to operate the Rail-Veyor from surface is expected to provide additional operational flexibility
at a production cost of and help facilitate an expansion to 7,500 tpd early in 2022
$650/oz and total • In Q1 2021, production commenced in the South Zone sector 2. Production from the higher-grade South Zone is expected to
cash costs of $623/oz increase from the current rate of 375 tpd to 750 tpd in H2 2021
• In May 2021, Goldex completed a scheduled five-day shutdown for underground maintenance to change liners in the loading
Proven & probable
station silo and a concurrent seven-day shutdown at surface for maintenance to the electrical substation and secondary crusher
gold reserves: 1.1Moz
mainframe
See AEM February 11, 2021 press release and appendix for detailed breakdown of mineral reserves and J.P. Morgan 2021 Energy, Power & Renewables Conference 25
mineral resources.Nunavut
Production Q1 2021 Production Highlights
and Costs
Meadow bank
79,965 ozs • Total ore milled wasabove target due to strong mining and milling performance and softer ore conditions than anticipated
• The long-haul truck fleet showed improved performance through the quarter, with the best month ever in March with over
at a production cost of 343kt hauled. The performance for the quarter was negatively affected by more road closures than expected due to severe
$1,092/oz and total cash weather conditions
costs of $1,123/oz
• Gold production in Q2 2021 is expected to be similar to Q1 2021, subject to the duration of the caribou migration
Proven & probable gold • A scheduled five-day mill shut down was completed in April 2021 to perform maintenance work and replace SAG and ball mill
reserves: 2.9Moz liners
• Underground ramp development at Amaruq was on target with 533m completed in Q1 2021. Engineering and procurement
activitiesare progressing well for the U/G mining fleet, HPGR, ventilation system, mine dry and Genset installation
Meliadine
88,003 ozs* • Strong performance wasachieved in almost all aspects of the operation in Q1 2021
• Processed tonnage was on target at an average rate of approximately 4,600 tpd, combined with higher processed grade due
at a production cost of to changesin the mining sequence which facilitated earlier access to higher grade stopes
$679/oz and total cash
costs of $628/oz • The change in the mining sequence is expected to result in lower gold production in Q2 2021
• A planned four-day shut down wascompleted in April 2021 to perform maintenance work at the mill
Proven & probable gold
reserves: 4.0Moz • Phase 2 expansion work is progressing as planned, with throughput levels expected to reach 4,800 tpd in Q4 2021 and 6,000
tpd in 2025
** Includes pre-commercial production of 8,123 ozs at the Tiriganiaq pit • Exploration drilling in Q1 2021 at both the Pump South and Wesmeg deposits yielded favourable intersections suggesting
strong potential for resource continuity at depth
Hope Bay
12,259 ozs • Mill performance improvements continued in Q1 2021, with recoveriesexceeding 90%
• Ore is currently being sourced from the high-grade BTD Zone, which shows potential for expansion (drill testing is underway).
at a production cost of Ore production ranged from 600 to 750 tpd
$1,964/oz and total cash
costs of $929/oz • Development of the DCN Zone is expected to begin in Q2 2021 on levels 201 and 221. Access to this zone is expected to
increase underground productivity
• Reviewing several low-cost optimization opportunities designed to improve mining and milling operations (additional leach
tank capacity, construction of a small mine dry and maintenance facility, purchase of a modular CRF plant for DCN backfilling
requirements)
• An internal team has been established to evaluate expanded production scenarios that would potentially involve the Madrid
and Boston deposits
• During Q1 2021, exploration was focused on the Doris area. Highlights include: 9.8 g/t gold over 16.7m at 343m depth in the
BTD Extension and 11.6 g/t gold over 7.4m at 203m depth at the DCN Zone
See AEM February 11, 2021 press release and appendix for detailed breakdown of mineral reserves and J.P. Morgan 2021 Energy, Power & Renewables Conference
mineral resources. 26Finland
Production Q1 2021 Production Highlights
and Costs
Kittila
60,716 ozs • Strong underground ore production (519kt) wasachieved in Q1 2021
• Record set in March 2021 for monthly gold production (23koz) and monthly mill feed volume (181kt)
at a production cost of
• Decrease in U/G mining costs primarily due to the transition from U/G development contractor to Agnico personnel
$801/oz and total cash
costs of $798/oz • Autonomous production drilling and haulage trials were successful in Q1 2021. The Company is analyzing the integration of
this technology into current mining operations
Proven & probable gold • In June 2021, there is a planned 11-day shutdown at the mill for regular yearly maintenance on the autoclave
reserves: 4.1Moz
• The Kittila shaft project remains on budget, but the shaft commissioning could be delayed beyond H1 2022 due to COVID-19
travel restrictions affecting the shaft contractor
• Underground, the new main haulage level (900m level) is progressing on budget and ahead of schedule
See AEM February 11, 2021 press release and appendix for detailed breakdown of mineral reserves and J.P. Morgan 2021 Energy, Power & Renewables Conference 27
mineral resources.Mexico Operations
Production Q1 2021 Production Highlights
and Costs
Pinos Altos
29,175 ozs • In Q1 2021, a planned 42-hour shutdown wascompleted at the processing plant for the maintenance of the SAG mill
• Underground production at Sinter progressed well and contributed to the higher than planned throughput at the mill. The paste
at a production cost of fill project is expected to be ready for Q4 2021 at which point Sinter is expected to achieve its full production capacity
$1,097/oz and total • At Cubiro development productivity was affected by a reduction in contractor staffing related to COVID-19 issues. The
cash costs of $838/oz development plan was adjusted to prioritize the drifts to access the western area of Cubiro and accelerate the exploration
Proven & probable program
gold reserves: 0.9Moz • The ore sorting pilot plant wasrestarted in early March 2021 with ore from the Sinter deposit
• At Reyna de Plata East, the permitting processcontinuesto be on track
Creston Mascota
4,252 ozs • Closure activities progressed as per schedule in Q1 2021
at a production cost of • Minor residual leaching is expected to continue into Q2 2021
$568/oz and total
cash costs of $193/oz
La India
17,033 ozs • Irrigation of the heap leach pads was reduced starting in March 2021 to manage the low water levels at the minesite that
resulted from low rainfall in the La India region in 2020
at a production cost of • Due to reduced solution circulation on the heap leach pads, gold production is expected to decline to approximately 7 to 8koz in
$948/oz and total Q2 2021. Mining and ore stacking will continue through that period and full leaching activities are expected to return to more
cash costs of $936/oz normalized levels in H2 2021
• In order to help mitigate the lower water levels, the Company is drilling additional water wells and is upgrading the pumping
Proven & probable system at Chipriona prior to the start of the rainy season
gold reserves: 0.3Moz
• The La India heap leach pad construction phase III is approximately 81% complete and it is expected to be finished in May
2021
• Pilot plant testing on sulphide oresfrom Chipriona and La India are expected to commence later in the year
Santa Gertrudis
• Agnico Eagle holds a 100% interest in the 42,000-hectare Santa Gertrudis gold property. Three favorable geological trends with
a potential strike length of 18 km have been identified with limited drilling between deposits
• Inferred mineral resources increased 39% (457,000 ounces of gold) mainly due to exploration drilling at the Amelia
underground deposit. Inferred mineral resources at Santa Gertrudis now total 1.6 million ounces of gold at year end 2020 –
879,000 ounces of gold (7.9 million tonnes grading 3,43 g/t gold) in underground inferred mineral resources and 750,000 million
ouncesof gold (19.7 million tonnesgrading 1.18 g/t gold) in open-pit inferred mineral resources
• Evaluation of known mineralized trends with a view to potentially restart operations at this past-producing heap leach mine
continued in 2021. The high-grade mineralization at Amelia creates the potential to add a mill circuit to process higher grade
sulphide ore from underground. Additional drilling is planned in 2021 to upgrade and expand oxide and sulphide mineral
resources
See AEM February 11, 2021 press release and appendix for detailed breakdown of mineral reserves and J.P. Morgan 2021 Energy, Power & Renewables Conference 28
mineral resources.Click to edit Master title style
Mineral Reserves and Mineral Resources
J.P. Morgan 2021 Energy, Power & Renewables ConferenceMineral Reserves - December 31, 2020
OPERATION PROVEN PROBABLE PROVEN & PROBABLE
GOLD Mining Method Ownership 000 tonnes g/t 000 oz Au 000 tonnes g/t 000 oz Au 000 tonnes g/t 000 oz Au
LaRonde Underground 100% 4,338 5.11 712 10,828 6.53 2,272 15,166 6.12 2,984
LaRonde Zone 5 Underground 100% 5,155 2.09 346 6,601 2.08 442 11,756 2.08 788
LaRonde Complex Total 9,493 3.47 1,058 17,429 4.84 2,713 26,922 4.36 3,772
Canadian Malartic Open Pit 50% 25,370 0.85 696 36,068 1.31 1,518 61,438 1.12 2,214
Goldex Underground 100% 942 2.45 74 21,179 1.53 1,040 22,121 1.57 1,115
Akasaba West Open Pit 100% - - 5,413 0.85 147 5,413 0.85 147
Amaruq Open Pit 100% 950 2.06 63 18,920 3.72 2,261 19,870 3.64 2,324
Amaruq Underground 100% - - 3,316 5.29 564 3,316 5.29 564
Amaruq Total 950 2.06 63 22,236 3.95 2,825 23,186 3.87 2,888
Meadowbank Open Pit 100% 34 2.34 3 - - 34 2.34 3
Meadowbank Complex Total 983 2.07 65 22,236 3.95 2,825 23,220 3.87 2,891
Meliadine Open Pit 100% 181 4.10 24 5,460 4.70 826 5,640 4.68 850
Meliadine Underground 100% 1,288 7.28 301 14,342 6.23 2,874 15,629 6.32 3,175
Meliadine Total 1,468 6.89 325 19,801 5.81 3,700 21,270 5.89 4,025
Upper Beaver Underground 100% - - 7,992 5.43 1,395 7,992 5.43 1,395
Hammond Reef Open Pit 100% - - 123,473 0.84 3,323 123,473 0.84 3,323
Kittila Underground 100% 2,999 4.23 408 27,434 4.15 3,659 30,433 4.16 4,067
Pinos Altos Open Pit 100% 62 0.88 2 3,605 1.26 146 3,667 1.25 148
Pinos Altos Underground 100% 2,691 2.21 191 7,105 2.36 539 9,796 2.32 731
Pinos Altos Total 2,753 2.18 193 10,710 1.99 685 13,463 2.03 878
La India Open Pit 100% 89 0.35 1 11,939 0.66 255 12,029 0.66 256
Total 44,098 1.99 2,821 303,675 2.18 21,261 347,773 2.15 24,082
SILVER Mining Method Ownership 000 tonnes g/t 000 oz Ag 000 tonnes g/t 000 oz Ag 000 tonnes g/t 000 oz Ag
LaRonde Underground 100% 4,338 15.59 2,173 10,828 18.81 6,548 15,166 17.89 8,722
Pinos Altos Open Pit 100% 62 13.24 27 3,605 33.68 3,904 3,667 33.34 3,931
Pinos Altos Underground 100% 2,691 54.31 4,698 7,105 49.28 11,257 9,796 50.66 15,956
Pinos Altos Total 2,753 53.38 4,725 10,710 44.03 15,162 13,463 45.94 19,886
La India Open Pit 100% 89 1.38 4 11,939 3.01 1,155 12,029 3.00 1,159
Total 7,180 29.90 6,902 33,478 21.24 22,865 40,658 22.77 29,767
COPPER Mining Method Ownership 000 tonnes % tonnes Cu 000 tonnes % tonnes Cu 000 tonnes % tonnes Cu
LaRonde Underground 100% 4,338 0.21 9,291 10,828 0.28 29,826 15,166 0.26 39,117
Akasaba West Open Pit 100% - - 5,413 0.48 25,891 5,413 0.48 25,891
Upper Beaver Underground 100% - - 7,992 0.25 19,980 7,992 0.25 19,980
Total 4,338 0.21 9,291 24,233 0.31 75,696 28,571 0.30 84,987
Z INC Mining Method Ownership 000 tonnes % tonnes Z n 000 tonnes % tonnes Z n 000 tonnes % tonnes Z n
LaRonde Underground 100% 4,338 0.53 22,894 10,828 0.85 92,560 15,166 0.76 115,454
Total 4,338 0.53 22,894 10,828 0.85 92,560 15,166 0.76 115,454
J.P. Morgan 2021 Energy, Power & Renewables Conference 30Mineral Resources - December 31, 2020 OPERATION MEASU RED INDICATED MEASU RED & INDICATED INFERRED GOLD Mining Method Ownership 000 tonnes g/t 000 oz Au 000 tonnes g/t 000 oz Au 000 tonnes g/t 000 oz Au 000 tonnes g/t 000 oz Au LaRonde Underground 100% - - 4,904 3.55 560 4,904 3.55 560 6,369 4.54 931 LaRonde Zone 5 Underground 100% - - 12,218 1.98 776 12,218 1.98 776 15,130 2.88 1,399 LaRonde Complex Total - - 17,122 2.43 1,336 17,122 2.43 1,336 21,499 3.37 2,330 Canadian Malartic Open Pit 50% 149 0.55 3 538 0.59 10 686 0.58 13 3,532 0.74 85 Canadian Malartic Underground 50% - - 2,028 1.42 92 2,028 1.42 92 156 1.52 8 Canadian Malartic Total 149 0.55 3 2,566 1.24 103 2,715 1.21 105 3,688 0.78 92 Odyssey Underground 50% - - 1,000 1.90 61 1,000 1.90 61 13,853 2.05 913 East Malartic Underground 50% - - 5,658 2.03 368 5,658 2.03 368 43,444 1.91 2,669 East Gouldie Underground 50% - - - - - - 31,469 3.17 3,209 Goldex Underground 100% 12,360 1.86 739 19,247 1.53 944 31,607 1.66 1,683 24,812 1.49 1,191 Akasaba West Open Pit 100% - - 4,870 0.63 98 4,870 0.63 98 - - Zulapa Open Pit 100% - - - - - - 391 3.14 39 Meadowbank Open Pit 100% - - 1,145 2.46 90 1,145 2.46 90 4 2.06 0 Amaruq Open Pit 100% - - 7,022 2.53 570 7,022 2.53 570 886 2.65 75 Amaruq Underground 100% - - 6,571 4.28 904 6,571 4.28 904 7,924 4.70 1,198 Amaruq Total - - 13,593 3.37 1,474 13,593 3.37 1,474 8,810 4.50 1,273 Meadowbank Complex Total - - 14,738 3.30 1,564 14,738 3.30 1,564 8,814 4.49 1,274 Meliadine Open Pit 100% - - 6,917 3.00 668 6,917 3.00 668 816 4.23 111 Meliadine Underground 100% 81 3.66 10 11,779 3.83 1,452 11,860 3.83 1,461 11,451 5.94 2,186 Meliadine Total 81 3.66 10 18,697 3.53 2,120 18,777 3.53 2,129 12,267 5.82 2,297 Hammond Reef Open Pit 100% 47,063 0.54 819 86,304 0.53 1,478 133,367 0.54 2,298 - - Upper Beaver Underground 100% - - 3,636 3.45 403 3,636 3.45 403 8,688 5.07 1,416 AK Project Underground 100% - - 1,268 6.51 265 1,268 6.51 265 2,373 5.32 406 Anoki-McBean Underground 100% - - 1,868 5.33 320 1,868 5.33 320 2,526 4.70 382 Upper Canada Open Pit 100% - - 2,006 1.62 104 2,006 1.62 104 1,020 1.44 47 Upper Canada Underground 100% - - 8,433 2.28 618 8,433 2.28 618 17,588 3.21 1,816 U pper Canada Total - - 10,439 2.15 722 10,439 2.15 722 18,608 3.11 1,863 Kittila Open Pit 100% - - 229 3.41 25 229 3.41 25 373 3.89 47 Kittila Underground 100% 4,748 2.44 372 17,999 2.51 1,452 22,747 2.49 1,824 11,620 3.77 1,408 Kittila Total 4,748 2.44 372 18,228 2.52 1,477 22,976 2.50 1,849 11,993 3.77 1,454 Kuotko Open Pit 100% - - - - - - 284 3.18 29 Kylmäkangas Underground 100% - - - - - - 1,896 4.11 250 Barsele Open Pit 55% - - 3,178 1.08 111 3,178 1.08 111 2,260 1.25 91 Barsele Underground 55% - - 1,158 1.77 66 1,158 1.77 66 13,552 2.10 914 Barsele Total - - 4,335 1.27 176 4,335 1.27 176 15,811 1.98 1,005 Pinos Altos Open Pit 100% - - 1,734 0.81 45 1,734 0.81 45 468 1.18 18 Pinos Altos Underground 100% - - 15,701 1.66 837 15,701 1.66 837 3,090 1.86 185 Pinos Altos Total - - 17,436 1.57 882 17,436 1.57 882 3,558 1.77 203 La India Open Pit 100% 9,781 0.87 274 1,309 0.73 31 11,091 0.85 305 419 0.55 7 Tarachi Open Pit 100% - - 22,665 0.40 294 22,665 0.40 294 6,476 0.33 68 Chipriona Open Pit 100% - - 1,266 1.08 44 1,266 1.08 44 12,799 0.68 278 El Barqueño Gold Open Pit 100% - - 8,834 1.16 331 8,834 1.16 331 9,628 1.13 351 Santa Gertrudis Open Pit 100% - - 5,778 0.60 111 5,778 0.60 111 19,691 1.18 746 Santa Gertrudis Underground 100% - - - - - - 7,980 3.43 879 Santa Gertrudis Total - - 5,778 0.60 111 5,778 0.60 111 27,671 1.83 1,625 Total 74,182 0.93 2,216 267,264 1.53 13,130 341,446 1.40 15,346 282,965 2.57 23,351 Mineral reserves are not a subset of mineral resources. Tonnage amounts and contained metal amounts presented in this table have J.P. Morgan 2021 Energy, Power & Renewables Conference 31 been rounded to the nearest thousand, so aggregate amounts may differ from column totals.
Mineral Resources - December 31, 2020
OPERATION                                                                       MEASU RED                      INDICATED               MEASU RED & INDICATED                  INFERRED
SILVER                           Mining Method Ownership            000 tonnes     g/t    000 oz Ag 000 tonnes     g/t    000 oz Ag 000 tonnes   g/t    000 oz Ag 000 tonnes      g/t    000 oz Ag
LaRonde                           Underground    100%                           -                  -       4,904    21.39       3,372      4,904  21.39       3,372      6,369     23.98      4,911
Kylmäkangas                       Underground    100%                           -                  -            -                   -          -                  -      1,896     31.11      1,896
Pinos Altos                         Open Pit     100%                           -                  -       1,734    16.45         917      1,734  16.45         917        468     42.00        632
Pinos Altos                       Underground    100%                           -                  -      15,701    44.18      22,303     15,701  44.18      22,303      3,090     50.41      5,008
Pinos Altos Total                                                               -                  -     17,436     41.42     23,221     17,436  41.42      23,221       3,558    49.31       5,640
La India                             Open Pit           100%                9,781    5.37      1,690       1,309     4.04         170     11,091   5.22       1,860        419      3.09         42
Chipriona                            Open Pit           100%                    -                  -       1,266    49.81       2,028      1,266  49.81       2,028     12,799     75.59     31,104
El Barqueño Silver                   Open Pit           100%                    -                  -            -                   -          -                  -      4,393   124.06      17,523
El Barqueño Gold                     Open Pit           100%                    -                  -       8,834     4.73       1,343      8,834   4.73       1,343      9,628     16.86      5,218
Santa Gertrudis                      Open Pit           100%                    -                  -       5,778     4.39         816      5,778   4.39         816     19,691      1.90      1,200
Santa Gertrudis                    Underground          100%                    -                  -            -                   -          -                  -      7,980     25.39      6,515
Santa Gertrudis Total                                                           -                  -            -                   -          -                  -    27,610       8.67      7,715
Total                                                                     9,781        5.37          1,690          39,528       24.35         30,950          49,309        20.59        32,640           66,733       34.51      74,050

COPPER                           Mining Method Ownership            000 tonnes         %        tonnes Cu        000 tonnes        %     tonnes Cu 000 tonnes                  %     tonnes Cu 000 tonnes                 %     tonnes Cu
LaRonde                           Underground    100%                            -                           -         4,904        0.13      6,371       4,904                 0.13      6,371       6,369                0.27     17,352
Akasaba West                        Open Pit     100%                            -                           -         4,870        0.37     18,246       4,870                 0.37     18,246           -                               -
Upper Beaver                      Underground    100%                            -                           -         3,636        0.14      5,135       3,636                 0.14      5,135       8,688                0.20     17,284
Chipriona                           Open Pit     100%                            -                           -         1,266        0.03        404       1,266                 0.03        404      12,799                0.13     16,670
El Barqueño Gold                    Open Pit     100%                            -                           -         8,834        0.19     16,400       8,834                 0.19     16,400       9,628                0.22     21,152
Total                                                                            -                           -      23,511         0.20        46,555          23,511         0.20        46,555           37,484         0.19     72,458

Z INC                            Mining Method Ownership            000 tonnes         %        tonnes Z n       000 tonnes        %     tonnes Z n 000 tonnes                 %     tonnes Z n 000 tonnes                %     tonnes Z n
LaRonde                           Underground    100%                            -                           -         4,904        0.81     39,560        4,904                0.81     39,560        6,369               1.96    124,660
Chipriona                           Open Pit     100%                            -                           -         1,266        1.31     16,569        1,266                1.31     16,569       12,799               0.81    103,906
Total                                                                            -                           -       6,171         0.91        56,129            6,171        0.91        56,129           19,168         1.19   228,566
 Mineral reserves are not a subset of mineral resources. Tonnage amounts and contained metal amounts presented in this table have been rounded to the nearest thousand, so aggregate amounts may differ from column totals.

                                                                                                                                                        J.P. Morgan 2021 Energy, Power & Renewables Conference                          32
Notes to Investors Regarding The Use of Mineral Resources
Notes to Inv estors Regarding the Use of Mineral Resources
The mineral r eserv e and mineral resource estimates contained in this presentation hav e been prepared in accordance with The Canadia n Securities Administrators' NI 43-101. These standards are
similar to those used by SEC Industry Guide No. 7, as interpreted by the SEC staff. Howev er, the def initions in NI 43-101 diff er in certain respects f rom those under SEC Industry Guide 7.
Accordingly , mineral reserv e and mineral resource inf ormation contained in this news release may not be comparable to similar inf ormation disclosed by United States companies. Under the SEC's
Industry Guide 7, mineralization may not be classif ied as a "reserv e" unless the determination has been made that the mineralization could b e economically and legally produced or extracted at the
time the reserv e determination is made.
For United States reporting purposes, the SEC has adopted amendments to its disclosure rules (the "SEC Mod erni zation Rules") to moderni ze the mining pro perty disclosure requirements f or
issuers whose securities are registered with the S EC under the United States Securities Exchange Act of 1934, as amended (the "Exchange Act"), which became eff ective February 25, 2019. The
SEC Moderni zation Rules more closely align the SEC's disclosure requirements and policies f or mining properties with current industry and global regulatory practices and standards, including NI 43-
101, and replace the historical property disclosure requirements f or mining registrants that were included in SEC Industry Guide 7. Issuers must begin to comply with the SEC Moderni zation Rules in
their f irst f iscal y ear beginning on or af ter January 1, 2021, though Canadian issuers that report in the United States using the Multijurisdictional Disclosure System ("MJDS") may still use NI 43-101
rather than the SEC Modernization Rules when using the SEC's MJDS registration statement and annual report f orms.
As a result of the adoption of the SEC Moderni zation Rules, the SEC no w recogni zes estimates of "measured mineral resources", "indicated mineral resources" and "inf erred mineral resources." In
addition, the SEC has amended def initions of "prov en mineral reserv es" and "probabl e mineral reserv es" in the SEC Mod erni zation Rules, with def initions that are substantially similar to those used
in NI 43-101.
United States inv estors are cautioned that while the SEC now recognizes "measure d mineral resources", "indicated mineral resources" and "inf erred mineral resources", inv estors should not assume
that any part or all of the mineral deposits in these categories will ev er be conv erted into a higher category of mineral resources or into mineral reserv es. These terms hav e a great amount of
uncertainty as to their economic and legal f easibility. Under Canadian regulations, estimates of inf erred mineral resources may not f orm the basis of f easibility or pre-f easibility studies, except in
limited circumstances. Inv estors are cautioned not to assume that any "measured mineral resources", "indicated mineral resources", or "inf erred mineral resources" that the Company reports in this
news release are or will be economically or legally mineable.
Further, "inf erred mineral resources" hav e a great amount of uncertainty as to their existence and as to their economic and legal f easibility. It cannot be assumed that any part or all of an inf erred
mineral resource will ev er be upgraded to a higher category .
The mineral reserv e and mineral resource data set out in this news release are estimates, and no assurance can be giv en that the anticipated tonnages and grades will be achiev ed or that the
indicated lev el of recov ery will be realized. The Company does not include equiv alent gold ounces f or by -product metals contained in mineral reserv es in its calculation of contained ounces and
mineral reserv es are not reported as a subset of mineral resources.
Assumptions used for the December 31, 2020 mineral reserves estimate at all mines and adv anced proj ects reported by the Company
Metal prices Exchange rates
Mexican peso per
Gold (US$/oz) Silver (US$/oz) Copper (US$/lb) Zinc (US$/lb) C$ per US$1.00 US$ per €1.00
US$1.00
Operations and proj ects $1,250 $17 $2.75 $1.00 C$1.30 MXP18.00 US$1.15
Hammond Reef $1,350 Not applicable Not applicable Not applicable C$1.30 Not applicable Not applicable
Upper Beav er* $1,200 Not applicable $2.75 Not applicable C$1.25 Not applicable Not applicable
*The Upper Beaver project has a net smelter return (NSR) cut-off value of C$125/tonne
J.P. Morgan 2021 Energy, Power & Renewables Conference 33You can also read