SHORT-TERM OUTLOOK FOR EU AGRICULTURAL MARKETS IN 2020 - SPRING 2020 - Cooperativas Agro ...
←
→
Page content transcription
If your browser does not render page correctly, please read the page content below
SHORT-TERM OUTLOOK
              FOR EU AGRICULTURAL MARKETS
              IN 2020

              SPRING 2020
              Edition N°26

Agriculture
and Rural
Development
Executive Summary

Manuscript completed in April 2020
European Commission
© European Union, 2020
Reuse is authorised provided the source is acknowledged.
The reuse policy of European Commission documents is regulated by Decision 2011/833/EU (OJ L 330, 14.12.2011, p. 39).
For any use or reproduction of photos or other material that is not under the copyright of the European Union, permission must be sought directly from the copyright holders.

EN PDF ISSN 2600-0873                        KF-AR-20-001-EN-N

While all efforts are made to provide sound market projections, uncertainties remain.
The contents of this publication do not necessarily reflect the position or opinion of the European Commission.

Contact: DG Agriculture and Rural Development, Analysis and Outlook Unit
Email: agri-C2@ec.europa.eu
https://ec.europa.eu/info/food-farming-fisheries/farming/facts-and-figures/markets/outlook/short-term_en
Please cite this publication as: EC (2020), Short-term outlook for EU agricultural markets in 2020.
European Commission, DG Agriculture and Rural Development, Brussels.

Highlights
                                                         The Covid-19 outbreak and its dramatic                    In the EU, the immediate impact has been
This short-term outlook edition coincides with the       consequences have cast a fresh light on the               concentrated in logistics, with disruptions in just-in-
                                                         importance of maintaining resilient food supply           time supply chains, which have by and large subsided
unfolding of the Covid-19 crisis, making the
                                                         chains. With no concerns of food shortage, the EU         in a matter of days following health policy measures.
exercise    exceptionally     challenging.    Market     agri-food sector has so far responded remarkably          Ensuring free movement of both labour and goods,
forecasts are based on market intelligence               well to challenges of historical magnitude. Thanks to     within the EU and globally, will remain critical.
                                                         sustained food demand, EU agriculture has suffered
available at the beginning of April 2020 and                                                                       In the short term, confinement measures and the
                                                         relatively less damage compared to other parts of the
                                                                                                                   closure of sectors like hospitality, tourism or travel
reflect the Covid-19 impact to the extent possible,      economy which are being more affected by lockdown
                                                                                                                   have required redirecting supplies from foodservices
                                                         measures. There have been, however, specific
with all the caveats and limitations in view of the                                                                to retail for direct purchase by consumers locked down
                                                         impacts and certain agricultural sectors have been hit
rapidly evolving situation. In addition, for the first                                                             at home, with further challenges due to differences in
                                                         more severely than others. Beyond labour issues and
                                                                                                                   consumption patterns and packaging.
time market outlooks are presented for EU-27,            logistical bottlenecks, the EU food supply chain has to
                                                         continue adapting to rapid changes in demand, with
and assume a frictionless trade between the EU
                                                         strong uncertainties on the duration of the crisis and
and the UK in 2020.                                      the recovery path in the EU and globally.
Highlights
Despite these early signs of resilience of the EU         The length of lockdown measures, the exit strategies        - Compared to foodservice, food consumed at home
agri-food sector, the expected depth of the economic      and the economic stimulus which will be implemented         differs in terms of product characteristics, packaging,
recession is bound to significantly impact food demand,   in the EU and globally, as well as international            quality and volume. For example, high-value beef cuts
in particular that of high-value products, animal         cooperation to avoid trade-restrictive measures, will be    or lamb, wine and specialty cheeses see a larger share
products such as dairy, and export-oriented sectors       crucial in this respect.                                    of their output consumed in restaurants. Temporary
such as wine. However, compared to the 2010 crisis,                                                                   lack of packaging material has also been signalled.
                                                          - Confinement measures adopted by the majority of
when stocks of agricultural bulk commodities were
                                                          Member States led to stockpiling behaviour at               - Restrictions of movement and controls at national
historically low, current stocks are high and harvest
                                                          household level and short-lived spikes in retail sales.     borders within the EU have created obstacles in
prospects correct. Input costs have declined, with very
                                                          Staple food profited the most from the switch to home       deliveries of agricultural raw materials and food in the
low energy costs which should be translated in lower
                                                          consumption: pasta, rice, flour, potatoes, canned fruit     first half of March 2020. The early adoption of EU
fertiliser prices.
                                                          and vegetables, UHT milk, orange juice, tomato sauce        guidelines for border management measures, to protect
The extent and the recovery path of the current crisis    and olive oil, reflecting varying national food cultures.   health and ensure the availability of goods and
remain to be seen, especially because of the              Consumption of fresh fruit and vegetables, and fresh        essential services (including green lanes for transport
asymmetry in its geographical distribution: starting in   dairy products has also risen. At the same time, a          of all goods), has quickly helped improving the
Asia, moving to Europe and then the Americas, with        massive increase of demand for e-commerce has been          situation.
worrying signs in Africa.                                 observed, and direct sales by farmers to consumers
                                                          have reportedly been boosted.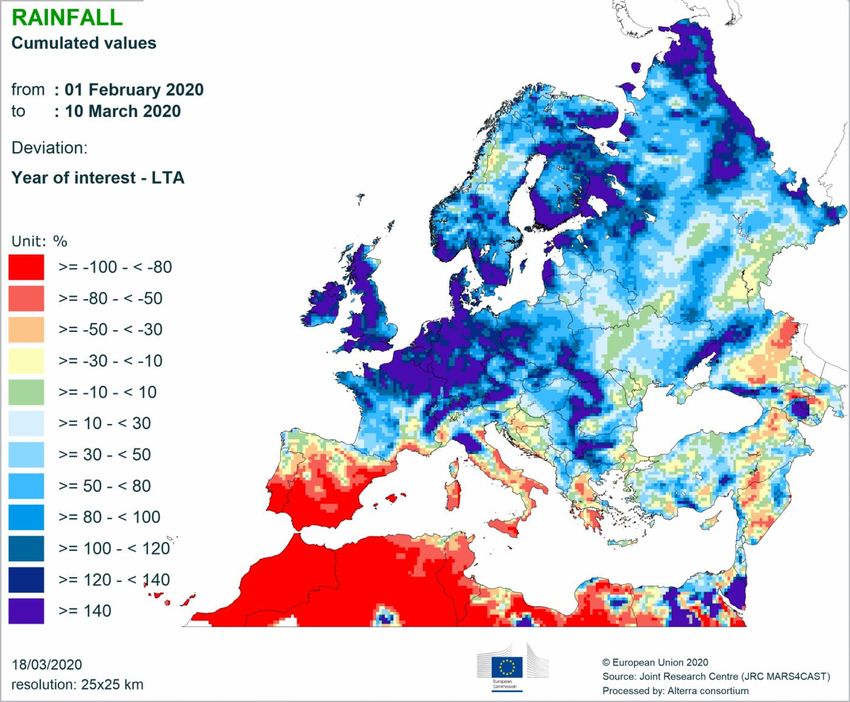
Highlights
- Labour availability remains a key concern, at all levels    the crisis peak in China, many ports were blocked due to    mineral fertilizers and is importing products from
of the food supply chain. Health reasons and                  the lack of workers and loading and unloading of            Eastern European countries (Belarus, Ukraine, Russia)
restrictions on free movement of people may                   containers was delayed, resulting in a backlog which        and North Africa (Algeria, Morocco).
temporarily reduce the availability of workers, from          takes time to recover from. Difficulties are also
                                                                                                                          As regards plant protection products and micro-
farms to transport, from warehouses and ports to retail.      mentioned on road freight, where return trips are often
                                                                                                                          nutrients for compound feed, the EU is importing from
In addition to increasing transport costs, this could         linked to non-essential economic activities that have
                                                                                                                          third countries, in particular China. While detailed
affect the product mix, favouring less labour-intensive       stopped. All these challenges have resulted in increased
                                                                                                                          quantitative data are not available, no major long-term
products, e.g. milk powders in the case of dairy. Cross-      transport and logistical costs, which may sooner or later
                                                                                                                          trade disruptions and accessibility issues have been
border and seasonal labour is crucial in sectors like fruit   be reflected in food prices.
                                                                                                                          reported across the EU.
and vegetables, and shortages in the upcoming harvest
                                                              Input markets outlook
season would be a negative factor.                                                                                        Agricultural markets outlook
                                                              Food value chains include accessibility of inputs that
- The asymmetric geographical distribution of the Covid-                                                                  In the grains and oilseeds market, ample global stocks,
                                                              are needed to produce food. This would include seeds
19 spread, together with increased hygiene                                                                                sizeable 2019/2020 harvest in the EU and
                                                              and fertilizers, plant protection products, fieldwork
requirements, has an impact on the fluidity and volumes                                                                   neighbouring countries, and good prospects in the
                                                              machinery (including spare parts) and feed additives as
of trade flows. While the functioning of ports has not                                                                    Americas for the next crop should allow a satisfactory
                                                              well as veterinary products for animals.
been disrupted, the availability of containers remains an                                                                 supply of the market in the coming months.
issue regularly mentioned by operators. At the time of        The EU is not self-sufficient in certain inputs such as
Highlights
In the oilseeds market, a decrease in EU rapeseed            In the apples and oranges markets, no Covid-19-            In the meat market, the switch from foodservice to
production and reduced demand for oilseeds, linked to        related production impacts are expected in the current     home consumption and the capacity of retail to market
a decline in biofuels demand due to low oil prices, could    marketing year. Demand for less perishable fruits like     additional meat products may influence production,
result in an overall lower supply of proteins.               apples and oranges is strong.                              particularly for beef and sheep meat that are more
                                                                                                                        negatively impacted. Despite high prices, pigmeat
In the sugar market, very low energy prices and lower        In the wine market, on top of Covid-19 challenges
                                                                                                                        production growth will be limited by environmental
demand for gasoline push the ethanol production down,        resulting in declining exports, US tariffs remain an
                                                                                                                        restrictions and remaining African Swine Fever risk. Due
and more white sugar is expected to be produced              important challenge. Confinement measures could also
                                                                                                                        to the Covid-19 crisis, the transport of live animals
instead of ethanol. With higher global supply than           affect EU consumption negatively.
                                                                                                                        could be restricted.
anticipated, world sugar prices dropped.
                                                             In the dairy market, the coincidence of the spring peak
                                                                                                                        The particularly severe impact of the Covid-19 crisis on
In the olive oil market, availabilities should remain high   of production in the EU with the Covid-19 outbreak
                                                                                                                        the flower and nursery sector, not covered in this report,
as an average production is expected, combined with a        exacerbates the downward price impact and could
                                                                                                                        needs to be mentioned, with a range of factors: most
high level of beginning stocks. Due to stockpiling, some     favour the production of more storable and less labour-
                                                                                                                        outlets have been closed (except retailers and nurseries
demand recovery could be expected in the main                intensive dairy products (milk powders) over others. The
                                                                                                                        in some Member States), Easter was one of the three
producing Member States, but consumption in the non-         closure of foodservice and outdoor/farmers’ markets
                                                                                                                        demand peaks in the year, and air freight has been
producing Member States is likely to decrease.               negatively affects some high-value added products
                                                                                                                        halted.
                                                             (e.g. PGI/PDO cheeses). On the other hand, other dairy
                                                             products could benefit from increased retail sales.
Macroeconomic background
MACRO-     Uncertainties around Covid-19
             The unprecedented situation amidst Covid-19 crisis
                                                                     Demand for transportation fuel plummets due to
                                                                     confinement measures. Some airline companies
                                                                     have completely suspended all flights for several

ECONOMIC
             gives signals for a major multi-faceted economic        weeks. Overall transport fuel use could decrease by
             shock, which is expected to last at least until         up to 50% during the confinement period.
             mid-2021.
                                                                     On the supply side, the breakdown of oil price

OUTLOOK
             However, it is still early to say how deep the shock    discipline early March brings an additional shock.
             will be, and to predict the speed and shape of the      With producers falling short of storage capacity, the
             recovery, especially as the crisis affects regions at   Brent crude oil price hit a lowest point in the second
             different times.                                        half of March at USD 25/barrel. Early April, OPEC
             The macroeconomic situation will very much              producers agreed to cut supply to keep prices under
             depend on the effectiveness of economic stimulus        control, however it is still unclear how that move
             measures undertaken or being considered by              will succeed.
             governments across the world.
                                                                              World crude oil price forecasts, Brent
           Confinement measures to reduce                            80
                                                                                          (USD/barrel)

           economic activities                                       60

             As the virus spreads, countries aim at limiting         40
             physical contact between people by imposing             20
             confinement measures.
                                                                      0
             Early April, IHS Markit estimates that about half of             2018         2019    2020      2021       2022
             global private consumption expenditures are at risk,         Nov. 2019        March 2020     preliminary April 2020
             especially in transport services, recreation, hotels
             and restaurants. The impact is due to hit economies     Source: IHS Markit.

             differently, as the share of reliance on tourism
             differs.
                                                                                                                                   7
Macroeconomic background
    Global recession expected                                                                Consumer price index to drop

                                 Real GDP growth rate forecasts                                               Consumer price index change rate forecasts
 6%                                                                                     5%
 4%
                                                                                        4%
 2%
 0%                                                                                     3%

-2%                                                                                     2%
-4%
                                                                                        1%
-6%
                                                                                        0%

            Euro area, November 2019                    World, November 2019
            Euro area, March 2020                       World, March 2020                                     Euro area, November 2019   World, November 2019
            Euro area, preliminary April 2020           World, preliminary April 2020                         Euro area, March 2020      World, March 2020

Source: IHS Markit.                                                                     Source: IHS Markit.

      According to the IMF, the magnitude of the crisis could be far worse than that         With a possible stagnation of economic growth and a likely recession,
      of 2008-2009: the world economy could contract by 3% year-on-year in                   unemployment rates across the EU are likely to increase. This would set
      2020, and by 7.5% in the euro area. It could rebound in 2021 to 5.8%, and to           pressure on overall consumption in value terms, and particularly value chains
      4.7% in the euro area.                                                                 targeted to export markets, as well as tourism and foodservice. As a result,
      Over 2020 and 2021, the IMF estimates that the cumulative loss to global               agricultural income will remain under pressure in this economic environment.
      GDP could amount to USD 9 trillion, which is almost half of EU’s GDP.

                                                                                                                                                                         8
Market developments in the EU
ARABLE                         CEREALS

                               Production
                                                        2019/2020

                                                           +9.4%
                                                                       2020/2021

                                                                          -2.2%
                                                                                               OILSEEDS

                                                                                               Production
                                                                                                                     2019/2020

                                                                                                                        +30%
                                                                                                                                        2020/2021

                                                                                                                                          -11%

CROPS                          Exports

                               Imports
                                                           -20%

                                                           -8.3%
                                                                          -2.2%

                                                                          -12%
                                                                                               Exports

                                                                                               Imports
                                                                                                                       +0.9%

                                                                                                                       +9.4%
                                                                                                                                          +54%

                                                                                                                                          +13%

                               Consumption                 +40%           -18%                 Consumption              +49%              +4.2%

                               PROTEIN
                                                        2019/2020      2020/2021               SUGAR                 2018/2019         2019/2020
                               CROPS
                               Production                  +4.8%         +4.4%                 Production               -17%              -1.5%

                               Exports                     -6.3%         -3.3%                 Exports                  -52%              -32%

                               Imports                     -13%           -14%                 Imports                  +47%              +6.7%

                               Consumption                 +0.2%         +0.0%                 Consumption              -2.8%             -1.0%

                               Trade is estimated based on a business as usual scenario average. Projections for 2021 calendar year are based on a
                               purely technical assumption of status quo in terms of trading relations between the EU and the UK. This is for
                               forecasting purposes only and reflects no anticipation or prediction of the outcome of the negotiations between the EU
                               and the UK on their future relationship. This means that the 2021 projection does not reflect the fact that, even in a
                               scenario where a free trade agreement is concluded, the resulting situation will be less beneficial to EU-UK trading
                               relations than when the UK was in the Internal Market and the Customs Union.
         © pawel.gaul iStock

                               For confidentiality reasons with regard to Member States notifications on stocks, EU+UK sugar balances are presented in
                               this report.

                               •Note: % compared to previous season
                                                                                                                                                         9
Cereals
                                                                                        Ample grain supplies in the world market
                                World stock-to-use ratios                              Ample global cereal availability characterises the current marketing year 2019/2020, despite the
40%
                                                                                       decline in US maize production. Following current projections, 2020/2021 global production could
30%                                                                                    reach a new peak. The wheat and maize crops are expected to be historically high. Crop conditions in
                                                                                       the US are favourable with good soil moisture combined with a rebound in total acreage. Russia and
20%                                                                                    Ukraine expect an increased production of wheat and maize, respectively.
10%                                                                                    Recently, the world wheat market has been dynamic. Sudden peaks in wheat demand from importing
                                                                                       countries and trade-limiting policies lifted the world prices (reaching last year’s level). Rice exporting
   0%                                                                                  countries also implemented trade restrictions, e.g. Cambodia and Vietnam.
                                                                                       Nevertheless, given ample supplies worldwide, prices are relatively stable. Wheat prices increased
                                                                                       while maize prices are low due to the drop in ethanol demand/production in the US.
                                Wheat       Maize       Soya beans
                                                                                        High availability and dynamic trade for the EU
Source: DG Agriculture and Rural Development, based on International Grains Council.
                                                                                       The EU cereals crop in 2019/2020 reached 294 million t (+4.5% compared to the 5-year average).
                              EU cereal net trade (million t)                          Wheat production reached 131 million t, barley 55 million t and maize 70 million t.
          60
                                                                                       Trade is dynamic on the export side, with EU wheat becoming more competitive. EU wheat exports
Exports

          40                                                                           should reach 31.8 million t. Barley exports are also picking up at 10.8 million t, after a 3-year low. On
                                                                                       the import side, maize imports are expected at 19.4 million t (+34% vs 5-year average). Durum
          20                                                                           wheat imports should reach 2.1 million t. Logistical disruptions were reported in the EU due to
                                                                                       Covid-19 border restrictions and truck drivers’ availability, but have since positively evolved.
          0
                                                                                       Staple food demand is inelastic, and its increase compared to last year was on trend. However, the
Imports

          20                                                                           impact of foodservice closure versus household consumption under lockdown measures is yet to be
                                                                                       seen. The short-term increase in food demand for staple commodities should not translate in a long-
          40                                                                           lasting trend. Wheat flour demand by the baking industry could decrease temporarily.
               2013/14 2014/15 2015/16 2016/17 2017/18 2018/19 2019/20f
                                                                                       Total compound feed demand is increasing on trend, especially with good pig and poultry market
                      Wheat       Barley      other coarse grains        Maize
                                                                                       prospects. For dairy cows, the grazing season starts with an overall good
Source: DG Agriculture and Rural Development, based on Eurostat.                       pasture situation, which could reduce the compound feed demand.
                                                                                                                                                                                            10
EU cereal production and uses in 2020/2021
Winter crop area lower but overall arable sowings up Wet conditions prevailed in many regions across the EU
EU cereals (left) and oilseeds area (right)
(% change compared to 5-year average)
4 16
2 8
0 0
-2 -8
-4 -16
Cereals Oilseeds
Winter wheat Winter barley other winter crops
Spring cereals Maize Winter rape
Spring rape Soya beans Sunflower Source:
Joint Research Center.
Source: DG Agriculture and Rural Development.
Winter sowings declined across the EU, especially triticale (-8%) and winter wheat (-3%). Winter barley and durum wheat are overall stable, though lower than their 5-year
average. Plant development of winter crops has been delayed by the wet conditions prevailing in some regions. First estimates for spring and summer crop sowings are
favourable, particularly for spring wheat (+17% compared to last year). No major issues in terms of availability of inputs linked to the Covid-19 crisis are expected (though some
local problems for seeds or spare machinery parts could arise). Fertiliser prices may even decline reflecting low energy prices.
With no major weather disruptions along the season, EU cereal production should reach 287.8 million t in 2020/2021. It is 2.2% lower than last year, but still 2.2% higher than
the 5-year average. The wheat output, both winter and spring, is expected to slightly decline to 126.1 million t, due to the higher share of spring wheat plantings.
Barley and maize production should also slightly decrease and reach 54.3 million t and 69.3 million t, respectively. Other crops outputs are expected to grow, especially oats
(+6%), rye (+5%) and durum wheat (+2%). The domestic market remains on trend, as well as the continuous increase in food and feed use.
The economic slowdown is likely to have minor effects on the overall EU staple food consumption, but could lead to a lower overall feed demand
(see dedicated section).
11Oilseeds – Oilmeals – Vegetable oils
Global soya beans Soya crop conditions in main producing Rebound of soya and rape global production in 2020/2021
balance countries (Spring 2020)
(million t) Despite a lower global soya bean crop in 2019/2020, total use increased resulting in a tightening
400 of stocks. With a good crop expected in South America and the rebound in US acreage for
380 2020/2021, good soya beans supplies should be available on the global market.
On the trade side, some disruptions in port facilities in exporting countries (Argentina, Brazil) due
360
to Covid-19 were rapidly tackled. The strengthening of the US dollar vis-à-vis national currencies
340 favoured exports from these countries.
320 Prices remain relatively low for soya beans due to the good crop prospects in major exporting
countries. Record low stocks in China and the increase in the Argentinian export taxes have
300 Not the season
Average 2020/21 contained the dip in the global market. The sharp decline in the oil price drove vegetable oils
2016-2019 Exceptional prices down. Rapeseed prices fell in Q1 2020 and are still lower than a year ago.
Supply Demand Favourable To watch
Source: DG Agriculture and Rural Development, Source: AMIS market monitor, April 2020.
Dynamic oilseed trade for the EU in 2019/2020
based on International Grains Council.
In 2019/2020, the EU market has been characterised by a low rapeseed production and a slight
EU oilseeds trade (million t) decline in crushing volumes. Rapeseed production hit a 12-year low at 14.9 million t due to a
14
lower acreage (at 5 million ha, 17% less than the 5-year average).
12
This has been partly counter-balanced by still high imports of soya beans (14.2 million t) and
10
record high imports of rapeseed (6 million t). As a result, crushing volumes declined to
8
45.1 million t, slightly less than last year’s record high (-2% year-on-year). Meal imports
6
remained relatively stable compared to previous years (+0.5% than the 5-year average).
4
Domestic use of meals is stable, but still higher than the 5-year average (+1.8%). The decline in
2
Distillers Dried Grains availability in the EU could also favour the use of protein meals for feed
0
Total oilseeds Rapeseed Soya beans Sunflower seeds
purposes. The low oil price negatively affects the demand for vegetable oils in the EU, with some
imports processing plants closing (also due to confinement measures). Thus, palm oil imports are
July-Jan average 2014-2018 July 2019-Jan 2020 expected to fall to 6.5 million t (-8% than last year).
Source: DG Agriculture and Rural Development, based on Eurostat.
12EU protein production in 2020/2021
EU 2020/2021 overall protein production to increase EU protein crops production to increase in 2020/2021
EU protein meal production EU protein crop production
(million t) (million t)
14 6
12
5
10
4
8
3
6
2
4
2 1
0 0
Rapeseed Soya beans Sunflower 2015/16 2016/17 2017/18 2018/19 2019/20e 2020/21f
2015/16 2016/17 2017/18 2018/19 2019/20e 2020/21f Field peas Broad beans Lentils Lupins Chickpeas other dry pulses
Source: DG Agriculture and Rural Development. Source: DG Agriculture and Rural Development.
Oilseed plantings are expected to modestly recover after last season’s low. They should reach 10.5 million ha (+1.4% year-on-year). This is partially due to the rebound of
winter rapeseed area (5.1 million ha, +5% year-on-year), which is still 12% below the 5-year average. Winter rapeseed area in FR is down to 1.1 million ha while areas in DE
and PL are slightly above 0.9 million ha. Production of both winter and spring rapeseed is expected to reach 16.7 million t, assuming no major weather disruptions.
Soya and sunflower sowing estimates are close to the 5-year average. Their production should increase to 3 million t and 10.2 million t, respectively. Crushing volumes could
reach 45.4 million t, supported by the need for protein meals. Domestic use of vegetable oils is expected to decrease to 22.3 million t (but the impact of Covid-19 is yet to be
fully seen).
Sowing areas of field peas and broad beans are expected to increase after a 2-year decline. They should reach 0.8 million ha and 0.5 million ha, respectively.
The production of protein crops should increase to 4.5 million t, 4% more than last year. This should be driven by good market prospects for both
food purposes (especially for peas, lentils and chickpeas) and feed usage (especially for beans). 13Sugar
World sugar prices drop as a result of low oil prices
World and EU+UK sugar prices (EUR/t) 2019/2020 EU sugar production is estimated at 17.4 million t (1.5% below the previous year),
600
mainly due to a 5% reduction in area. On the world market, the drop in oil prices and a weak
500
Brazilian rea (which translates in higher profitability for sugar, denominated in US dollar) have
400 resulted in a higher sugar production forecast in Brazil. With bad crops in India and Thailand, the
300 global market is still expected to end in deficit, but less than anticipated in earlier global forecasts.
200 As a result of the higher sugar production forecast in Brazil, world sugar prices dropped in March
100 2020. The pressure on EU+UK prices is expected to remain limited for the moment as EU exports
for the current marketing year 2019/2020 have significantly decreased, and hence direct exposure
0
to world markets is low. However, if world prices remain low, EU+UK prices should be affected.
EU+UK exports are now forecast at 1.1 million t, 32% less than in 2018/2019. Imports are forecast
EU+UK white sugar price World white sugar prices World raw sugar prices at 2 million t, slightly above the previous year. Overall, world trade is expected to slow down due to
the Covid-19 crisis and related logistical challenges in the transport of stocks to ports.
Source: DG Agriculture and Rural Development, based on Eurostat.
EU sugar beet area (million ha)
A further decrease in sugar beet area forecast for 2020/2021
1.8
1.6 EU human sugar consumption is expected to slightly drop in 2019/2020 as sugar consumed
1.4 through foodservice (e.g. ice cream, beverages) is declining due to lockdowns, despite some
1.2 increase in sugar sold through retail channels.
1.0 Global demand for biofuels is falling due to low oil prices and fuel demand is declining due to
0.8 lockdown measures. As a result, the EU 2020 biofuel production and consumption are expected to
0.6 decrease. In response to the Covid-19 crisis, EU refineries have redirected a small part of their
0.4 production capacity from fuel ethanol to alcohol for disinfectants.
0.2
Sowing for the 2020/2021 campaign started. Early forecasts of EU sugar beet area indicate a 3%
0.0
2015 2016 2017 2018 2019 2020f decrease, due to the bearish price environment of the last two years. A reduction in area is
BE DE FR NL PL other
expected in BE, DE and FR, while area could remain stable in PL and
Source: DG Agriculture and Rural Development, based on Eurostat. 2020 forecast based on national
increase in NL.
estimates or trends (no official notification yet provided). 14Market developments in the EU
SPECIALISED OLIVE OIL
Production
2018/2019
+3.4%
2019/2020
-15%
WINE
Production
2018/2019
+37%
2019/2020
-14%
CROPS Exports
Imports
+14%
-19%
-8.3%
-4.8%
Exports
Imports
-1.0%
-5.3%
-14%
-11%
© ValentinVolkov iStock
Consumption -5.8% +5.2% Consumption +2.5% -6.7%
APPLES 2018/2019 2019/2020
fresh p rocessed fresh p rocessed
Production +24% +69% -7.0% -36%
Exports +52% +94% -26% -19%
Imports -13% -31% -3.0% +6.8%
Consumption +3.1% +17% +12% -33%
ORANGES 2018/2019 2019/2020
fresh p rocessed fresh p rocessed
Production +4.3% +8.2% -2.1% -16%
Exports +11% -1.4% -5.0% -5.0% •Note: % compared to previous season
Imports -3.1% -4.5% +0.0% +0.0%
Consumption +2.5% -2.0% -1.5% -3.2%
15Olive oil
Ample availabilities continue weighing on prices in 2019/2020
EU olive oil prices per category (EUR/100kg) In 2019/2020, EU olive oil production came close to 2 million t (-15% compared to last campaign).
and stocks under private storage aid (1 000 t) The production drop in ES (-35%) will not be fully compensated by other increases, despite the
500 200 more than doubled production in IT, and recovery in EL (+43%) and PT (+30%).
400 160 Due to ample beginning stocks, overall availabilities remain high (12% above last 5-year average)
EUR/100 kg
300 120 and continue putting pressure on prices.
PSA
200 80 In order to support prices, private storage aid was activated from November 2019 to February
100 40 2020 and more than 213 000 t of olive oil was stored under this mechanism, mainly of ES origin
0 0 (92%) and lampante category (86%). These stocks will be placed back on the market by August.
2010/10
2011/04
2011/10
2012/04
2012/10
2013/04
2013/10
2014/04
2014/10
2015/04
2015/10
2016/04
2016/10
2017/04
2017/10
2018/04
2018/10
2019/04
2019/10
In February, prices started to stabilise. Most notably, the EU virgin olive oil price reversed the decline
of the last five months, but still remains 40% below the last 5-year average for the same month
PSA Extra virgin Virgin Lampante (EUR 196/100kg). Prices of lampante and extra virgin olive oil saw their decline slow down.
Source: DG Agriculture and Rural Development, based on Member States notifications. Consumption recovery expected in main producing countries
EU olive oil exports, in volume (1 000 t) and value Until February 2020, EU exports continued to grow in volume (+9% year-on-year), while falling in
75
(million EUR) 300 value ( 8%). US tariffs played an important role (US export value drop accounts for 94% of the
overall drop). The unit value of ES and IT exports to the US dropped by 22% and 12% respectively.
60 240
US tariffs, transport issues linked to Covid-19, and overall economic conditions are expected to
Volume
45 180 weaken global demand for EU olive oil, resulting in lower exports (-8%) in 2019/2020.
Value
30 120 Following confinement measures in reaction to Covid-19, retail sales of olive oil increased, in
15 60
particular in EU main producing countries. This, together with low prices, is expected to contribute to
an overall consumption recovery in those Member States (+13% year-on-year), despite foodservice
0 0 closure as retail and direct on farm sales represent around 85% of the total annual consumption.
Oct Nov Dec Jan Feb Mar Apr May June July Aug Sept
As the positioning of olive oil is different in these countries than in rest of the EU, and favourable
Value 2018/2019 Value 2019/2020
Volume 2018/2019 Volume 2019/2020
prices allowed for stocks at households’ level in the previous campaign, consumption
could drop in the rest of the EU ( 9% below last 5-year average).
Source: DG Agriculture and Rural Development, based on Eurostat.
Nevertheless, this should allow for an annual stocks reduction of around 100 000 t. 16Wine
Drop in consumption with diverse impact between wine types
EU wine production and domestic use (million hl) EU wine consumption is strongly affected by the Covid-19 measures, even though the impact
200
varies by type of wine.
150
Wine consumption in restaurants and bars has stopped (it usually represents around 30% of EU
wine consumption), as well as in agro-tourism, due to confinement measures in place. However,
wine sales through retail (70% of consumption) are increasing. These increases are, however, not
100
expected to compensate for the loss of restaurant sales.
Consumers are mainly buying average priced still wines at the detriment of sparkling wines, mostly
50
consumed for celebrations, and the highly priced wines, mainly consumed in restaurants and bars.
Based on the above, EU wine consumption in the current marketing year 2019/2020 is expected to
0
2015/16 2016/17 2017/18 2018/19 2019/20f
fall to 108 million hl, corresponding to 24 l per capita (-8% compared to the last 5-year average).
Human consumption Net trade Other uses Vinified production
Decline in exports and further increasing stocks
Source: DG Agriculture and Rural Development, based on Eurostat.
. Despite the additional import tariffs imposed by the US as from October 2019, wine exports in the
EU wine exports by destination (million hl) first half of the current marketing year 2019/2020 were 2% above exports over the same period
35
last year. Although the wine sector (in particular FR) has taken actions during these months to keep
30 its market share, this positive evolution is not expected to continue.
25 In addition, EU wine exports are impacted by Covid-19 measures in main exporting destinations, e.g.
20 China. Overall, exports are expected to fall by 14% in 2019/2020, both compared to last year and
15 to the last 5-year average.
10 EU wine imports are affected by Covid-19 to a lower extent than exports as they are mainly sold in
5
retail, even if they are also impacted by logistical problems or measures taken by the exporting
countries. However, as imports during the first half of 2019/2020 were 7% below last year’s
0
2015/16 2016/17 2017/18 2018/19 2019/20f
imports, a decrease of 11% compared to 2018/2019 is expected.
UK US Russia China Canada Switzerland Japan other These developments should lead, despite a despite a below average
2019/2020 harvest, to a further slight increase of stocks which were
Source: DG Agriculture and Rural Development, based on Eurostat.
already at a record level at the end of the previous marketing year. 17Apples
Increase in EU demand for fresh apples Strong decline in EU exports of fresh apples
EU apple production (1 000 t) and per capita consumption (kg/cap) EU fresh apple exports by destination (1 000 t)
2 000
15 000 18
12 500 15 1 600
Per capita consumption
10 000 12
Production
1 200
7 500 9
800
5 000 6
2 500 3 400
0 0
0
2014/15 2015/16 2016/17 2017/18 2018/19 2019/20f
2015/16 2016/17 2017/18 2018/19 2019/20f
EU production (fresh) EU production (processed) Losses and feed use
per capita (fresh/kg) per capita (processed/kg) Egypt Belarus UK Kazakhstan Saudi Arabia India other
Source: DG Agriculture and Rural Development, based on Eurostat. Source: DG Agriculture and Rural Development, based on Eurostat.
While the estimated EU production of apples in the current marketing year During the first 6 months of 2019/2020, EU exports of fresh apples were 5%
2019/2020 is 10% below its past 5-year average (10.8 million t), EU demand for above the same period in previous year’s record harvest year. However, exports
fresh apples is expected to be above average (+9%), thanks to higher retail sales are expected to fall by the end of the marketing year (-34% compared to the
driven by increased domestic consumption. The expected decrease in imports of last 5-year average) due to increased EU demand, lower production, and the
perishable tropical fruits due to the Covid-19 crisis air cargo transport limitations difficulties to reach some export markets (e.g. India) due to the Covid-19 crisis.
are likely to drive rising demand for EU fruit, including apples. EU exports of processed apples are expected to increase compared to the last
Apparent EU consumption for processed products is expected to decline, following 5-year average (+14%) driven by high stocks but will be
last year’s increase of stocks and lower demand due to Covid-19 measures (e.g. lower (-19%) than last year’s record.
apple compote given to schoolchildren and cider served in foodservice).
18Oranges
High prices with strong demand for oranges and orange juice
EU oranges production (1 000 t fresh equivalent)
and area (1 000 ha)
The Covid-19 crisis will have a limited impact on the 2019/2020 EU supply, as the harvest of the
7 000 300
latest varieties of oranges is ending. Production of oranges for the current marketing year is now
6 000 280
expected to reach 6.2 million t (5% below the previous year due to lower yields).
5 000 260
Production
Last weeks witnessed an increasing demand globally but also in the EU, as oranges are
Area
4 000 240
perceived as a healthy food. This concerns both fresh oranges and orange juice. The substantial
3 000 220
hike in retail sales of fresh oranges is expected to be larger than the drop of consumption in
2 000 200
foodservice.
1 000 180
0 160 The increased demand has led to price rises both globally and in the EU.
2015/16 2016/17 2017/18 2018/19 2019/20e
Production (fresh) Production (processed) Area
Source: DG Agriculture and Rural Development, based on Eurostat. Slight decrease in exports, stable imports
EU oranges trade (1 000 t fresh equivalent) EU exports of fresh oranges declined significantly in March 2020 (-13% year-on-year*), mainly
4 000 due to lower exports to China. Exports in October-March remain however close to previous year’s
2 000 level, so export volumes could recover soon. Lower EU supply, combined with strong domestic
demand and possible logistic disruptions, could nevertheless lead to a decline in exports of both
0
fresh and processed oranges, by around 5%.
2 000
2019/2020 EU imports of fresh oranges until end March are about 20% lower than in the
4 000 previous year. Boosted by strong demand, the gap to the previous year has reduced in recent
6 000
months. Moreover, South Africa, the main origin for EU imported fresh oranges, forecasts a very
good harvest in the coming weeks. Notwithstanding possible logistical disruptions for imports of
8 000
fresh oranges from South Africa and of orange juice and juice concentrates from Brazil, the
2015/16 2016/17 2017/18 2018/19 2019/20f
2019/2020 forecast for both fresh and processed oranges is for the time being set to be stable.
Imports (processed) Exports (processed) Imports (fresh) Exports (fresh)
*based on TAXUD surveillance
Source: DG Agriculture and Rural Development, based on Eurostat.
19Market developments in the EU
MILK AND DAIRY
PRODUCTS
2019 2020 MILK
Milk collection
2019
+0.4%
2020
+0.4%
DAIRY
Production +0.4% +0.4%
Exports +6.8% -6.3% Dairy herd -1.2% -0.7%
PRODUCTS
Imports +3.8% -8.0%
Consumption +0.0% -0.3% Note: % compared to previous year
Increased milk solids availability sustained processing capacities in 2019
Change in milk protein and fat availability In 2019, EU milk collection grew by 0.4% (lowest growth
relative to change in milk collection rate since 2012). The drop in FR (-0.2%) and DE (-0.1%)
2019/2018 was compensated by a hike in IE (+5%) and PL (+2%).
9% The milk yield grew by 1.8% while the dairy herd shrank
by 1.2%. The herd reduction was mainly due to DE, FR, PL
7% and IT (decline of 2-3%), while IE expanded by close to
4%. In NL, it expanded by 2%, reverting the trend of the
5% last two years following obligations to reduce phosphate
emissions.
3%
Despite a modest milk collection growth, increased milk
fat and protein availability provided enough constituents
1%
to sustain processing capacities, even in Member States
© SilviaJansen iStock
where milk deliveries declined.
-1%
IE BE ES PL DK DE FR IT NL EU EU milk fat availability grew by 1.6% and milk protein by
Protein availability Fat availability Deliveries 1.2%.
Source: DG Agriculture and Rural Development based on Eurostat. 20Milk and dairy prices
Chinese demand drop for milk powders weakened prices EU milk price equivalent expected to decline
EU weekly dairy prices (EUR/t) EU and Oceania monthly milk price (EUR ct/kg)
7 000 60
6 000 50
5 000
40
4 000
30
3 000
20
2 000
1 000 10
0 0
butter SMP WMP Cheese EU raw milk EU price eq. Oceania price eq.
Note: The milk price equivalent is based on butter and SMP prices.
Source: DG Agriculture and Rural Development, based on Eurostat and Member States notifications.
Source: DG Agriculture and Rural Development, based on Eurostat.
The spread of Covid-19 in China weakened milk powders’ prices. Demand Since February, the EU SMP price dropped by 17% to EUR 2 180/t. The EU
dropped following foodservice closure and the postponement of Chinese New WMP price declined at a lower pace to EUR 2 850/t (-6% since the beginning
Year celebrations. of 2020), as did the EU butter price to EUR 3 420/t (-7%). Meanwhile, the EU
Although there are already signals of a Chinese demand recovery, the cheese price remained relatively stable (EUR 3 080/t).
pressure on dairy prices is expected to remain as stocks of milk powders As a result of declining SMP and butter prices, the EU milk price equivalent is
remain high. In 2019, China increased both SMP (+23%) and WMP (+29%) expected to decline in the coming months. The seasonal rise in milk collection
imports significantly. Due to lockdown restrictions, milk collected in China was and confinement restrictions due to Covid-19 could also
processed into WMP more than usual, leading to an increase in overall weigh on milk prices over a longer period.
product availability. 21Milk and Dairy products
EU milk production expected to grow modestly in 2020
EU milk yield (kg/cow) and number of dairy cows (million The spring flush of EU milk collection (Q2) coincides with the outbreak of Covid-19. Restrictive
heads)
measures in Member States could challenge milk collection logistics as well as feed deliveries. In
8 000 23
some cases, dairies are encouraging milk producers to reduce milk deliveries.
Number of cows
6 000 22 Health-related reasons could also affect labour force availability, particularly in processing. This,
together with availability of milk supply in spring and restricted demand, could affect the dairy
Yield
4 000 21
product mix, favouring less labour-intensive products.
2 000 20 Under these conditions and assuming normal weather conditions, EU milk production growth could
0 19
be expected around 0.4% in 2020, driven by a modest yield increase (+1.1%), compensating a
further reduction of the dairy herd (-0.7%).
To address potential compound feed shortages, domestically produced feed could be favoured over
Milk yield Number of dairy cows purchased feed concentrates, contributing to the slowdown in annual yield growth.
Source: DG Agriculture and Rural Development, based on Eurostat. More milk channelled to SMP production in 2020
SMP balance sheet (1 000 t) WMP balance sheet (1 000 t) A possible decline of foodservice demand for dairy products could direct more milk into the
1 600 800
processing of storable and less labour-intensive dairy products, notably SMP. Its production could
1 400 700
1 200 600 grow by 2.5% in 2020. With public stocks emptied in 2019, availability in 2020 would decrease by
1 000 500 10%. Due to the price difference between stocked and fresh SMP, less SMP is expected to be used
800 400 in processing in 2020, resulting in a reduced domestic use (-8%), similar to levels prior to 2018.
600 300
200
Reduced availability and restrictive trade measures due to Covid-19 could bring SMP exports close
400
200 100 to 2017 levels. They could decline by 17% compared to the record high exports of 2019 (mainly to
0 0 China, Algeria and Southeast Asia). Since not all fresh SMP would be used, private stocks could
increase to 125 000 t in 2020.
In 2020, weakened world demand for WMP due to Covid-19 and an oil price drop could further
Exports Domestic use
Production Stocks
Exports Domestic use Production reduce EU exports, in particular to the Middle East. They are expected to fall by 7%. A continuous
increase in domestic use (+2%) is not expected to compensate for this
Source: DG Agriculture and Rural Development, based Eurostat. loss, therefore EU WMP production is expected to fall by 2%.
22Dairy products
Domestic use of butter to remain stable
EU butter exports by selected destination More butter is expected to be produced (+1.2%) as domestic demand remains strong (both in
2018 and 2019 (1 000 t)
retail and food industry). Despite the competitive EU price, US stocks built up in 2019 and
120
weakened demand in other markets, could contribute to a decline of EU exports (-10%) in 2020.
100
While retail sales of butter are likely to increase, domestic use could remain stable as butter use
80 in processed products would not return to previous levels.
60
As a result, the increased production is not likely to be fully absorbed, and stocks could increase
40
(+10 000 t).
20
0 Sustained demand for cheese and fresh dairy products
UK US Saudi UAE China Turkey Japan other
Arabia A majority of traditional dairy products (cheese, drinking milk, cream and yogurts) is either sold
2018 2019 via retail or processed by the industry. Increased home consumption due to confinement
Note: Including butter oil and not accounting for outward processing. measures has led to increased household stocks, mainly of UHT milk and cheese.
Source: DG Agriculture and Rural Development, based on Eurostat.
In 2020, EU cheese consumption could grow slightly (+0.3%), supported by increasing retail
Domestic use of selected dairy products by channels sales for different categories, as well as for ready meals with a cheese component. Exports
(2019e) could also continue increasing (+1.5%), mainly thanks to demand in Asian markets. This
100% increasing demand is expected to result in an overall cheese production increase (+0.6%),
80% supported by a stable price environment.
60%
However, as home dairy consumption differs in composition to foodservice, some categories of
cheese could be impacted negatively by the drop in demand (e.g. high-value cheeses).
40%
Domestic stockpiling of UHT milk, and an expected demand increase for yogurts, due to their
20% functional value in nutrition, could incentivise the slowdown of the declining trend in FDP
production in 2020 (-0.4% compared to -0.9% in 2019). In particular, drinking milk is expected
0%
Drinking milk Cream Cheese Butter to halve the decline of last year (-1%), whereas the negative trend in yogurt production could
Retail Foodservice Industrial use and other be reverted (+0.5%). World demand for EU FDP could remain at the historic
level of last year, assuming the recovery of Chinese foodservice
Source: DG Agriculture and Rural Development, based on Eurostat and Euromonitor International,
Packaged Food, 2019. for which there are already some signals. 23Market developments in the EU
MEAT BEEF 2019 2020 POULTRY 2019 2020
PRODUCTS
Production -0.9% -0.6% Production +1.6% +1.2%
Exports -3.0% +1.0% Exports +6.7% +1.0%
Imports +3.9% +0.0% Imports +1.8% -0.5%
Consumption -0.5% -0.7% Consumption +0.6% +1.1%
SHEEP &
PIGMEAT 2019 2020 2019 2020
GOAT
Production -0.6% +0.7% Production +5.5% +0.0%
Exports +17% +12% Exports +12% +2.0%
Consumption -3.7% -1.8% Imports -6.1% -1.0%
Consumption +2.2% -0.4%
•Note: % compared to previous year
©olgakr iStock
•Net production and meat trade
24Beef and veal
EU beef production down in 2020
Change in number of cows, main producing
EU Member States (1 000 heads) EU beef production declined in 2019 (-0.9%), in a context of lower prices and reflecting prior herd
80 reductions in key producing countries (FR, IT, NL), while the contraction in PL stemmed from
40 reduced exports. By contrast, DE increased its output, through additional culling of heifers not
0 needed for replacement, while IE’s slaughterings rose in anticipation of Brexit.
-40 In 2019, the total EU cow herd contracted further by 0.8%, with different developments for dairy
-80 and suckler cow herds. Higher milk yields contributed to the downsizing of dairy herds in key
-120 producing countries (FR, DE, IT, PL), while the expansion in ES, PL and IT (thanks to export
-160
opportunities) halted the reduction of the EU suckler cow herd.
FR DE IT ES IE PL NL BE AT EU beef production should decline further in 2020 in key producing countries, by 0.6% in the EU,
2018/2017 Suckler cows 2019/2018 Suckler cows as herds are smaller and the EU reference price is declining. Meanwhile, ES and IE should benefit
Dairy cows Dairy cows
from trade opportunities and increase their meat output. Covid-19 will affect markets for specific
Source: DG Agriculture and Rural Development, based on Eurostat. products, such as high-value cuts due to the closure of foodservice and butchery departments in
supermarkets.
Argentina, Uruguay, Brazil – beef exports
(million t product weight, share to China and EU)
12 47%
Lower meat availability and stable imports in 2020
other
10 US EU imports increased in 2019, due to more supply from Argentina. In 2020, imports should remain
8 29% stable, as other EU suppliers (of high-quality meat) are diverting their exports to Asia (China, Japan
Chile
and South Korea).
6 Hong Kong
Strikingly, southern American countries now ship nearly half of their exports to China, while the EU
4 EU
share dropped to 13%. Covid-19 may undermine their exports to the EU further, as foodservice
2 13% China demand for high-value cuts breaks and pulls EU prices down. Meanwhile, production and export
0 % to China disruptions in South America are not excluded.
2010
2011
2012
2013
2014
2015
2016
2017
2018
2019
% to EU Lower demand and lower meat availability will result in a
further reduction in EU apparent consumption (to 10.6 kg
Source: DG Agriculture and Rural Development, based on IHS Markit/GTA.
per capita).Beef and veal
Slight export recovery in 2020 Pressure on Prices
EU exports of bovine animals (1 000 t) EU exports of beef (1 000 t) EU imports of beef (1 000 t)
600 UK 600 UK 600
UK
500 other 500 other 500
other
400 Russia 400 Switzerland 400 Namibia
300 Libya 300 Hong Kong 300 Australia
200 Israel 200 Philippines 200 US
Turkey Bosnia and
100 100 100 Uruguay
Herzegovina
Lebanon Israel
0 0 0 Argentina
2017
2018
2019
2020
2017
2018
2019
2020
2017
2018
2019
2020
Algeria Brazil
f
f
f
Source: DG Agriculture and Rural Development, based on Eurostat.
EU exports of live animals declined in 2019, driven by lower demand from Turkey. The EU, led by FR, Covid-19 affects the beef meat market
diverted significant volumes to Algeria, which favours live imports to imports of meat. A further decrease through prices. So far, specific products for
is expected in 2020, with lower demand from Turkey, price competition from Brazil and Uruguay, and foodservice (e.g. burgers for fast food and
suppressed demand from Algeria and Libya (impact of low oil prices). high-value cuts for restaurants) are partly
EU beef exports declined by 3% in 2019, solely because exports to the UK fell by 10%. In 2020, exports redirected to retail, but at lower prices.
could slightly recover depending mainly on expanding opportunities in Asia (Japan, Hong Kong, China and Beef prices, already lower at the beginning
the Philippines). of 2020, are under increased pressure this
Covid-19 has not yet affected EU exports, including live animals. However, possible transport disruptions year, including for cows
(i.e. a shortage of truck drivers) are a risk factor.Poultry
EU poultry production to continue rising in 2020
Poultry meat imports by destination EU poultry meat production continued its growing trend in 2019 thanks to increasing demand,
1 000
(1 000 t carcass weight) albeit at a moderate pace (+1.6%). In 2020, growth should continue (+1.2%) as consumers
replace more expensive meats with poultry. However, the closing of foodservice should impact
800
varieties more difficult to sell in retail (ducks, guinea fowls, pigeons and quails).
600 In 2019, broiler prices stayed close to the 5-year average. Since the beginning of 2020 prices
have been above last year’s level due to tight supply, and were pushed further up by Covid-19
400
related stockpiling mid-March. However, they fell quickly after that below the 5-year average
200 mainly due to a steep drop of PL prices.
0
Per capita consumption is expected to continue on its rising trend in 2020, up to 23.6 kg (+0.2 kg).
2015 2016 2017 2018 2019 2020f
UK Brazil Thailand Ukraine China Chile other EU poultry imports could be affected by foodservice closures
Source: DG Agriculture and Rural Development, based on Eurostat.
EU poultry meat imports grew moderately by 1.8% in 2019 (+2.9% to UK, +1.3% to other
Poultry meat exports by destination countries). Imports from the UK are mostly low value cuts and legs. By contrast, imports from
(1 000 t carcass weight) other countries are mostly breasts and processed products of higher value largely addressed to
3 000
foodservice, thus likely affected by Covid-19. As a result, imports will probably fall slightly in
2 500 2020.
2 000 In 2019, EU poultry meat exports grew by 6.7% thanks to strong world demand (+2.3% to UK,
1 500 +9% to other countries). Shipments increased to most of the main destinations, particularly to
1 000 South Africa (+62%), the Philippines (+40%), Vietnam (+34%) and China (quadrupled). In 2020,
500
exports should keep growing while demand remains high, but at a moderate pace as bird flu
outbreaks in a few of the main EU producers (e.g. PL) have resulted into country bans by some
0
2015 2016 2017 2018 2019 2020f
trade partners, including the four above. This will put pressure on EU exports, and will probably
UK Philippines Ghana South Africa Ukraine
result in a switch of trade flows, except probably to China where PL is the only EU country
Saudi Arabia Benin Hong Kong other exporting significant volumes at the moment.
Source: DG Agriculture and Rural Development, based on Eurostat.
27Pigmeat
Small EU production growth expected in 2020, despite high prices
Change in number of breeding sows, main producing EU The EU breeding herd contracted by 3% in 2018 due to low prices, African Swine Fever (ASF) risk
Member States (1 000 heads) and/or environmental restrictions. High prices from April 2019 have contained the trend and
stabilised the size of the EU herd in 2019 (+0.4 % year-on-year), thanks to expansion in ES (+3%)
75
and NL (+8%), and despite reductions in DE (-3%), FR (-3%) and HU (-11%).
25
In 2020, EU pigmeat production should grow slightly as continuing export demand from Asia,
-25 particularly China, keeps prices high and favours higher slaughter weights. Growth will be driven
-75 by ES that is taking advantage of the opportunity in China. ES pork exports to China doubled in
2019, and now represent 28% of total EU exports to China. In 2020, ES will become the first EU
-125
producer in number of slaughtered animals, although not in volume due to a lighter slaughter
-175 weight than DE. Covid-19 should not significantly affect the pigmeat market except for some
DE FR HU BE PT IT DK AT RO PL ES NL
specific products for foodservice (e.g. suckling pigs for roasting in ES, PT).
2017/2016 2018/2017 2019/2018
Source: DG Agriculture and Rural Development, based on Eurostat. EU prices should remain high in 2020, thanks to strong world demand
EU pigmeat prices, class E (EUR/100kg) The surge of Chinese imports in 2019 drove EU pigmeat prices to close to EUR 200/100kg in
210
December (+45% year-on-year). Since then prices have fluctuated above EUR 180/100kg.
200
Carcass prices reacted slightly to Covid-19 but should continue at high levels while Chinese
190
demand continues, despite the reduction in foodservice demand. The main risk remains the
180
spread of ASF in the EU.
170
160
Piglet prices also surged in 2019, only declining in March 2020 following the carcass price, after
150
reaching EUR 75/head (+59% year-on-year).
140 ASF is still contained in the EU, but continues to spread slowly. In February 2020, EL confirmed
130 its first outbreak. Currently ten Member States are affected by the disease: EL, BG, EE, HU,
120 IT (Sardinia), LV, LT, PL, RO and SK.
JAN FEB MAR APR MAY JUN JUL AUG SEP OCT NOV DEC
Apparent consumption per capita is expected to fall to 32.5 kg in 2020
2017 2018 2019 2020 average 2015-2019
(0.7 kg less than the previous year) as high prices favour other meats,
Source: DG Agriculture and Rural Development. particularly poultry. 28Pigmeat
Further growth of EU pigmeat exports expected in 2020 Surge of Chinese pigmeat demand to continue in 2020
EU pigmeat exports by destination (1 000 t carcass weight) Chinese pork imports from main partners (1 000 t product weight)
5 000 1 600
4 500 1 400
4 000 1 200
3 500 1 000
3 000 800
2 500 600
2 000 400
1 500 200
1 000 0
500
0
2015 2016 2017 2018 2019 2020
Pigmeat Offal
UK China Hong Kong Japan South Korea
Philippines US Australia Ukraine other 2016 2017 2018 2019
Source: DG Agriculture and Rural Development, based on Eurostat. Source: DG Agriculture and Rural Development, based on IHS Markit/GTA (export declarations) and Eurostat for EU figures.
EU pigmeat exports grew by 17% in 2019 (-5% to UK, +25% to other countries), China continues to struggle to recover from ASF that has decimated its pig herd,
driven by Chinese demand, where the share of EU pigmeat exports doubled to and recovery will probably be delayed by Covid-19 related disruptions. In 2020,
36%. Meanwhile, exports to other main trade partners fell significantly: South Chinese production should fall further (experts estimate a 15-25% drop year-on-
Korea ( 22%), the Philippines (-24%), the US (-24%) and Ukraine (-18%); while year), maintaining a huge gap that cannot be covered by available world supply.
small increases were registered to Japan, Australia and Hong Kong. In 2019, the The EU has clearly benefited the most from Chinese demand, but the US has
UK is the main export destination of EU pigmeat after China (22% share). tripled its exports despite the tariffs in place. Brazil continues to increase its
In 2020, Chinese demand should persist and total EU exports are expected to share, while Canada could not due to the suspension of
grow significantly (+12%). its access for most of the 2nd half of 2019.
In 2019, EU offal exports grew as well, but less significantly (+7%). 29Sheep and goat meat
Sheep and goat meat production to remain stable in 2020
Change in number of sheep and goats, main producing
EU Member States (1 000 heads) The EU sheep and goat flocks contracted in 2019 (-1.3%), driven by reductions in key producing
200 countries (ES, EL). In addition, the previous substantial increase in RO and FR eased.
100
EU sheep and goat meat production should remain stable in 2020, after strong growth in 2019
0
(+6%), due to smaller flocks and a slowdown in production growth in RO. Improved export
-100
prospects and if prices remain high should prevent a decrease in EU production.
-200
-300 Covid-19 will impact the sheep and goat meat markets. Surplus from foodservice in some
-400 countries (ES, EL) will not be absorbed by retail. Also, seasonal demand for Easter and Ramadan
-500 will not materialise, and animals ready for slaughter may be frozen and directed to retail and
ES EL RO FR IE DE IT PT NL BG AT foodservice in the second half of the year. Covid-19 is due to affect the market through
2018/2017 Ewes put to the ram 2019/2018 Ewes put to the ram downward pressure on prices.
Goats mated Goats mated
Source: DG Agriculture and Rural Development, based on Eurostat. Meat exports slightly up, imports slightly down in 2020
EU sheepmeat trade, by main partner (1 000 t)
EU live exports were firmly up in 2019, supported by the demand from emerging destinations
Exports of live animals Exports of meat Imports of meat
240 (Saudi Arabia and Iran). In 2020, live exports should decline notably, as the negative tendency
200
other continues in Libya, Jordan and Israel. Covid-19 may limit the transport and exports of live
Iran
animals, in particular to Iran.
160 Saudi Arabia
Jordan, Israel, Lebanon EU sheepmeat exports rose in 2019 (+12%). In 2020, ES and IE shall benefit from continued
120 Libya export to the Middle East and Hong Kong, and perhaps to the UK.
80
EU sheepmeat imports declined in 2019 (-6.1%), as New Zealand (that accounts for 40%)
40 diverted its exports to Asia. Unless the UK maintains similar exports to the EU as last year, EU
0 imports should decline in 2020.
2018
2019
2020f
2018
2019
2020f
2018
2019
2020f
Note: Middle East includes Jordan, Oman, Kuwait, Qatar, UAE, Iran, Bahrain, S. Arabia, Israel, Turkey.
Source: DG Agriculture and Rural Development, based on Eurostat.You can also read