Socio-protective effects of active case finding on catastrophic costs from tuberculosis in Ho Chi Minh City, Viet Nam: a longitudinal patient cost ...
←
→
Page content transcription
If your browser does not render page correctly, please read the page content below
Vo et al. BMC Health Services Research   (2021) 21:1051
https://doi.org/10.1186/s12913-021-06984-2

 RESEARCH                                                                                                                                           Open Access

Socio-protective effects of active case
finding on catastrophic costs from
tuberculosis in Ho Chi Minh City, Viet Nam:
a longitudinal patient cost survey
Luan Nguyen Quang Vo1,2*, Rachel Jeanette Forse1,3, Andrew James Codlin1, Ha Minh Dang4, Vinh Van Truong4,
Lan Huu Nguyen4, Hoa Binh Nguyen5, Nhung Viet Nguyen5, Kristi Sidney-Annerstedt3, Knut Lonnroth3,
S Bertel Squire6, Maxine Caws6,7, Eve Worrall6 and Noemia Teixeira de Siqueira-Filha8

  Abstract
  Background: Many tuberculosis (TB) patients incur catastrophic costs. Active case finding (ACF) may have socio-
  protective properties that could contribute to the WHO End TB Strategy target of zero TB-affected families suffering
  catastrophic costs, but available evidence remains limited. This study measured catastrophic cost incurrence and
  socioeconomic impact of an episode of TB and compared those socioeconomic burdens in patients detected by
  ACF versus passive case finding (PCF).
  Methods: This cross-sectional study fielded a longitudinal adaptation of the WHO TB patient cost survey alongside
  an ACF intervention from March 2018 to March 2019. The study was conducted in six intervention (ACF) districts
  and six comparison (PCF) districts of Ho Chi Minh City, Viet Nam. Fifty-two TB patients detected through ACF and
  46 TB patients in the PCF cohort were surveyed within two weeks of treatment initiation, at the end of the
  intensive phase of treatment, and after treatment concluded. The survey measured income, direct and indirect
  costs, and socioeconomic impact based on which we calculated catastrophic cost as the primary outcome. Local
  currency was converted into US$ using the average exchange rates reported by OANDA for the study period
  (VNĐ1 = US$0.0000436, 2018–2019). We fitted logistic regressions for comparisons between the ACF and PCF
  cohorts as the primary exposures and used generalized estimating equations to adjust for autocorrelation.
  Results: ACF patients were poorer than PCF patients (multidimensional poverty ratio: 16 % vs. 7 %; p = 0.033), but
  incurred lower median pre-treatment costs (US$18 vs. US$80; p < 0.001) and lower median total costs (US$279 vs.
  US$894; p < 0.001). Fewer ACF patients incurred catastrophic costs (15 % vs. 30 %) and had lower odds of
  catastrophic cost (aOR = 0.17; 95 % CI: [0.05, 0.67]; p = 0.011), especially during the intensive phase (OR = 0.32; 95 %
  CI: [0.12, 0.90]; p = 0.030). ACF patient experienced less social exclusion (OR = 0.41; 95 % CI: [0.18, 0.91]; p = 0.030),
  but more often resorted to financial coping mechanisms (OR = 5.12; 95 % CI: [1.73, 15.14]; p = 0.003).

* Correspondence: luan.vo@tbhelp.org
1
 Friends for International TB Relief, 1/21 Le Van Luong, Nhan Chinh, Thanh
Xuan, Ha Noi, Vietnam
2
 IRD VN, Ho Chi Minh City, Vietnam
Full list of author information is available at the end of the article

                                        © The Author(s). 2021 Open Access This article is licensed under a Creative Commons Attribution 4.0 International License,
                                        which permits use, sharing, adaptation, distribution and reproduction in any medium or format, as long as you give
                                        appropriate credit to the original author(s) and the source, provide a link to the Creative Commons licence, and indicate if
                                        changes were made. The images or other third party material in this article are included in the article's Creative Commons
                                        licence, unless indicated otherwise in a credit line to the material. If material is not included in the article's Creative Commons
                                        licence and your intended use is not permitted by statutory regulation or exceeds the permitted use, you will need to obtain
                                        permission directly from the copyright holder. To view a copy of this licence, visit http://creativecommons.org/licenses/by/4.0/.
                                        The Creative Commons Public Domain Dedication waiver (http://creativecommons.org/publicdomain/zero/1.0/) applies to the
                                        data made available in this article, unless otherwise stated in a credit line to the data.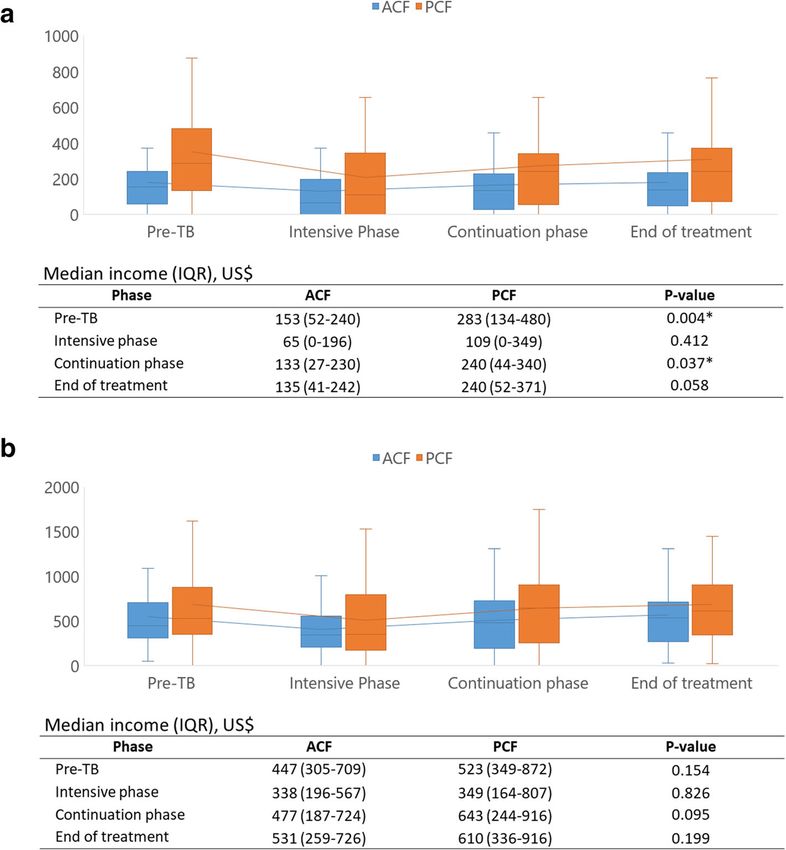
Vo et al. BMC Health Services Research   (2021) 21:1051                                                       Page 2 of 11

 Conclusions: ACF can be effective in reaching vulnerable populations and mitigating the socioeconomic burden of
 TB, and can contribute to achieving the WHO End TB Strategy goals. Nevertheless, as TB remains a catastrophic life
 event, social protection efforts must extend beyond ACF.
 Keywords: Tuberculosis, Catastrophic costs, Active case finding, Social protection, Patient cost survey, Longitudinal
 design, Viet Nam

Background                                                    Methods
Tuberculosis (TB) disproportionally affects the poorest       Study design
segments of society [1]. Economically and socially vul-       This cross-sectional study fielded a longitudinal cost
nerable persons are at higher risk of TB infection and        survey from March 2018 to March 2019 alongside an
progression to active TB disease [2–4]. Previous research     intervention. The intervention consisted of ACF
has also shown that TB exacerbates poverty [5–7]. Thus,       among household and close contacts, and persons liv-
one of the three targets included in the WHO End TB           ing in presumptive hotspots, boarding homes and
Strategy is the elimination of catastrophic costs, defined    urban slums implemented by community health
as incurring expenses in excess of 20 % of annual house-      workers (CHW). All household contacts and other
hold income, due to TB [8].                                   targeted persons with symptoms suggestive of TB
   Despite recent rapid economic development, Viet            were referred for chest x-ray screening and sputum
Nam remains a high TB burden country. There were              testing by rapid molecular assay or smear microscopy.
170,000 incident cases and 11,400 TB-related mortalities      The CHWs supported patients to initiate and adhere
in 2019 [9]. Viet Nam conducted its first national TB pa-     to treatment. Patients in the PCF districts received
tient cost survey in 2016 [10]. This cross-sectional sur-     routine care as per national treatment guidelines. The
vey sampled 677 drug-susceptible (DS-TB) and 58               intervention is described in detail elsewhere [20, 21].
multi-drug resistant TB (MDR-TB) patients. The pro-
portion of DS-TB patients who experienced catastrophic        Study setting
costs was 63 %, while the catastrophic costs prevalence       The study took place in 12 districts of Ho Chi Minh City
among MDR-TB patients was 98 % [11]. Following the            (HCMC), Viet Nam (Fig. 1). Six districts implemented a
national survey, the National TB Control Program              community-based ACF intervention. The remaining six
(NTP) explored and developed various social protection        districts served as control areas where people with TB
mechanisms for TB patients. Most notable is the estab-        were passively detected through routine program activ-
lishment of a national patient support fund named the         ities (PCF). In 2017, the intervention area had a popula-
Patient Support Foundation to End Tuberculosis to pay         tion of 2,814,034 and notified 4,159 TB patients, while
for Social Health Insurance (SHI) enrollment and              the control area had a population of 1,789,396 and noti-
unreimbursed medical costs.                                   fied 2,859 TB patients [22]. This represented a case noti-
   With a treatment coverage rate of 60 %, there remains      fication rate (CNR) of 148 per 100,000 and 160 per
a pool of undetected TB and sustained transmission in         100,000, respectively.
the community [9]. Active case finding (ACF) is a strat-
egy to find people with TB earlier in their disease course
and in larger numbers, particularly among vulnerable          Participant recruitment and sample size
populations [12]. If implemented consistently, ACF has        The study employed a consecutive sampling approach in
the potential to reduce TB transmission and improve           both cohorts. Patients entered into TB treatment regis-
health outcomes over time [13]. Based on these epidemi-       ters were referred by District TB Unit staff for recruit-
ologic benefits, the NTP has placed a strong emphasis         ment to participate on the study. We included
on ACF in the recent past [14–17]. However, to date the       pulmonary DS-TB patients 18 years and older who re-
evidence on the socio-protective nature of ACF remains        sided in the study area. We excluded persons treated in
limited [18, 19] with none available for the Vietnamese       the private sector or declined to participate.
context.                                                        We estimated a sample size of 100 patients equally
   This study aimed to assess the socioeconomic im-           distributed between ACF and PCF cohorts. The sample
pact and socio-protective potential of ACF by                 size was based on a 63 % catastrophic cost incurrence
obtaining a longitudinal measure of the financial             rate among DS-TB patients [11]. We estimated an 80 %
burden of DS-TB treatment and comparing costs in              power to show a 50 % reduction in catastrophic costs
patients detected through active versus passive case          from ACF [12] at 95 % confidence, and with 25 % con-
finding.                                                      tingency for loss to follow-up.
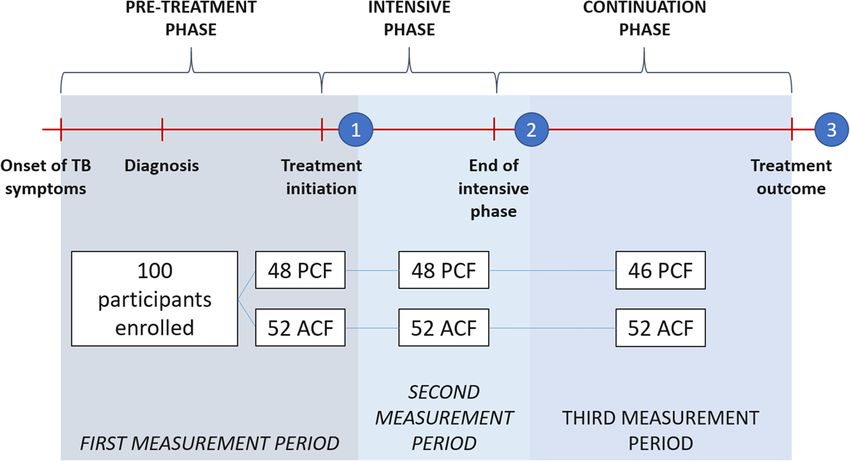
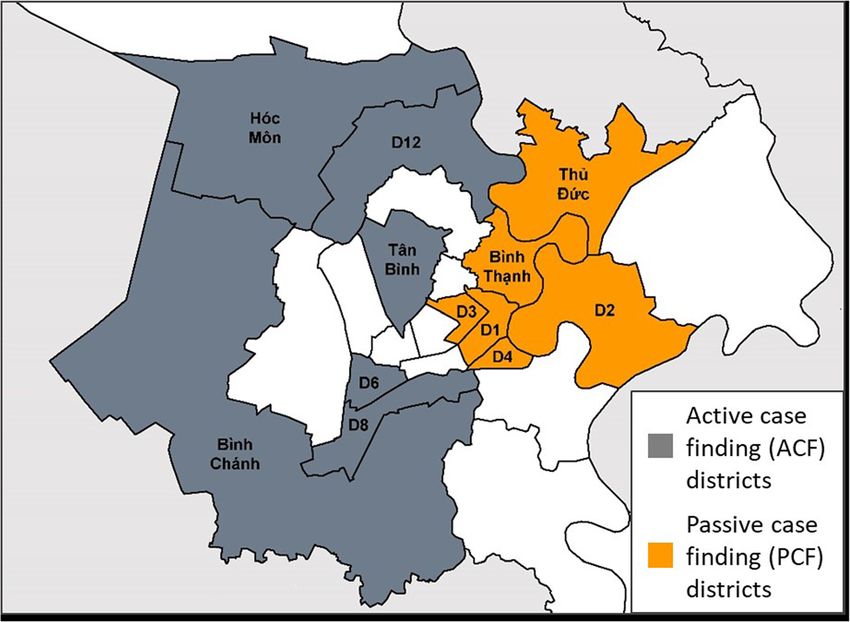
Vo et al. BMC Health Services Research     (2021) 21:1051                                                               Page 3 of 11

 Fig. 1 Location of sampling districts in Ho Chi Minh City, Viet Nam

Data collection                                                        Viet Nam Dong (VNĐ) and converted to US dollars
We developed a longitudinal adaptation of the WHO                      (US$) using the average 2018–2019 exchange rates re-
survey instrument used in Viet Nam’s national patient                  ported by OANDA for the study period (VNĐ1 =
cost survey to measure patient cost and socioeconomic                  US$0.0000436) [24].
impact throughout TB treatment and limit recall bias
(supplementary material) [23]. We expanded the survey’s                Data analysis
asset list with items relevant in the contemporary urban               Participant characteristics and health-seeking behaviors
Vietnamese context. The questionnaire assessed partici-                 We presented participant demographic, clinical and so-
pant characteristics, financial and economic costs, and                cioeconomic characteristics. We employed an adapted
socioeconomic impact associated with TB. The latter in-                multidimensional poverty index for TB (MPI-TB) using
cluded changes in employment status, food insecurity,                  the Alkire-Foster method to profile a participant’s socio-
productivity loss, social exclusion and use of coping                  economic status [25–27]. The MPI-TB construct was
strategies. Clinical data such as TB diagnosis and treat-              designed as an absolute measure with thresholds mirror-
ment information were extracted from patient registers.                ing those of Viet Nam’s national MPI, and is further de-
  In Viet Nam, new and relapse DS-TB patients typically                tailed in the supplementary material. Health-seeking
take treatment for six months. The intensive phase lasts               behavior was summarized by frequency and type of
two months and the continuation phase lasts four                       healthcare provider visited.
months. Costs and social impact were measured thrice
in both ACF and PCF cohorts to cover the pre-                          Patient income and costs
treatment, intensive and continuation phases. The first                For each treatment period, we collected monthly per-
interview took place after at least two weeks of treat-                sonal and household income and estimated direct med-
ment and covered the period from the onset of symp-                    ical, direct non-medical and indirect costs incurred.
toms to the time of the interview. The second and third                Direct medical costs included medications, diagnostic
interviews occurred after completion of the intensive                  tests, consultations and hospitalization fees. Direct non-
and continuation phases, respectively (Fig. 2).                        medical costs included spend on transportation and
  Interviewers captured responses through audio record-                food. Indirect cost consisted of income loss, which was
ings and on paper. Data were digitized using web-forms                 self-reported by the patient. For those patients who
on the ONA platform (ONA Systems, Nairobi, Kenya);                     could not provide this information, we calculated in-
digital data were checked against the paper surveys to                 come loss by using the self-reported number of working
ensure data entry accuracy. All costs were collected in                hours/days lost multiplied by the hourly (US$0.90) or
Vo et al. BMC Health Services Research     (2021) 21:1051                                                     Page 4 of 11

 Fig. 2 Survey timeline and participant retention

daily (US$7.00) minimum wage for Region 1 in Viet             socioeconomic patient characteristics. Differences in so-
Nam [28]. Indirect costs, time lost traveling to health fa-   cioeconomic impact and catastrophic costs in individual
cilities and waiting for an appointment were calculated       treatment periods were analyzed by fitting univariate
by multiplying the number of hours lost by the hourly         population-averaged logistic regression models using
minimum wage. Total indirect cost was calculated by           generalized estimation equation methods with working
summing the monetary value of the time and income             correlation structures based on Quasi-likelihood Infor-
lost. We excluded caregiver time-loss for consistency         mation Criteria. Hypothesis tests were two-sided. P-
with the national TB patient cost survey [11] and pa-         values below 0.05 were considered statistically signifi-
tients lost to follow-up after the first interview.           cant. Data analysis was performed in Stata v15 (Stata-
                                                              Corp, College Station, TX, USA).
Socioeconomic impact
We reported the frequency of financial coping mecha-          Ethical considerations
nisms used, loss of employment, reduction in work             Approvals were granted by the Liverpool School of Trop-
hours, lower wage levels or the transfer to a lower pay-      ical Medicine Research Ethics Committee (17–019) and
ing position or job. We estimated ratios of catastrophic      Pham Ngoc Thach Provincial TB Hospital Institutional
costs and poverty headcount. To estimate catastrophic         Review Board (430/HDDD-PNT). The implementation of
cost, we applied the WHO definition [10] of total costs       the interventions was approved by the HCMC People’s
exceeding 20 % of the average annual household income         Committee (214/QD-UBND, 2138/QD-UBND, 2878/QD-
before this episode of TB. We applied the poverty head-       UBND). The NTP approved use of programmatic treat-
count defined by the World Bank as US$1.90 per day            ment data. All protocols were carried out in accordance
with an annual purchasing power parity conversion fac-        with relevant guidelines and regulations. Before the inter-
tor for Gross Domestic Product at 2017 prices as defined      view, we provided a written participant information sheet,
by the World Bank [29, 30].                                   a verbal explanations of the study and an opportunity to
                                                              ask questions to ensure all participants were aware of the
Statistical approach                                          study. All participants provided informed written consent.
Chi-square and Fisher’s exact tests were used to deter-       All data were anonymized prior to analysis.
mine statistical differences in proportions of categorical
variables. Wilcoxon rank-sum tests were used to com-          Results
pare median costs between the ACF and PCF cohorts.            Participant characteristics
We excluded missing data and reported denominators            One-hundred invited individuals agreed to participate in
that deviated from the total sample size. Univariate and      the survey, but two did not complete the final interview.
multivariate logistic models were fitted to measure the       Thus, the final study sample consisted of 98 participants,
association between catastrophic costs incurrence and         46 PCF and 52 ACF, for a total of 294 survey encoun-
ACF/PCF cohort alongside other demographic and                ters. Most patients were male (62/98 = 63 %) (Table 1).
Vo et al. BMC Health Services Research (2021) 21:1051 Page 5 of 11
Table 1 Baseline socioeconomic and treatment characteristics of TB patients in the ACF and PCF cohorts
ACF PCF All P-valueg
(N = 52) (N = 46) (N = 98)
Socioeconomic characteristics
Male, N (%) 33 (63) 29 (63) 62 (63) 0.966
Age, mean (SD), years 51.8 (15.7) 44.8 (17.9) 48.5 (17.0) 0.063
Complete secondary school, N (%) 28 (54) 36 (78) 64 (65) 0.011*
Employed before the episode of TB, N (%) 39 (75) 33 (72) 72 (73) 0.715
a
Patient income pre-TB, N (%)
Poorest 22 (43) 10 (22) 32 (33) 0.003*
Moderate 18 (35) 14 (31) 32 (33) 0.714
Wealthiest 13 (25) 19 (42) 32 (33) 0.072
a
Household income pre-TB, N (%)
Poorest 21 (40) 12 (27) 33 (34) 0.155
Moderate 18 (35) 14 (31) 32 (33) 0.714
Wealthiest 13 (25) 19 (42) 32 (33) 0.072
Social Health Insurance, N (%) 36 (69) 42 (91) 78 (80) 0.007*
Adjusted MPI-TB headcount ratio, mean (SD)b 15.5 (21.8) 7.1 (15.9) 11.6 (19.6) 0.033*
TB diagnosis and treatment
TB/HIV co-infection, N (%) 0 (0) 3 (7) 3 (3) 0.061
New TB case, N (%) 35 (67) 44 (96) 79 (81) < 0.001*
Bacteriologically confirmed, N (%) 52 (100) 43 (93) 95 (97) 0.061
c
Time between onset of TB symptoms and treatment initiation , mean (SD), weeks 9.1 (8.9) 12.7 (18.2) 11.0 (14.5) 0.245
Hospitalization pre-treatment, N (%) 3 (6) 10 (22) 13 (13) 0.020*
Hospitalization during treatment, N (%) 3 (6) 6 (13) 9 (9) 0.213
Number of follow-up visits during treatment, mean (SD) 3.3 (1.0) 3.5 (1.0) 3.4 (1.0) 0.402
Type of service visited, pre-treatment, N (%)d
Private sector 31/262 (12) 79/366 (22) 110/628 (18) 0.002*
Non-NTP public sector 34/262 (13) 140/366 (38) 174/628 (28) < 0.001*
NTPe 110/262 (42) 63/366 (17) 173/628 (28) < 0.001*
f
Others 87/262 (33) 84/366 (23) 171/628 (27) < 0.004*
Type of service visited, treatment, N (%)d
Private sector 8/234 (3) 25/273 (9) 33/507 (7) 0.009*
Non-NTP public sector 75/234 (32) 57/273 (21) 132/507 (26) 0.004*
e
NTP 2/234 (1) 40/273 (15) 42/507 (8) < 0.001*
Othersf 149/234 (64) 151/273 (55) 300/507 (59) 0.056
a
Based on within-sample tertiles of self-reported incomes;
b
Headcount ratio calculated based on a deprivation threshold of 33 % (> 5 deprivations) as adapted from official guidelines on multi-dimensional poverty defined
by the Government of Viet Nam with further detail provided in the supplementary material;
c
Contains nine missing values in the ACF cohort with N = 43;
d
Total number of visits during the pre-treatment (ACF = 262, PCF = 366, Total = 628) and treatment periods (ACF = 234, PCF = 273, Total = 507);
e
NTP National TB Control program;
f
Traditional healers, herbalists, pharmacists and mobile X-ray events (pre-treatment, only);
g
Chi-square, Fischer Exact (any cell with n < 5 in the contingency table) for proportions, Wilcoxon Rank Sum for medians, t-test for means
* Statistically significant difference at 95 % confidence level
ACF patients tended to be slightly older than PCF pa- of people enrolled onto SHI in the ACF cohort was sig-
tients (52 vs. 45; p = 0.063). The ACF cohort had fewer nificantly lower than in the PCF cohort (69 % vs. 91 %;
individuals with a secondary school degree (54 % vs. p = 0.007). The depth-adjusted MPI-TB ratio among
78 %; p = 0.011) and more individuals whose income fell ACF patients was significantly higher than among PCF
in the poorest tertile (43 % vs. 22 %; p = 0.003). The share patients (15.5 % vs. 7.1 %; p = 0.033).Vo et al. BMC Health Services Research (2021) 21:1051 Page 6 of 11
Fig. 3 Variation in income by treatment period and study cohort. a) Personal income. b) Household income
Health-seeking behaviors phase the median personal income declined sharply
There were fewer new TB patients in the ACF cohort from US$153 to US$65 in the ACF cohort and from
(67 % vs. 96 %; p < 0.001) and fewer pre-treatment US$283 to US$109 in the PCF cohort, but recovered to
hospitalizations (6 % vs. 22 %; p = 0.003) than among pre-TB levels by the end of treatment. Median house-
PCF patients. ACF patients reported fewer visits to hold income was lower in the ACF cohort than in the
health facilities before initiating treatment (262 vs. PCF cohort in all periods, but these differences were not
366) with a significantly higher share of ACF patients significant. The household income changes followed the
accessing NTP services compared PCF patients (42 % same pattern as observed on personal income, declining
vs. 17 %; p < 0.001). Conversely, the rate of health- during the intensive phase and recovering by the end of
seeking in non-NTP public healthcare facilities (13 % the treatment (Fig. 3b).
vs. 38 %; p < 0.001) and private healthcare providers Table 2 shows the mean and median costs incurred
(12 % vs. 22 %; p = 0.002) was significantly lower in during the pre-treatment and treatment periods as well
ACF patients. as the total costs and income losses incurred due to the
episode of TB. The median total costs incurred by ACF
Patient income and costs patients during the pre-treatment period was signifi-
Prior to TB treatment, the monthly median personal in- cantly lower compared to PCF patients (US$18 vs.
come was significantly lower in the ACF cohort com- US$80; p < 0.001). Specifically, patients in the ACF co-
pared to the PCF cohort in the pre-treatment (US$153 hort incurred significantly lower direct medical costs
vs. US$283; p = 0.004) and continuation phase (US$133 compared to the PCF cohort (US$13 vs. US$75;, p <
vs. US$240; p = 0.037) (Fig. 3a). During the intensive 0.001). Once TB treatment began, there was noVo et al. BMC Health Services Research (2021) 21:1051 Page 7 of 11
Table 2 Mean and median direct and indirect costs during pre-treatment and treatment periods for TB patients in the ACF and PCF
cohorts (VNĐ1 = US$0.0000436, 2018-2019)
Cost item ACF (N = 52) PCF (N = 46) All (N = 98) P-valuea
Mean (95% CI) Median (IQR) Mean (95% CI) Median (IQR) Mean (95% CI) Median (IQR)
Pre-treatment
Direct medical 37 (18-56) 13 (4-31) 151 (70-231) 75 (30-168) 90 (50-130) 29 (11-81)Vo et al. BMC Health Services Research (2021) 21:1051 Page 8 of 11
Table 3 Association between catastrophic costs and baseline characteristics for the entire episode of TB
Baseline characteristics Catastrophic cost incurrencec Crude Adjustede
N (%)d OR (95 %CI) OR (95 %CI)
Case finding model
PCFa 13/44 (30) 1.00 1.00
ACF 8/52 (15) 0.43 (0.16–1.17) 0.17 (0.05–0.67)*
Sex
Femalea 6/35 (30) 1.00 1.00
Male 15/61 (25) 1.58 (0.55–4.52) 1.65 (0.49–5.53)
Age categoryb
≤50 yearsa 9/51 (18) 1.00 1.00
>50 years 12/45 (27) 1.70 (0.64–4.51) 2.09 (0.67–6.52)
Education level
Up to primary school onlya 11/33 (33) 1.00 1.00
Secondary school and above 10/63 (16) 0.38 (0.14–1.02) 0.15 (0.04–0.60)*
Employment status
Unemployeda 4/25 (16) 1.00 1.00
Employed 17/71 (24) 1.65 (0.50–5.49) 4.14 (0.83–20.76)
Social Health Insurance status
Uninsureda 5/20 (25) 1.00 1.00
Insured 16/76 (21) 0.80 (0.25–2.53) 0.78 (0.19–3.23)
a
Referent;
b
Age>50 years (mean age for pooled sample);
c
N=96;
d
Denotes participants that incurred catastrophic costs over the total number of people in a given subgroup;
e
Multivariate logistic regression incorporating all shown patient covariates (i.e., case finding model, sex, etc.) as exposure parameters for the model
* Statistically significant difference at 95 % confidence level
As catastrophic cost incurrence is defined on the basis It may be that the ACF cohort was unable to afford
of household income [36], the temporary loss of one other alternatives, and therefore were receptive to the
source of income may have been compensated by the CHW’s referral to the NTP. This is also supported by
remaining household members in our setting. Therefore, our finding that ACF did not significantly reduce the
it will be important to assess the productivity of the time between symptom onset and treatment initiation,
other household members, when evaluating vulnerability i.e., diagnostic delays, as observed in other settings
to catastrophic cost incurrence and optimizing eligibility [39]. Particularly, the hypothesis is that ACF patients
for social protection mechanisms. were significantly poorer and as such potentially de-
One critical yet underemphasized benefit of ACF is layed accessing healthcare altogether until approached
the ability to reach more marginalized populations and and counseled by a CHW. Meanwhile, the PCF co-
increase equity in TB care [31, 37]. Our study’s ACF ac- hort visited private and non-NTP public providers at
tivities evinced similar benefits as we reached more so- a higher rate prior to reaching the NTP. This
cioeconomically disadvantaged groups, who more optimization of the patient pathway is a key socio-
commonly lacked basic essentials and access to social protective effect of ACF that has also been docu-
protection mechanisms. TB patients in the ACF cohort mented elsewhere [40–42].
more commonly resorted to financial coping mecha- The reduction in health facility visits resulting
nisms to manage the socioeconomic burden of TB. As from CHW referrals to the NTP optimized the pa-
such, it was encouraging to observe that our ACF activ- tient pathway and likely helped to reduce costs
ities optimized the TB care pathway. ACF patients re- among ACF patients. A systematic review of TB-
ported fewer health-seeking events before treatment and related patient costs in sub-Saharan Africa shows
fewer hospitalizations than PCF patients. ACF patients that policies and programs improving access to
also more frequently sought care directly with the NTP, healthcare has the potential to reduce pre-treatment
while PCF patients tended to access several healthcare costs, though the optimal modality for reducing
providers before finally reaching the NTP [38]. costs to patients remains unknown [43]. ACFVo et al. BMC Health Services Research (2021) 21:1051 Page 9 of 11
Table 4 Socioeconomic impact and catastrophic costs in patients diagnosed through ACF and PCF at individual treatment periods
Variables Pre-treatment, ORd Intensive ORd Continuation ORd End of ORd
N (%) (95 % CI) phase, N (%) (95 % CI) phase, N (%) (95 % CI) treatment, (95 % CI)
N (%)
ACF PCF ACF PCF ACF PCF ACF PCF
(N = (N = (N = (N = (N = (N = (N = (N =
52) 46) 52) 46) 52) 46) 52) 46)
Catastrophic costsa 8 (15) 13 (30) 0.43 8 (22) 17 (46) 0.32 11 (22) 12 (27) 0.76 10 (20) 10 (22) 0.86
(0.16– (0.12– (0.30–1.93) (0.32–
1.17) 0.90)* 2.29)
Unemployed 5 (10) 8 (17) 0.51 15 (29) 21 (46) 0.48 10 (19) 10 (22) 0.86 7 (13) 9 (20) 0.64
(0.15– (0.21–1.11) (0.32–2.29) (0.22–
1.67) 1.88)
Poverty headcountb 11 (21) 8 (17) 1.27 22 (42) 19 (41) 1.04 12 (23) 10 (22) 1.08 11 (21) 9 (20) 1.10
(0.46– (0.47–2.33) (0.42–2.80) (0.41–
3.51) 2.96)
Social NA NA NA 21 (66) 11 (34) 2.16 19 (41) 27 (59) 0.41 19 (45) 23 (55) 0.58
exclusion (0.90–5.17) (0.18–0.91)* (0.26–
1.29)
Loss of NA NA NA 15 (29) 18 (39) 0.63 12 (23) 16 (35) 0.56 8 (15) 11 (24) 0.58
employment (0.27–1.47) (0.23–1.36) (0.21–
1.59)
Financial impactc NA NA NA 29 (56) 18 (39) 1.96 27 (52) 20 (43) 1.40 19 (37) 19 (41) 0.82
(0.87–4.39) (0.63–3.11) (0.36–
1.84)
Coping strategies NA NA NA 14 (27) 7 (15) 2.05 20 (38) 5 (11) 5.12 15 (29) 11 (24) 1.29
(0.75–5.64) (1.73– (0.51–
15.14)* 3.18)
a
Catastrophic costs calculated according to the income reported in each period of analysis;
b
Poverty line established by the World Bank = $1.90, International Dollar ($) applying purchase power parity (PPP), 2017 prices, conversion factor = $7,716.43;
c
Patients indicating that they were poorer or much poorer as a result of their episode of TB;
d
Univariate odds ratio accounting for autocorrelation using generalized estimation equation methods with working correlation structure obtained using quasi-
likelihood information criteria
patients also reported significantly fewer costs from However, once TB was diagnosed and treatment
lost income. Past studies identified this category as a commenced we observed no significant differences
major source of economic burden for TB patients between the PCF and ACF cohorts. This either sug-
[11, 44]. A reason may be that the socio-protective gests that TB had a greater impoverishing effect on
effects of community-based ACF do not end after PCF patients or could also mean that better socio-
enrollment. Patient support provided by CHWs economic conditions afforded the freedom to forego
throughout treatment, especially during the intensive income-generating activities. This is supported by
phase, can ameliorate economic burdens as well. the higher rates of formal employment among PCF
This included collection and transport of sputum for patients, who were more likely to benefit from statu-
follow-up testing and provision of counseling and tory job protections, such as paid sick leave and pro-
psychosocial support. These services were offered tection from unlawful termination [47].
free of charge thereby alleviating any associated costs Through the longitudinal design of our study, we were
for the patient. Our study also found that ACF pa- able to observe a near-full recovery of household income
tients incurred significantly lower direct medical loss and employment in both cohorts during the con-
costs during treatment. PCF patients reported more tinuation phase. The recovery was likely a consequence
additional visits to private providers during the treat- of TB patients returning to work to recover from the
ment phase (see Table 1), which resulted in higher loss in productivity experienced during the illness,
costs from medical fees and consultations. While our whether it was related to directly observed treatment,
health economic evaluation of these activities is on- TB-related disability or statutory leave during the inten-
going, they comprise well-documented benefits of sive phase. A similar longitudinal survey conducted
community-based care [45, 46]. among ACF and PCF TB patients in Nepal did not show
It is important to note that within our study sam- any income recovery during treatment. This discordance
ple, the PCF cohort reported significantly higher was possibly a result of Viet Nam’s stronger economy,
pre-treatment individual and household incomes. which offered more employment options after theVo et al. BMC Health Services Research (2021) 21:1051 Page 10 of 11
completion of TB treatment, a greater ability for TB pa- Acknowledgements
tients to re-enter the job market, and to recover from The authors express their sincere gratitude to the Viet Nam National
Tuberculosis Control Programme, the Ho Chi Minh City Provincial TB
the deleterious socioeconomic impact of TB. Program and the Ho Chi Minh City Public Health Association for their
The socioeconomic burden throughout individual support during active case finding implementation and survey
treatment phases requires further investigation, but administration. We would like to recognize the contributions of Linh Hoang
for coordinating the study in the community. Lastly, we would like to thank
our findings that the burden was highest during the the participants who provided sensitive information about the costs they
intensive phase may inform and optimize social pro- bore during their TB treatment. Without their candor, we would be unable
tection mechanisms. As attention to social protection to make any progress in understanding the burden of TB-related catastrophic
costs and how to alleviate them.
schemes, such as cash transfers, is increasing, [48] it
may be worthwhile to systematically compare the ef- Authors’ contributions
fects of providing social support during the intensive LNQV, KL, BS, MC and NTSF were responsible for the conception and initial
phase only versus throughout the full treatment study protocol. AJC, RJF, HMTD, VVT, LHN, KSA and NTSF contributed to the
study design and methodology. Investigation and data acquisition was
course. This approach has the potential to optimize performed by RJF, AJC, HMTD and VVT. LNQV, NTSF and AJC conducted and
resource allocation for social protection schemes. contributed to the statistical analysis. LNQV, RJF and NTSF drafted the
Our study was subject to recall and social desirabil- manuscript with input from all authors. MC, KL, EW edited the initial paper.
All authors critically reviewed and commented on the paper. All authors
ity bias. We believe the longitudinal design of the read and approved the final paper for publication. LNQV, BS, KL and MC led
survey and audit of receipts mitigated the impact of the funding acquisition. Project administration and supervision was
these limitations, but also required a concerted effort conducted by LNQV, RJF, LHN, HBN, NVN, BS, KL, MC and NTSF.
to remind patients of the period in question when
Funding
assessing costs, as well as time and income losses. Fo- The IMPACT-TB study and LNQV, AJC, RJF, BS, KL, MC and NTSF were sup-
cusing solely on HCMC biased our data towards a ported by the European Commission’s Horizon 2020 programme under grant
agreement number 733174. The funding body had no role in the design of
higher socioeconomic class and limited the
the study, in collection, analysis, and interpretation of data, or in writing the
generalizability of our findings in the national and manuscript.
international context. As the study was conducted
under programmatic conditions, patient follow-up was Availability of data and materials
The data that support the findings of this study are available from the Viet
periodically affected by supply chain and program ir- Nam National TB Control Program and Pham Ngoc Thach Provincial TB
regularities. Through close collaboration with the pro- Hospital, but restrictions apply to the availability of these data, which include
vincial and national TB control programs, we tried to programmatic clinical patient information, and so are not publicly available.
Data are can be made available from the authors upon reasonable request
minimize the impact of these irregularities. and with permission of the Viet Nam National TB Control Program and
Pham Ngoc Thach Provincial TB Hospital.
Conclusions
ACF can be effective in reaching vulnerable popula- Declarations
tions and mitigating the socioeconomic burden of TB. Ethics approval and consent to participate
Programs should consider ACF a key strategy to sup- Approvals were granted by the Liverpool School of Tropical Medicine
port TB-affected families and achieve the WHO End Research Ethics Committee (17–019) and Pham Ngoc Thach Provincial TB
Hospital Institutional Review Board (430/HDDD-PNT). The implementation of
TB Strategy goals. Nevertheless, as TB remains a the interventions was approved by the HCMC People’s Committee (214/QD-
catastrophic life event, social protection efforts must UBND, 2138/QD-UBND, 2878/QD-UBND). The NTP approved use of
extend beyond ACF. Given resource limitations, it programmatic treatment data. All protocols were carried out in accordance
with relevant guidelines and regulations. Before the interview, we provided a
may be possible to focus these efforts on TB patients written participant information sheet, a verbal explanations of the study and
in the intensive phase of treatment so that more TB– an opportunity to ask questions to ensure all participants were aware of the
affected families can receive support. study. All participants provided informed written consent. All data were
anonymized prior to analysis.
Abbreviations
ACF: Active Case Finding; CHW: Community Health Worker; CI: Confidence Consent for publication
Interval; CXR: Chest X-ray; DS-TB: Drug-Susceptible Tuberculosis; EP: Extra- Not applicable.
pulmonary; GEE: Generalized Estimating Equation; HCMC: Ho Chi Minh City;
MDR-TB: Multi-drug Resistant Tuberculosis; MPI(-TB): Multidimensional Competing interests
Poverty Index (for TB); NTP: National TB Control Program; (a)OR: (adjusted) The authors declare that they have no competing interests with regard to
Odds Ratio; PCF: Passive Case Finding; SHI: Social Health Insurance; this work.
TB: Tuberculosis; WHO: World Health Organization
Author details
1
Supplementary Information Friends for International TB Relief, 1/21 Le Van Luong, Nhan Chinh, Thanh
The online version contains supplementary material available at https://doi. Xuan, Ha Noi, Vietnam. 2IRD VN, Ho Chi Minh City, Vietnam. 3Department of
org/10.1186/s12913-021-06984-2. Global Public Health, Karolinska Institutet, Solna, Sweden. 4Pham Ngoc Thach
Hospital, Ho Chi Minh City, Vietnam. 5National Lung Hospital, Ha Noi,
Vietnam. 6Liverpool School of Tropical Medicine, Department of Clinical
Additional file 1: Sciences, Liverpool, UK. 7Birat Nepal Medical Trust, Lazimpat, Kathmandu,
Nepal. 8Department of Health Sciences, University of York, York, UK.Vo et al. BMC Health Services Research (2021) 21:1051 Page 11 of 11
Received: 8 May 2021 Accepted: 1 September 2021 27. Alkire S, Foster J. Counting and Multidimensional Poverty Measurement.
28. Indicator W. Minimum Wage – Vietnam.
29. The World Bank. Poverty headcount ratio at $1.90 a day (2011 PPP). 2019.
https://data.worldbank.org/topic/poverty. Accessed 18 Apr 2020.
References 30. World Bank Group. Purchasing Power Parities and the Size of World
1. Spence DPS, Hotchkiss J, Williams CSD, Davies PDO. Tuberculosis and Economies: Results from the 2017 International Comparison Program.
poverty. BMJ. 1993;307:759–61. Washington, D.C.: The World Bank; 2020. doi:https://doi.org/10.1596/978-1-4
2. Siroka A, Law I, Macinko J, Floyd K, Banda R, Hoa N, et al. The Effect of 648-1530-0.
Household Poverty on Child Labor in Nigeria. Int J Tuberc Lung Dis. 2016; 31. Shewade HD, Gupta V, Satyanarayana S, Kharate A, Sahai KN, Murali L, et al.
20:1603–8. Active case finding among marginalised and vulnerable populations
3. Dowdy DW, Golub JE, Chaisson RE, Saraceni V. Heterogeneity in tuberculosis reduces catastrophic costs due to tuberculosis diagnosis. Glob Health
transmission and the role of geographic hotspots in propagating epidemics. Action. 2018;11:1494897. doi:https://doi.org/10.1080/16549716.2018.1494897.
PNAS. 2012;109. 32. Viney K, Islam T, Hoa NB, Morishita F, Lönnroth K. The Financial Burden of
4. Ortblad KF, Salomon JA, Bärnighausen T, Atun R. Stopping tuberculosis: A Tuberculosis for Patients in the Western-Pacific Region. Trop Med Infect Dis.
biosocial model for sustainable development. Lancet. 2015;386:2354–62. 2019;4:94.
5. Xu K, Evans DB, Kawabata K, Zeramdini R, Klavus J, Murray CJL. Household 33. Nguyen LD, Raabe K, Grote U. Rural-Urban Migration, Household
catastrophic health expenditure: A multicountry analysis. Lancet. 2003;362: Vulnerability, and Welfare in Vietnam. World Dev. 2015;71:79–93.
111–7. 34. Bourguignon FJ. Economic growth, poverty, and household welfare in
6. Boccia D, Bond V. The catastrophic cost of tuberculosis: Advancing research Vietnam. 2004.
and solutions. Int J Tuberc Lung Dis. 2019;23:1129–30. 35. Fuady A, Houweling TAJ, Mansyur M, Richardus JH. Catastrophic total costs
7. Muniyandi M, Thomas BE, Karikalan N, Kannan T, Rajendran K, Saravanan B, in tuberculosis-affected households and their determinants since
et al. Association of Tuberculosis With Household Catastrophic Expenditure Indonesia’s implementation of universal health coverage. Infect Dis Poverty.
in South India. JAMA Netw open. 2020;3:e1920973. 2018;7:1–14.
8. World Health Organization. The End TB Strategy. Geneva, Switzerland; 2015. 36. Wingfield T, Boccia D, Tovar M, Gavino A, Zevallos K, Montoya R, et al.
9. World Health Organization. Global Tuberculosis Report 2020. Geneva, Defining Catastrophic Costs and Comparing Their Importance for Adverse
Switzerland; 2020. Tuberculosis Outcome with Multi-Drug Resistance: A Prospective Cohort
10. World Health Organization. Tuberculosis patient cost surveys: a handbook. Study, Peru. PLoS Med. 2014;11.
2017. 37. Kuznetsov VN, Grjibovski AM, Mariandyshev AO, Johansson E, Bjune GA. A
11. Nhung N V., Hoa NB, Anh NT, Anh LTN, Siroka A, Lönnroth K, et al. comparison between passive and active case finding in TB control in the
Measuring catastrophic costs due to tuberculosis in Viet Nam. Int J Tuberc Arkhangelsk region. Int J Circumpolar Health. 2014;73.
Lung Dis. 2018;22:983–90. 38. Hoa NB, Tiemersma EW, Sy DN, Nhung N V., Vree M, Borgdorff MW, et al.
12. Gurung SC, Dixit K, Rai B, Caws M, Paudel PR, Dhital R, et al. The role of Health-seeking behaviour among adults with prolonged cough in Vietnam.
active case finding in reducing patient incurred catastrophic costs for Trop Med Int Heal. 2011;16:1260–7.
tuberculosis in Nepal. Infect Dis Poverty. 2019;:1–15. 39. Shewade HD, Gupta V, Satyanarayana S, Pandey P, Bajpai UN, Tripathy JP,
13. Kranzer K, Afnan-Holmes H, Tomlin K, Golub JE, Shapiro AE, Schaap A, et al. et al. Patient characteristics, health seeking and delays among new sputum
The benefits to communities and individuals of screening for active smear positive TB patients identified through active case finding when
tuberculosis disease: A systematic review. Int J Tuberc Lung Dis. 2013;17: compared to passive case finding in India. PLoS One. 2019;14:1–23.
432–46. 40. Yuen CM, Amanullah F, Dharmadhikari A, Nardell EA, Seddon JA, Vasilyeva I,
14. Fox GJ, Nhung N V., Sy DN, Hoa NLP, Anh LTN, Anh NT, et al. Household- et al. Turning off the tap: Stopping tuberculosis transmission through active
Contact Investigation for Detection of Tuberculosis in Vietnam - case-finding and prompt effective treatment. Lancet. 2015;386:2334–43.
Supplementary Appendix. N Engl J Med. 2018;378:221–9. doi:https://doi. 41. Storla DG, Yimer S, Bjune GA. A systematic review of delay in the diagnosis
org/10.1056/NEJMoa1700209. and treatment of tuberculosis. BMC Public Health. 2008;8:1–9.
15. Marks GB, Nguyen N V., Nguyen PTB, Nguyen TA, Nguyen HB, Tran KH, et al. 42. Getnet F, Demissie M, Assefa N, Mengistie B, Worku A. Delay in diagnosis of
Community-wide Screening for Tuberculosis in a High-Prevalence Setting. N pulmonary tuberculosis in low-and middle-income settings: Systematic
Engl J Med. 2019;381:1347–57. review and meta-analysis. BMC Pulm Med. 2017;17:1–15.
16. Mac TH, Phan TH, Nguyen V Van, Dong TTT, Le H Van, Nguyen QD, et al. 43. Barter DM, Agboola SO, Murray MB, Bärnighausen T. Tuberculosis and
Optimizing Active Tuberculosis Case Finding: Evaluating the Impact of poverty: the contribution of patient costs in sub-Saharan Africa – a
Community Referral for Chest X-ray Screening and Xpert Testing on Case systematic review. BMC Public Health. 2012;12:980. doi:https://doi.org/10.11
Notifications in Two Cities in Viet Nam. Trop Med Infect Dis. 2020;221:1–15. 86/1471-2458-12-980.
17. Vo LNQ, Codlin AJ, Forse RJ, Nguyen NT, Vu TN, Le GT, et al. Evaluating the 44. Tanimura T, Jaramillo E, Weil D, Raviglione M, Lönnroth K. Financial burden
yield of systematic screening for tuberculosis among three priority groups for tuberculosis patients in low- And middle-income countries: A systematic
in Ho Chi Minh City, Viet Nam. Infect Dis Poverty. 2020;9:1–13. review. Eur Respir J. 2014;43:1763–75.
18. Morishita F, Yadav RP, Eang MT, Saint S, Nishikiori N. Mitigating financial 45. Getahun H, Raviglione M. Transforming the global tuberculosis response
burden of tuberculosis through active case finding targeting household and through effective engagement of civil society organizations: the role of the
neighbourhoodcontacts in Cambodia. PLoS One. 2016;11:1–22. World Health Organization. Bull World Health Organ. 2011;89:616–8.
19. Gurung SC, Rai B, Dixit K, Worrall E, Paudel PR, Dhital R, et al. How to reduce 46. World Health Organization. WHO guideline on health policy and system
household costs for people with tuberculosis: a longitudinal costing survey support to optimize community health worker programmes. Geneva; 2018.
in Nepal. Health Policy Plan. 2021;36:594–605. 47. Viet Nam National Assembly. Compendium of Labor Laws [Vietnamese].
20. Vo LNQ, Codlin AJ, Huynh HB, Mai TDT, Forse RJ, Truong V Van, et al. 2019.
Enhanced Private Sector Engagement for Tuberculosis Diagnosis and 48. Wingfield T, Tovar MA, Huff D, Boccia D, Montoya R, Ramos E, et al. A
Reporting through an Intermediary Agency in Ho Chi Minh City, Viet Nam. randomized controlled study of socioeconomic support to enhance
Trop Med Infect Dis. 2020;5:1–13. tuberculosis prevention and treatment, Peru. Bull World Heal Organ. 2017;
21. Nguyen LH, Codlin AJ, Vo LNQ, Dao T, Tran D, Forse RJ, et al. An Evaluation 95:270–80. doi:https://doi.org/10.2471/BLT.16.170167.
of Programmatic Community-Based Chest X-ray Screening for Tuberculosis
in Ho Chi Minh City, Vietnam. Trop Med Infect Dis. 2020;5:185.
22. Ho Chi Minh City Statistics Office. Population and Labour. 2017. Publisher’s Note
23. World Health Organization. The tool to estimate patients’ costs. 2008. Springer Nature remains neutral with regard to jurisdictional claims in
24. OANDA. Historical exchange rates. 2016. 2018. published maps and institutional affiliations.
25. Le HV, Nguyen CV, Phung TD. Multidimensional Poverty: First Evidence from
Vietnam. Ha Noi, Viet Nam; 2015.
26. Office of the Prime Minister. Promulgating multidimensional poverty levels
applicable during 2016–2020. 2015.You can also read