Bangladesh Stove Trial: Fuel Efficiency and Usage Prepared for WASHplus - With guidance from FHI360 and Winrock International Berkeley Air ...
←
→
Page content transcription
If your browser does not render page correctly, please read the page content below
Bangladesh Stove Trial: Fuel Efficiency and Usage

Prepared for WASHplus
With guidance from FHI360 and Winrock International

Berkeley Air Monitoring Group

FINAL: July 2013
Authors and Acknowledgments

Authors
Berkeley Air Monitoring Group
   Kirstie Jagoe
   David Pennise, Project Manager                +1-510-649-9355      dpennise@berkeleyair.com
   Dana Charron

Field Teams
Berkeley Air Monitoring Group
   Todd Wofchuck, Field Team Leader

Village Education Resource Center (VERC)
   A K M Anowar Hossain Mollah
   Syeda Hosneara Akter
   Shajahan Mia
   Laila Ishrat Jahan Ruen
   Dinabondhu Shikder
   Bakul Hossain

Women Development Program
  Mizanur Rahman

Esho Jati Gorhi
  Ilias Hossain

Siddique Sanitation
   Kazi Nurul Alam

Institute of Development Affairs (IDEA)
   Zahid Bhuyan

The authors wish to thank the following individuals and organizations for their support and assistance with this p

   Elisa Derby, Winrock International
   Lizi Feng, Berkeley Air Monitoring Group
   Maneet Kaur, Berkeley Air Monitoring Group
   Ajay Pillarisetti, Berkeley Air Monitoring Group

Prepared by Berkeley Air Monitoring Group
July 2013
                                                                                          2
Bangladesh Stove Trial: Winrock International, WASHPlus and FHI 360

Table of Contents
ABBREVIATIONS ...................................................................................................................................................... 4

EXECUTIVE SUMMARY.......................................................................................................................................... 5

1
   INTRODUCTION ................................................................................................................................................. 6

    1.1
   STUDY BACKGROUND AND OBJECTIVES .......................................................................................................... 6

    1.2
   OVERVIEW OF PROJECT STOVES ....................................................................................................................... 7

2
   METHODS............................................................................................................................................................. 8

    2.1
   OVERVIEW OF STUDY DESIGN .......................................................................................................................... 8

    2.2
   FUEL EFFICIENCY ASSESSMENT ....................................................................................................................... 9

    2.3
   STOVE USE AND ADOPTION .............................................................................................................................. 9

    2.4
   HOUSEHOLD AIR POLLUTION MONITORING METHODS .................................................................................. 10

    2.5
   PERSONAL EXPOSURE MONITORING METHODS ............................................................................................. 11

       2.5.1
   Exposure of the main cook ..................................................................................................................... 11

       2.5.2
   Exposure of the child ............................................................................................................................. 12

    2.6
   QUALITY ASSURANCE ..................................................................................................................................... 12

3
   RESULTS ............................................................................................................................................................. 12

    3.1
   STOVE USE AND ADOPTION ............................................................................................................................ 12

    3.2
   FUEL CONSUMPTION MEASUREMENTS ........................................................................................................... 15

    3.3
   HOUSEHOLD AIR POLLUTION AND PERSONAL EXPOSURE ............................................................................... 20

       3.3.1
   Household air pollution ......................................................................................................................... 20

       3.3.2
   Personal exposure monitoring............................................................................................................... 21

       3.3.3
   Compliance with equipment................................................................................................................... 22

    3.4
   STOVE PERCEPTIONS....................................................................................................................................... 22

       3.4.1
   Reasons for refusals to take part in KPT ............................................................................................... 23

4
   DISCUSSION....................................................................................................................................................... 24

    4.1
     STUDY LIMITATIONS ....................................................................................................................................... 24

    4.2
     COMPARISON TO STOVE PERFORMANCE STANDARDS ..................................................................................... 26

    4.3
     COMPARISON TO HOUSEHOLD AIR POLLUTION HEALTH STANDARDS .............................................................. 27

    4.4
     FUTURE STUDY CONSIDERATIONS .................................................................................................................. 27

5
   REFERENCES .................................................................................................................................................... 28

6
   APPENDICES...................................................................................................................................................... 29


Prepared by Berkeley Air Monitoring Group
July 2013
                                                                                                                                                                   3
Abbreviations

Abbreviation          Meaning
CO                    Carbon monoxide
HH                    Household
HAP                   Household air pollution
g                     Gram
kg                    Kilogram
KPT                   Kitchen Performance Test
LPG                   Liquefied petroleum gas
m                     Meter
mg                    Milligram
PM2.5                 Particulate matter less than 2.5 microns in diameter
ppm                   Parts per million
SA                    Standard adult
SD                    Standard deviation
SUMS                  Stove use monitoring system

Prepared by Berkeley Air Monitoring Group
July 2013
                                                                             4
Bangladesh Stove Trial: Winrock International, WASHPlus and FHI 360

  Executive Summary

This report presents the findings from two technical sub-studies that were incorporated into
formative research activities in Bangladesh conducted under the USAID-funded WASHplus
project, in which five improved wood-burning cookstoves were compared to the traditional
technology. The primary activity was to measure stove efficiency through a direct-measurement
protocol, entitled the Kitchen Performance Test, in a total of 140 homes in two locations.
Consumption of wood and other household fuels was measured over three full days in 22-24
homes using each of the five intervention stove models and in 24 control households using
traditional cookstoves. Additionally, temperature-logging sensors were used to track cookstove
usage. A secondary sub-study focused on measuring health-related indicators, including air
pollution in household kitchens and exposure of the cooks and their young children to carbon
monoxide.
Key Results
   • Data from usage sensors (SUMS) suggested that all intervention stoves were frequently
      used by the study households, but none of them fully displace the use of the traditional
      stoves. During the fuel-use monitoring period, average uses per day for the intervention
      stoves were between 2.1 to 3.3 and 1.3 to 1.9 for the traditional stove.
   • Once the field teams stopped visiting the test homes daily to take fuel measurements, all
      stove groups, including the traditional stove ‘control’ homes, showed a marked reduction
      in the use of any stoves, both intervention and traditional. The largest decline was seen in
      the use of the intervention stoves.
   • All intervention stoves except one used on average 16-30% less fuel per household per
      day and 5-18% less per standard adult per day compared to the traditional stove group.
   • In a very limited snapshot of indoor air pollution, all of the intervention stoves were seen
      to reduce kitchen concentrations of carbon monoxide and fine particulate matter,
      although not to what are considered to be health-protective levels.
   • The pilot measurements of 24-hour exposure to carbon monoxide revealed low exposure
      levels that were not health threatening, even in homes with traditional stoves.

Prepared by Berkeley Air Monitoring Group
July 2013
                                                                                          5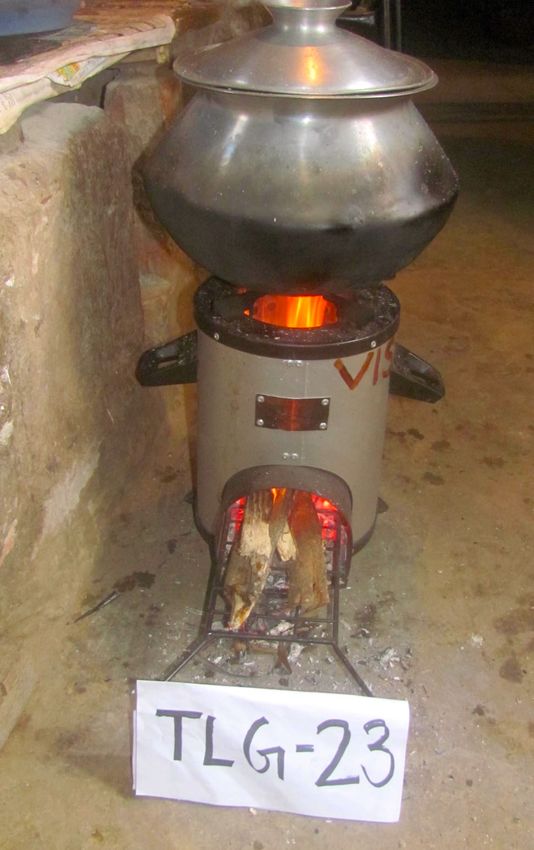
Bangladesh Stove Trial: Winrock International, WASHPlus and FHI 360

1 Introduction

   1.1 Study Background and Objectives
WASHplus’ current work aims to assess the interest of Bangladeshi cooks in having more choice
in the improved stove market and their willingness to pay for these.
Pilot research being conducted by FHI360 and Winrock International under the current
WASHplus project activities in Bangladesh focuses on household trials of five improved wood-
burning cookstoves. The components of this research undertaken by Berkeley Air are composed
of three discrete efforts:
    •    a broad qualitative household survey aimed at documenting the user’s immediate
         experience and exploring their perceptions, needs, and willingness to pay;
    •    cookstove fuel efficiency and usage measurements, conducted in a subset of homes using
         the kitchen performance test (KPT) protocol and temperature-logging stove-use monitors;
         and
    •    feasibility testing of several health-related indicators for household air pollution (HAP)
         concentrations and exposure in a limited illustrative subsample.
The household survey was conducted using a before/after paired study design, whereas a cross-
sectional approach was employed for the KPT and HAP components. After the baseline survey,
improved stoves were installed in homes for 3-4 weeks, during which the KPT and HAP
modules were carried out. Full training on the use of the stove was given to the main cook upon
dissemination.
Capacity building is a key component of the WASHplus cookstove activities in Bangladesh. The
in-field fuel efficiency testing provided an ideal opportunity to develop national cookstove
monitoring capabilities. To achieve this goal, Berkeley Air Monitoring Group led a two-day
classroom training session for a group of field workers comprised of staff from Village
Education Resource Center (VERC), plus four other NGOs and small stove manufacturers. The
classroom training was followed by two weeks of fieldwork during which time the Berkeley Air
field team leader was able to guide and support the local field teams through a complete KPT
cycle.
The objective of the health-related sub-study was to leverage the presence of experienced field
personnel in Bangladesh to collect preliminary data on household air pollution and exposures.
Kitchen concentrations and exposure of women and children to fine particulate matter (PM2.5)
and carbon monoxide (CO) were monitored in the kitchens of a small subset of homes. The
resulting snapshot of the indoor air pollution levels associated with the use of these improved
cookstoves will allow the feasibility and value of a larger in-depth, more robust study to be
gauged by program staff.
Prepared by Berkeley Air Monitoring Group
July 2013                                                                                        6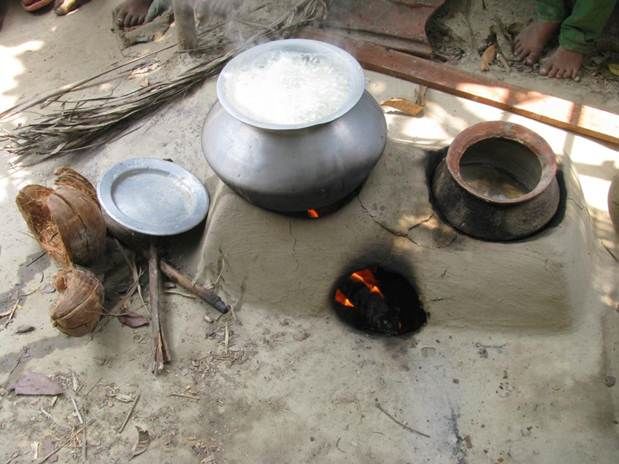
Bangladesh Stove Trial: Winrock International, WASHPlus and FHI 360

   1.2 Overview of Project Stoves
Six study groups were included in the KPT monitoring. Five groups of households, each with
one of the five different wood-burning improved stoves (intervention stoves), and one group of
households (control households) that had only their traditional cookstove, the type most
frequently used in the study communities. Figure 1 shows the intervention and traditional stoves
used by the study households.
Figure 1: Study group stoves.

                 1.1 Traditional stove                                1.2 Envirofit Z3000

              1.3 Prakti Chimney Stove                                  1.4 Eco Chula

Prepared by Berkeley Air Monitoring Group
July 2013                                                                                     7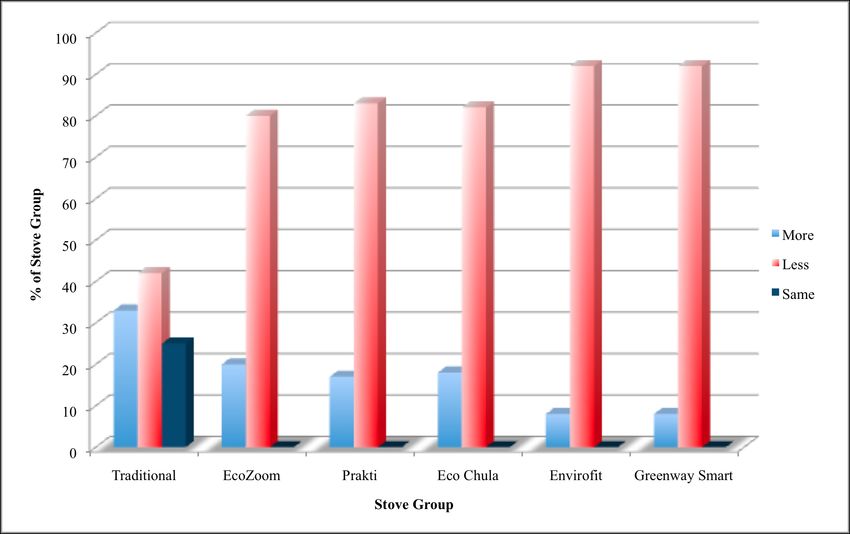
Bangladesh Stove Trial: Winrock International, WASHPlus and FHI 360

              1.5 Greenway Smart Stove                                1.6 EcoZoom Dura

2 Methods

   2.1 Overview of Study Design
The study was carried out using a cross-sectional study design. 24 households who had not
already received an intervention stove were included in the study as control households, along
with 22-24 households for each of the five intervention stove models. This gave an overall
sample size of 140 households. The sample size (20 in each group) was chosen to be able
achieve statistically significant differences in fuel use given an estimated 35-40% reduction in
fuel use by the intervention stoves compared to the traditional stove and a variability in fuel use
measurements typically seen in KPT studies (coefficient of variation in the 0.4-0.45 range). Such
reductions in fuel use have been demonstrated for some of these and other similar intervention
stoves in previous KPT studies from various parts of the developing world. Laboratory test data
on these intervention stoves suggested even greater percent fuel savings, as is often the case. Of
course, budget and logistical considerations also factored into the sample size choice, especially
given the desire to study six different stove types in two locations.
WASHplus local partner NGOs, DESH GORI from Barisal and IDEA from Sylhet, selected the
study villages. In Barisal the villages were Billobari, Bihangal, Ichakathi, and Gonpara; in Sylhet
the villages selected for the study were Jangail, Kewa, Tilargaon, and Kunarchor. Households
were originally selected because they fit the basic criteria of primarily using wood for cooking,
having at least four people in the household with at least one child under 5, and being willing to
participate in the study. Unfortunately, around 20 smaller households made it past the household

Prepared by Berkeley Air Monitoring Group
July 2013                                                                                        8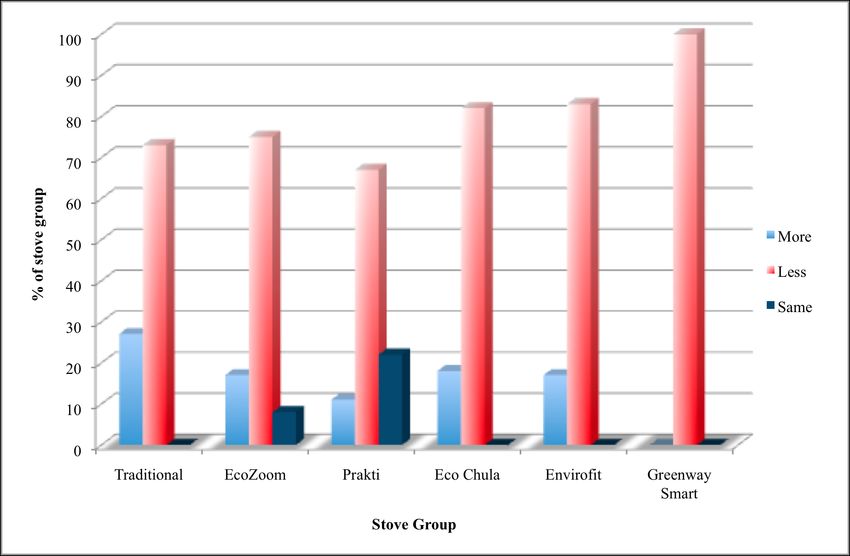
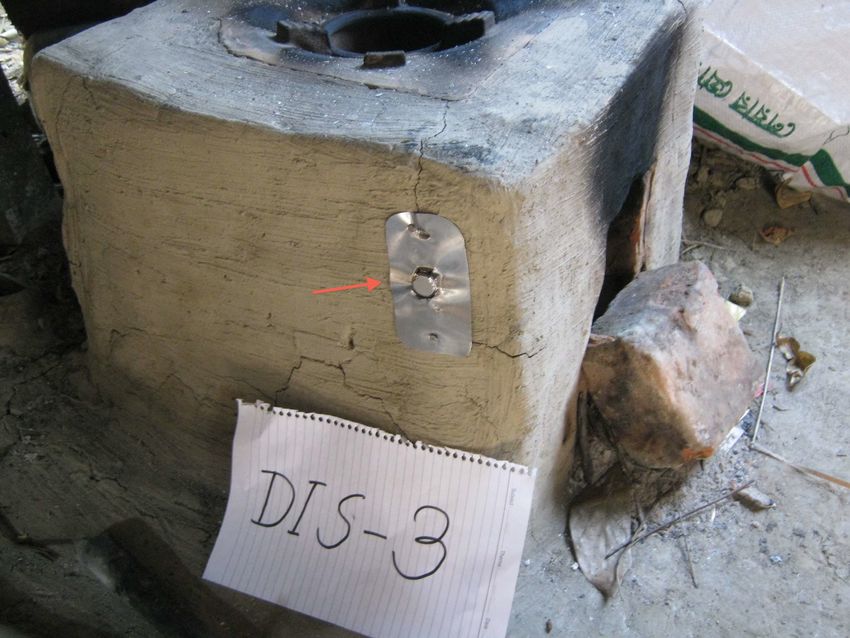
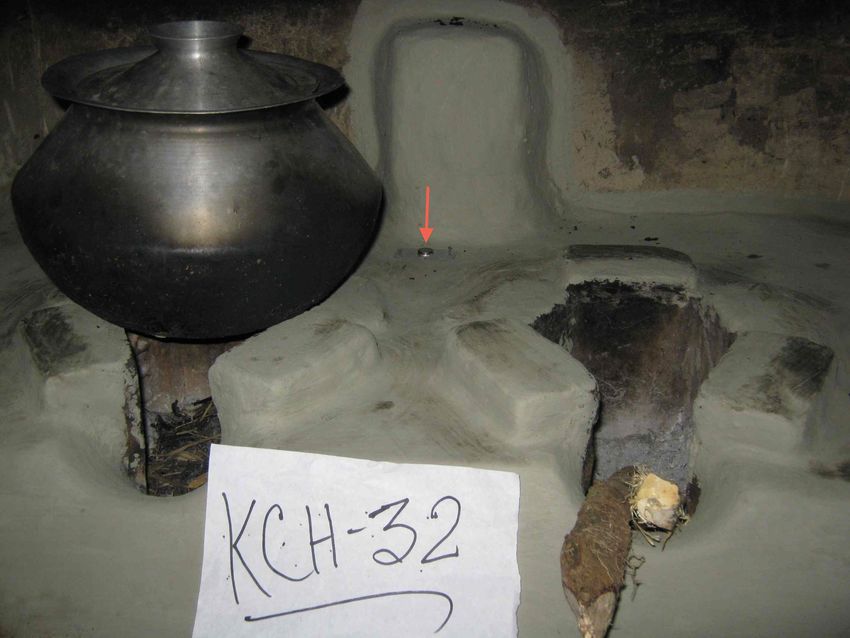
Bangladesh Stove Trial: Winrock International, WASHPlus and FHI 360

selection screening into the study, as the families included members who do not live full time in
the house.
Monitoring was carried out during the dry season in two locations of Bangladesh - Barisal,
located in Southern Bangladesh, and Sylhet, in the Northeast of the country. The primary
cooking fuel in both locations was fuel wood, although at the time of the survey, the use of dried
leaves in combination with wood was prevalent in these communities. There was no
predominant method of fuel procurement within the study group with just under 30% gathering
all fuel and just under 50% of households buying all or most of their fuel.
After being randomly assigned an intervention cookstove, the participants were trained in its use
following manufacturers’ instructions and then asked to “try out the stoves under normal
conditions” for a three week period.

   2.2 Fuel Efficiency Assessment
Fuel efficiency was measured using a 3-day KPT (version 3.0, www.pciaonline.org/testing). The
KPT is widely acknowledged as the best currently available method for accurately estimating
daily household fuel consumption (Bailis et al. 2007; Smith et al. 2007; WHO 2008).
All household fuels to be used (wood, crop residues, charcoal, kerosene, etc.) were weighed at
the beginning and end of each of the three 24-hour monitoring periods using Salter Brecknell
(Fairmont, MN) ElectroSamson digital hand-held scales (25 kg maximum with a resolution of
0.02 kg).
Wood moisture was measured daily in each household using a dual pin, electrical resistance style
moisture meter (Extech MO120) at three points on three randomly selected sticks in the
woodpile.
A short questionnaire was also administered daily to record information about cooking stove and
fuel usage, the number and type of meals prepared, and the number of people cooked for (see
Appendix 1 for a copy of the survey form). The households were asked to maintain their typical
cooking patterns for the duration of the survey.

   2.3 Stove Use and Adoption
Two approaches were used to measure the extent to which households adopted the new stoves
and the manner in which they integrated them into their cooking and kitchen management
practices: the use of stove use monitoring sensors (SUMS) and reported use of stoves at the end
of each 24-hour KPT monitoring period. The SUMS temperature-logging sensors were affixed to
the stoves to collect data on how often the stoves were “turned on” (i.e. lit). The sensors were
iButton model DS1922T, manufactured by Maxim Integrated, USA. Figure 2 shows the
placement of the SUMS iButtons on the traditional and Envirofit Z3000 stoves, as an example.

Prepared by Berkeley Air Monitoring Group
July 2013                                                                                       9
Bangladesh Stove Trial: Winrock International, WASHPlus and FHI 360

Figure 2: SUMS iButton placements.
     Figure 2.1. SUMS iButton placement on                   Figure 2.2. SUMS iButton placement on Envirofit
             traditional cooking stove                                        Z3000 stove

These approaches are summarized in Table 1.
Table 1: Stove use and adoption assessment methods.
Method of Data                                                                     Resulting Usage
                               Method Details
Collection                                                                         Information
Stove use monitoring           SUMS placed on all intervention stoves, all         Measured number of stove
sensors (SUMS)                 traditional stoves in the control group, and on     uses each day throughout the
                               the traditional stoves in a subset (51%) of the     10-day monitoring period.
                               intervention homes. SUMS were also placed in
                               10 kitchens to measure ambient temperature.
                               Stove temperatures were recorded for at least 10
                               days starting when the KPTs were begun.
Technical questionnaire        Cooks were asked about their household energy       Self-reported number of stove
administered daily during      practices for the previous 24 hours throughout      uses by stove type each day
the 3-day KPT period           the 3-day KPT. Details about stove use, fuel use,   for the 3-day KPT period
                               and numbers cooked for were recorded.

The SUMS recorded the stove temperature every 10 minutes for a total of approximately 10 days
(data was recorded in some households for slightly longer periods due to a delay in gaining
access to the kitchen to remove the buttons). The resulting temperature profiles were then
analyzed to determine the frequency of “cooking events” (i.e. number of times the stoves were
lit) per day.

   2.4 Household Air Pollution Monitoring Methods
The impact of the interventions on household air quality was explored during the KPT
monitoring in a subset of seven homes (two households from the traditional stove group and one
household from each of the five intervention stove groups.). There were a total of four
Prepared by Berkeley Air Monitoring Group
July 2013                                                                                                          10
Bangladesh Stove Trial: Winrock International, WASHPlus and FHI 360 households monitored in Barisal and three in Sylhet. This limited sample size was selected with the goal of demonstrating the feasibility of measuring health-related indicators in household energy projects in Bangladesh and collecting some illustrative results; it was not expected to generate statistically significant results. Small particles (PM2.5) and carbon monoxide (CO) are the most commonly measured pollutants in wood smoke, as they are widely accepted to be the source of the majority of the ill-health resulting from solid-fuel use. Instruments for measuring these pollutants were placed in the kitchen at one meter from the stove and 1.5 meters above the floor, a standardized location meant to represent the approximate breathing zone of a woman standing near the stove. Minute-by-minute kitchen concentrations were recorded using real-time data-logging instruments in the same seven households where the personal exposure monitoring was performed. PM2.5 was measured with the UCB-PATS (Berkeley Air Monitoring Group, Berkeley, CA, USA), and carbon monoxide (CO) was primarily measured using the GasBadge Pro. In addition, Drager CO Diffusion Tubes were co-located with the GasBadge monitors in the kitchen to establish a relationship between the CO readings from the GasBadge Pro and the Drager tubes. Environmental and contextual information that might impact indoor air quality, such as kitchen volume, was also collected during the studies. 2.5 Personal Exposure Monitoring Methods The impact of the interventions on women and children’s exposure was explored in the same subset of seven homes used for household air pollution monitoring, described in section 2.4. 2.5.1 Exposure of the main cook The cook’s 24-hour exposure to CO was measured using a portable, datalogging GasBadge Pro Single Gas Monitor (Industrial Scientific), which the participant wore on a lanyard around her neck. Participants were asked to wear the monitor as continually as possible and to keep it close by when they were sleeping or bathing. The GasBadge Pro measures CO in the 0-1,500 ppm range in 1 ppm increments. Exposures were also assessed using Drager Carbon Monoxide Diffusion Tubes 50/a-D (50-600 ppm*h, Dräger, Lübeck, Germany). Tubes were placed on the cooks using plastic tube holders and clips. Analysis was carried out on the average of two readings taken immediately after collection. To increase the resolution of the tube readings and reduce error, the stain length was measured in millimeters, and then converted to ppm. Prepared by Berkeley Air Monitoring Group July 2013 11
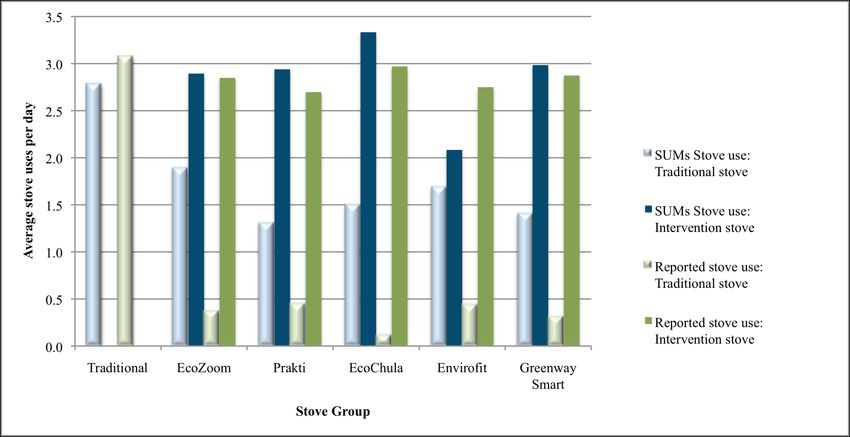
Bangladesh Stove Trial: Winrock International, WASHPlus and FHI 360

2.5.2    Exposure of the child
24-hour exposure to CO was measured on one child less than 5 years of age in six of the seven
households where the adult exposure was monitored (one household did not have a child under 5
available). Exposures were assessed using the Drager carbon monoxide diffusion tubes. Tubes
were placed on each child’s shirt using plastic tube holders and clips. The same procedure was
used for reading the CO tube measurements as with the cooks.

   2.6 Quality assurance
To ensure consistent comparable readings of fuel consumption, each surveyor used the same
scales throughout the KPT study. All scales were calibrated before deployment with NIST
traceable calibration weights at the Berkeley Air laboratory to ensure accurate readings.
The field supervisor reviewed the survey and KPT data at the end of each day for consistency
and completeness. Any discrepancies were addressed as soon as possible.
Prior to deployment in the study, the UCB-PATS were calibrated with wood smoke in the
Berkeley Air laboratory against gravimetric (pump and filter) measurements of PM2.5 (the
standard method), and the GasBadge Pro CO monitors were calibrated with NIST-traceable CO
gas (50 ppm).

3 Results
   3.1 Stove Use and Adoption
Although the SUMS monitoring period was restricted to 10 days due to the limited timeframe of
the monitoring effort, the results do provide a useful snapshot of how the stove was being used
two to three weeks after its introduction to the households.
Monitoring was carried out during the time of the KPT and then for 8-10 days after. Figure 3
shows the mean estimate of traditional and intervention stove uses per day for the different stove
groups both during the time of the KPT (blue shaded columns) and then for the time after the
field staff had ceased the daily home visits required by the KPT (green shaded).

SUMS measured usage rates for all intervention stoves were between 2.1 (Envirofit) and 3.3
(Eco Chula) uses per day during the KPT monitoring, with all groups using the traditional stove
as part of their cooking systems between 1.3 (Prakti stove group) and 1.9 (EcoZoom stove
group) times per day. These usage patterns during KPT monitoring suggest the intervention
stoves were commonly used by the study households, but in all cases, did not fully displace the
use of the traditional stoves.

Prepared by Berkeley Air Monitoring Group
July 2013                                                                                      12
Bangladesh Stove Trial: Winrock International, WASHPlus and FHI 360

The post-KPT stove use estimates were consistently different, however. Once the KPT had
finished and the field staff had left the home, all stove groups, including the traditional stove
‘control’ homes, showed a marked reduction in stove use (See Figure 3).

Figure 3: Traditional and intervention stove use monitored using SUMS during and after the KPT
monitoring period.

Table 2 shows the average number of times a stove (traditional or intervention) was used per day
during and after the KPT monitoring. In all study groups it can be seen that the stove use
decreased dramatically once the KPT monitoring was finished. The biggest reduction was,
however, in the use of the intervention stove, with most groups showing a reduction of about 75-
80% compared to during the KPT monitoring.

Table 2: Average (mean) number of stove uses per day for all stoves.

 Average number of stove uses per day- all stoves
                            During KPT          Post KPT
 Traditional                2.8                 1.4
 EcoZoom                    4.8                 2.1
 Prakti                     4.2                 1.7
 Eco Chula                  4.8                 2.2
 Envirofit Z3000            3.8                 1.6
 Greenway Smart             4.4                 1.9

Prepared by Berkeley Air Monitoring Group
July 2013                                                                                        13
Bangladesh Stove Trial: Winrock International, WASHPlus and FHI 360
The stove use rates reported at the end of each day of KPT monitoring were compared to the
SUMS data from the same period. The data in Figure 4 indicate that the cooks with an
intervention stove were likely to underreport use of the traditional stove but reported use of the
intervention stove with relative accuracy.
Figure 4: Traditional and intervention stove use during the KPT monitoring: reported verses monitored
with SUMS
Between 43 and 67% of stoves in each intervention study group had both traditional and
intervention stove use monitored using SUMS (See Table 3). The proportion of total recorded
cooking events performed by the intervention stoves was examined in these households. Once
again there is a significant difference in stove use patterns during and then after the KPT
monitoring. During the KPTs the intervention stove was contributing to between 60-73% of the
recorded cooking events. Whereas once the field team had left the communities, this fell to
between just under 30% (Envirofit) and just over 45% (Eco Chula group).
Table 3: Proportion of all recorded cooking events performed by the intervention stove (by stove group).
% Stove group with % Cooking performed % Cooking performed
traditional stove data on ICS: During KPT on ICS: Post KPT
EcoZoom 41% 65% 34%
Prakti 50% 72% 43%
Eco Chula 50% 73% 46%
Envirofit Z3000 67% 60% 29%
Greenway Smart 43% 69% 30%
Prepared by Berkeley Air Monitoring Group
July 2013 14Bangladesh Stove Trial: Winrock International, WASHPlus and FHI 360 3.2 Fuel Consumption Measurements The KPT was carried out in 140 households. After removal of inaccurate or missing data, there was a final sample size of 134 (Barisal: 65 HH and Sylhet: 69 HH). Table 4 shows the final sample size by stove group. Table 4: Sample size for KPT monitoring by stove Traditional stove n=23 EcoZoom Dura n=22 Prakti n=22 Eco Chula n=22 Envirofit Z3000 n=24 Greenway Smart Stove n=21 All households in each stove group used wood as their main cooking fuel during the monitoring period, with a small number of homes in Barisal reporting the use of crop residue (in the form of dried leaves) as a secondary fuel (9.0%, n=12). Approximately 79% (n=106) of the households reported to be using less wood fuel at the time the survey was carried out compared to other times of year (Barisal: 80%, n=52; Sylhet: 78%, n=54). Figure 5 shows the responses given by location and stove group. The majority of households in all intervention stove groups across both locations report using less wood at the current time of year. The main exception can be seen in the traditional stove group in Sylhet where, although the majority still report using less wood than their average, it is a significantly reduced proportion within the group compared to all others. Prepared by Berkeley Air Monitoring Group July 2013 15
Bangladesh Stove Trial: Winrock International, WASHPlus and FHI 360

Figure 5: Relative wood fuel use at time of KPT monitoring compared to other times of year by stove
group and location.
Figure 5.1: Sylhet

Figure 5.2: Barisal

Prepared by Berkeley Air Monitoring Group
July 2013                                                                                             16
Bangladesh Stove Trial: Winrock International, WASHPlus and FHI 360

Reasons for the seasonal change in the amount of wood fuel consumed were explored. The fact
that wood is dry (n=80, 70% of group reporting less wood used) and the availability of
agricultural residues (leaves, see Figure 6) (n=24, 21% of group reporting less wood fuel) were
the most frequent answers in both locations across all stove groups.

Figure 6: Dry leaves used as cooking fuel

Table 5 shows the wood fuel consumption estimates (kg/SA/day) for the homes by stove group
and location. It can be seen that there was no statistically significant regional difference in fuel
consumption across the two locations for any stove group except for the groups using the
traditional stove, which showed a lower consumption per standard adult in Sylhet compared to
Barisal (p=0.034).

Prepared by Berkeley Air Monitoring Group
July 2013                                                                                        17
Bangladesh Stove Trial: Winrock International, WASHPlus and FHI 360

Table 5: Mean daily fuel consumption estimates, reported as kg per standard adult (SA)1 per day for stove
and location group. ± represents 1 standard deviation.

                                                                        Wood
Stove Group                            Location                                                   P value*
                                                                     (kg/SA/day)
                                    Barisal (n=11)                    0.86 ± 0.21
Traditional stove                                                                                   0.034
                                     Sylhet (n=12)                    0.60 ± 0.32
                                     Barisal (n=12)                   0.66 ± 0.18
EcoZoom Dura                                                                                        0.122
                                     Sylhet (n=10)                    0.53 ± 0.19
                                     Barisal (n=10)                   0.78 ± 0.58
Prakti                                                                                              0.261
                                     Sylhet (n=12)                    0.58 ± 0.18
                                     Barisal (n=11)                   0.66 ± 0.25
Eco Chula                                                                                           0.506
                                     Sylhet (n=11)                    0.59 ± 0.21
                                     Barisal (n=12)                   0.76 ± 0.31
Envirofit Z3000                                                                                     0.249
                                     Sylhet (n=12)                    0.99 ± 0.58
                                     Barisal (n=9)                    0.70 ± 0.25
Greenway Smart Stove                                                                                0.225
                                     Sylhet (n=12)                    0.65 ± 0.34
** Comparing mean fuel consumption between location within stove group. Equal variances assumed in all cases.

Table 6 shows the daily wood fuel consumption by stove group and in comparison to the
traditional stove group. The estimates show that wood consumption in all intervention stove
groups except the Envirofit Z3000 (see outlier discussion below) was on average 16-30% lower
per household per day and 5-18% lower per standard adult per day compared to the traditional
stove group. None of these differences show statistical significance, however.

1
  "Standard adult" equivalence factors defined in terms of sex and age (from Guidelines for Woodfuel Surveys, for
F.A.O. by Keith Openshaw cited in (Joseph, 1990)). Gender and age fraction of standard adult: child 0-14 years =
0.5; female over 14 years = 0.8; male 15-59 years = 1; and male over 59 years = 0.8.

Prepared by Berkeley Air Monitoring Group
July 2013                                                                                                       18
Bangladesh Stove Trial: Winrock International, WASHPlus and FHI 360
Table 6: Mean daily fuel consumption estimates, reported as kg per standard adult (SA) per day and by
household (HH) per day. ± represents 1 standard deviation.
% savings % savings
Wood Wood
compared to compared to P value*
(kg/HH/day) (kg/SA/day)
trad stove trad stove
Traditional stove (n=23) 3.09 ± 1.69 - 0.73 ± 0.30 - -
EcoZoom Dura (n=22) 2.39 ± 0.77 22.7 0.60 ± 0.19 17.8 0.106
Prakti (n=22) 2.58 ± 1.16 16.5 0.69 ± 0.41 5.5 0.746
Eco Chula (n=22) 2.19 ± 0.79 29.1 0.63 ± 0.23 13.7 0.223
Envirofit Z3000 (n=24) 3.63 ± 1.24 -17.4 0.87 ± 0.47 -19.2 0.214
Greenway Smart Stove
2.32 ± 0.94 24.9 0.62 ± 0.22 15.1 0.217
(n=21)
* Comparing intervention stove with traditional stove for (kg/SA/day value). Equal variances assumed in all cases.
A box plot of the kg wood/SA/day by stove group was examined for the presence of outliers that
might have an impact on the sample mean. Figure 7 below identifies (denoted as circles) one
outlier2 in the Prakti stove group and two in the Envirofit Z3000 group.
Figure 7: Box plot showing fuel consumption by stove group (kg/SA/day).
2
Outlier defined as 1.5 times the inter-quartile range (IQR) from the third (75th) quartile.
Prepared by Berkeley Air Monitoring Group
July 2013 19Bangladesh Stove Trial: Winrock International, WASHPlus and FHI 360 Removal of these data points changes the mean wood fuel consumption for the Prakti stove to 0.63 kg/SA/day (SD 0.28 n=21). This estimate is 13.7% lower than the wood fuel consumption in the traditional stove households (vs. a 5.5% reduction when the data point is included). Removal of the two outliers in the Envirofit stove group would reduce the fuel consumption to 0.77 kg/SA/day (SD 0.34 n=22), an increase of 5.5% compared to the traditional stove estimates (vs. a 19.2% increase when the outliers are included). The data from these outliers was examined for any error or unusual characteristics that might warrant its removal. It was found that all three households cooked for more people during the KPT than they had reported to be their usual number cooked for. This ‘usual number cooked for’ was used to determine the number of standard adults (SA), and so cooking for more people than usual during the KPT results in an unrepresentatively high kg/SA/day value for that household. However, the overall mean number of ‘standard adults’ reported to be usually cooked for was slightly lower than the actual numbers cook for during KPT (SA mean = 4.26, mean people cooked for during KPT= 5.07, p=0.000), we could therefore expect that many households might have been affected in this way, and although they did not show up as outliers, they could be contributing to an overall elevation of the mean kg/SA/day. However as this increase is most likely to be randomly spread across all stove groups, it is unlikely to be causing any bias and distorting of comparative results. Considering this and the fact that the results in these three households do not look like an error, it is recommended that they are not removed and the kg/SA/day presented in Table 6 are taken as the final fuel consumption estimates. 3.3 Household Air Pollution and personal exposure 3.3.1 Household air pollution The kitchen concentrations of PM2.5 and CO are reported in Table 7. This limited data “snapshot” shows that kitchen concentrations in all the homes with intervention stoves were lower than those recorded in the two traditional stove households. This exploratory data should be seen only as an indicative pilot, however, as there is only one household per stove type (two in the traditional stove group). Without a larger sample size, the comparison of household air pollution levels can be misleading, as many of the factors that affect pollution levels vary from home to home. Factors include ventilation rates, the size and type of kitchen, the mix of stoves and fuels used, the number of people cooked for, lighting, and other indoor sources of pollution, such as incense and cigarettes. Table 7: Mean 24-hour air pollutant concentrations in the kitchen. Prepared by Berkeley Air Monitoring Group July 2013 20
Bangladesh Stove Trial: Winrock International, WASHPlus and FHI 360

                                        PM2.5               CO
                                        (µg/m3)             (ppm)
         Traditional stove_1            11,017              31.5
         Traditional stove_2            2737                14.1
         EcoZoom Dura                   1744                2.8
         Prakti                         626                 9.1
         Eco Chula                      2587                7.8
         Envirofit Z3000                1343                0.9
         Greenway Smart Stove           1472                3.2

3.3.2      Personal exposure monitoring

The mean 24-hour CO exposure concentrations for the women and children are reported in Table
8. All women’s exposure levels were low, between 0.4 and 1.9 ppm CO, and the child exposures
were even lower, between 0.2 and 0.7 ppm CO. As with the household air pollution monitoring,
there was only one exposure measure per stove type (two in the traditional stove group), thus this
data can only be seen as providing indicative, pilot information. Comparing exposure levels is
even more complicated than comparing kitchen air pollution levels, as not only are exposure
levels affected by all of the kitchen factors, but also where and when the participants spend their
time throughout the monitoring period and the air pollution levels associated with those areas.

Table 8: Mean 24-hour exposure of woman and child.

                                                                         CO woman1   CO child2
                                 Description of kitchen
                                                                         (ppm)       (ppm)

    Traditional stove_1          Separate building to house/ enclosed    0.9         0.7

    Traditional stove_2          Separate building to house/ enclosed    0.5         0.4

    EcoZoom Dura                 Enclosed room in main house             1.6         0.7

    Prakti                       Separate room in main house/enclosed    0.6         0.4

    Eco Chula                    Separate room in main house/enclosed    0.6         No child

    Envirofit Z3000              Separate room in main house/semi-open   1.9         0.2
    Greenway Smart
                                 Separate building to house/ semi-open   0.4         0.2
    Stove
    1-     Reading taken from GasBadge Pro
    2-     Reading taken from Drager carbon monoxide diffusion tubes

Prepared by Berkeley Air Monitoring Group
July 2013                                                                                        21
Bangladesh Stove Trial: Winrock International, WASHPlus and FHI 360 3.3.3 Compliance with equipment There was a high level of compliance with wearing the monitoring equipment. All women were wearing the GasBadge Pro and the Drager carbon monoxide diffusion tubes when the field team arrived at the home, and all claimed to have worn it for the full duration of the 24-hour monitoring period. Additionally, all children monitored were wearing the diffusion tube on arrival, and the mother reported that they had worn it for the full duration of the monitoring period. 3.4 Stove perceptions Collection of information on the users’ perceptions of the intervention stoves was not a key outcome for this component of the research activities. However, the fieldworkers documented interesting and useful information given to them during casual conversations with the participants. The most frequently reported perceptions are presented by intervention stove in the Table 9 below. Prepared by Berkeley Air Monitoring Group July 2013 22
Bangladesh Stove Trial: Winrock International, WASHPlus and FHI 360

Table 9: Perceptions of the intervention stove provided on an informal basis.

Stove used        Feedback/issues raised

EcoZoom            • Would have liked it to be a bigger size so that it could take larger pots and cook more food.
Dura               • It was felt that cooking takes longer with the EcoZoom stove.
                   • There was some difficulty in cutting the wood to use on the stove.

Prakti             • Several homes reported that they could not get sufficient heat from the second burner. One
                     noted “better that both mouth of the stove have same heat”
                   • The stove was described as too small to be able to cook all of the food easily with one
                     household saying “Stove uses regularly; Stove size is not enough for heavy meal”
                   • Some households felt the stove would be helpful to them and they felt ‘good to use’ it.
                   • Increase in cooking time when using the Prakti was reported by some.

Eco Chula          • The need to prepare wood in small pieces was the most frequently reported disadvantage with
                     the Eco Chula.
                   • As with other stoves some households some participants felt they could cook less food on the
                     Eco Chula compared to their traditional stove.
                   • One household did say that “She is happy to cook with this stove”

Envirofit          • There was some mixed report from the homes using Envirofit. Some homes reported using
Z3000                less wood while others reported more wood fuel was required compared to the traditional
                     stove.
                   • There was more agreement in that their cooking took longer on this stove compared to their
                     traditional stove.
                   • One participant reported “This stove cooks well but need stand”. [Note: We believe this is
                     referring to a fuel support]

Greenway           • Some participants felt that they can cook less food on the Greenways compared to their
Smart stove          traditional stove “Main hole of this stove is very small it is very difficult to cook more”. One
                     home used the “intervention stove for light cooking; stove for heavy meal cooking required”
                   •   “Heavy smoke” was reported on lighting the stove in one home.
                   • One participant was reporting to be cooking regularly with the stove and was “feeling happy”.

The reoccurring perception that the stove was not large enough to meet all of the cooking
requirements was also a theme that came out during the wider qualitative study using the TIPs
(Trials of Improved Practices) methodology.

3.4.1    Reasons for refusals to take part in KPT

Three households selected to take part in the KPT monitoring refused to participate. All were
located in Barisal. The reasons given for refusal provide some further insight into user
perceptions and fuel use patterns in these communities.

Prepared by Berkeley Air Monitoring Group
July 2013                                                                                                            23
Bangladesh Stove Trial: Winrock International, WASHPlus and FHI 360 “Not enough space for two pot on the Prakti - too much time to cook with Prakti - also takes a lot of time to clean the ash out - has a child and does not want to deal with Prakti - takes too much time to cook / maintain” [Prakti Stove] “Takes too long to cook on, a lot of smoke - too much fuel - very difficult to light - does not have patience for this stove” [Greenway Smart stove.] “House does not use wood - use leaves and sawdust” [Eco Chula] 4 Discussion 4.1 Study limitations There are several factors that should be considered when interpreting these results. Sample sizes One of the strengths of this study is its relatively broad scope, assessing 6 stoves in 2 regions of the country, and thus building a knowledge base about household energy that is widely relevant across Bangladesh. This wide-angle view is particularly appropriate for the type of formative programmatic investigation that WASHplus has undertaken in Bangladesh. In fact, with limited resources, it could be argued that funding larger sample sizes for the assessment of cookstoves that have not yet been accepted by the local population would be irresponsible. Nevertheless, the limitations of this broad approach are evident in the current results, which did not result in any statistically significant differences between the fuel consumption in the homes with and without the intervention stoves. This fact is telling in its own right because it suggests that the intervention stoves were not performing well under these typical Bangladeshi household conditions, especially when compared to lab test results. The sample size calculations were based on a minimum fuel savings of 35% over the traditional stove, which was clearly not achieved in the majority of homes. Impact of fuel mixing Results from the wider qualitative survey suggest that there is typically extensive use of leaves for cooking fuel during the time of year during which the KPTs were conducted. Many households burn this fuel in ‘leaf-burning mud stoves’ that they construct outside in the open courtyard. This could have potentially influenced the extent and nature of wood fuel consumption in both the control and intervention stove households. However it is reported that the KPT team did not see many houses using leaves during the three days of the KPT monitoring. The team weighed the leaves whenever the household used them, whether used in their outside stove or in the traditional stove in their house. 12 of the 134 total households had leaves weighed during the KPT, and all 12 of these households were in Barisal. This fact is in line with the field team reports that leaves are used as a cooking fuel in addition to wood in Barisal due to the abundance of trees at that location, while in Sylhet, where trees are Prepared by Berkeley Air Monitoring Group July 2013 24
Bangladesh Stove Trial: Winrock International, WASHPlus and FHI 360

less abundant, leaf use was much less common. Only one of these 12 leaf-using households was
a control household.
It is possible that some degree of leaf use was not measured during the KPT. Any time a fuel is
both procured and used in between the daily field worker visits, it is very difficult to quantify its
use during a KPT. We do not, however, have any strong evidence to indicate that this occurred
for leaves in this KPT or that it occurred more so for leaves than for wood (e.g. small sticks and
twigs). Also this ‘leakage’ in the measurement of leaves is likely to have had a similar impact
across all stove groups including the control households.
The intervention stoves use only wood fuel and do not function well with leaves. Some
households in Barisal reported to be using wood during the KPT when they would normally be
using leaves for some or possibly all of their cooking at this time of year and found this to be a
disadvantage of the intervention stove.
 One surveyor noted, “[Cook reports] regular use [of] this stove but she feel unhappy to use
 fuel wood in dry season.” Another noted that one home had restricted their use of the
 intervention stove as it did not use leaves: “She prepares breakfast and lunch in the
 traditional stove with leaf and only dinner prepare with Prakti.”
This suggests that families who shifted their cooking to the intervention stoves depended more
heavily on wood fuel than they normally would have if they only had access to their traditional
stove with a leaf/wood combination. However, this shift to wood fuel is only likely to have
occurred in Barisal, as leaf use appeared to be minimal in Sylhet. Furthermore, some intervention
stove households in Barisal did continue to use leaves in their traditional stove. Finally, as only
one control household had leaves weighed during the KPT, it suggests that the controls might
have also shifted to using more wood in some way during the KPT.
There is also the possibility that the process of monitoring influenced the way the households
used their stoves and fuels (known as the observer-expectancy effect). If the control households
perceived the main focus of the KPT to be wood fuel (even though they had been asked to show
all fuels to be weighed), they could have altered their habits to use more wood and less leaves for
the period of the KPT. The SUMS data supports this hypothesis in that there was a reduction in
traditional stove use in the control households after the end of the KPT monitoring. This suggests
that the may have moved from the traditional wood burning stove, which had the SUMS unit
placed on it, to the leaf burning stove that did not get monitored due to fears of security issues as
the stove was located outside. Or, they may have had more stove use during the KPT than is their
typical practice.
Barisal had the higher wood fuel consumption and the greater use of leaves in this KPT
compared to Sylhet, which might suggest that leaves are complementary rather than a
replacement fuel. The extent to which leaf use reduces wood use is not clear.

Prepared by Berkeley Air Monitoring Group
July 2013                                                                                         25
Bangladesh Stove Trial: Winrock International, WASHPlus and FHI 360

It is likely there was some shift from leaves to wood in both intervention and control homes in
Barisal and less so (if at all) in Sylhet during the period of the KPT monitoring. We cannot,
however, be certain of the extent of this shift and, therefore, how it might impact wood fuel
consumption in the new stove households relative to the traditional stoves, if at all. Any shift
from leaves to wood use likely occurred similarly across all of the intervention stove groups and
thus would exert a similar effect on each group. It is therefore unlikely that there is a large effect
on the differences in wood fuel consumption between the traditional stove households and the
intervention stove households as a result of fuel mixing.
Envirofit stove results
Data from the households with the Envirofit stove suggested higher fuel consumption than in the
control households using traditional stoves.
As described in Section 3.2 two outliers were identified in this group. Outliers are defined as data
points that are greater than 1.5 times the inter-quartile range (IQR) from the third (75th) quartile,
and those that are 3 times the IQR are deemed to be extreme outliers. The data from these
outliers were investigated to establish if the results were in fact erroneous. As Section 3.2
outlined, this was not found to be the case and the data looked consistent and within the bounds
of reasonable fuel consumption for this population. In view of the fact that the outliers are not
considered to be ‘extreme’ and without any evidence to show that these households had any
unique characteristics to suggest they were not representative of this selected population, it was
decided to include these households in the analysis.
However, there are factors that should be considered when interpreting these results. The sample
sizes for each individual stove group are relatively small (n=24 for the Envirofit stove). Outliers
such as those seen in the Envirofit stove group (and to a lesser extent the Prakti stove group) can
have an influence on the estimated sample mean when the sample size is small. It is possible that
a mean from a larger group might not have been so influenced by extreme values.
Although the stove allocation was random, it could be that the Envirofit group included two
households that were high users of wood and would continue to be such regardless of the stove
type used. However, this can only be investigated and subsequently controlled for by using a
paired / before and after study design.

4.2 Comparison to stove performance standards
Although there are not yet any globally accepted stove performance standards, an ISO
International Workshop Agreement for cookstove performance was agreed in 2012. The IWA
provides a system for categorizing stoves based on several performance metrics, including two
metrics related to efficiency, from tier 0 representing traditional stoves to tier 4 representing
aspirational gas technologies. Currently, however, the IWA tiers only provide comparative
classification for stoves based on lab tests.

Prepared by Berkeley Air Monitoring Group
July 2013                                                                                           26
Bangladesh Stove Trial: Winrock International, WASHPlus and FHI 360

All of the stoves selected for this study had achieved a tier 2 or higher rating for their efficiency
metrics in the laboratory. And all of the stoves except the Envirofit Z3000 showed reductions
(though not statistically significant) in wood fuel consumption compared to the traditional stoves
in the field. While it is not yet possible to compare the field performance results using the IWA
structure, it is fair to say that the fuel savings were not as strong in the field as in the lab.

4.3 Comparison to household air pollution health standards
The pilot measurement of health-related household air pollution concentrations and exposures
suggested that all of the intervention stoves were reducing harmful emissions of CO and PM2.5.
The 24-hour PM2.5 levels were, however, still several fold higher than the World Health
Organization (WHO) annual interim-I guideline of 35 µg/m3 (WHO, 2006). Three of the five
intervention stove homes achieved 24-hour CO levels below the WHO 24-hour guideline of 6
ppm (WHO, 2010) and two nearly achieved that level, with the traditional stove homes
averaging 22.8 ppm.

The personal exposure measurements suggested cookstove emissions might not be a dominant
source of CO exposure for Bangladeshi women and their young children. All women’s exposure
levels were low, between 0.4 and 1.9 ppm CO, and the child exposures were even lower,
between 0.2 and 0.7 ppm CO. All were well below the WHO 24-hour guideline of 6 ppm (WHO,
2010). It is much more challenging to measure personal exposure to particulates, and these
measurements were not attempted for this study, even though they would be relevant, as
Bangladesh has a high rate of respiratory infections and other diseases related to household air
pollution.

These preliminary health-related measurements in combination with the usage data suggest that
an in-depth study of indoor air pollution concentrations and exposure could be worthwhile if an
improved wood-stove was found to perform well in field tests and displace a substantial fraction
of traditional stove cooking. In this case, it would be important to invest the resources necessary
to measure exposure to particulate matter.

4.4 Future study considerations
Questions remain regarding the nature and extent of the leaf use in these communities at the time
of year the study was conducted and the level of impact this might have had on the use of the
intervention stove and the wood fuel consumption. One way to resolve these questions would be
to conduct a similar study outside the 2-month period when leaves are available as a cooking
fuel.

Prepared by Berkeley Air Monitoring Group
July 2013                                                                                         27
Bangladesh Stove Trial: Winrock International, WASHPlus and FHI 360

It would also be valuable to add a truly aspirational stove to this study, even if it is not affordable
or viable in the marketplace, in order to provide a solid reference point for a high level of
adoption and usage.

5 References
Bailis, R. et al., 2007. Performance testing for monitoring improved biomass stove interventions:
experiences of the Household Energy and Health project. Energy for Sustainable Development,
11(2), pp.57–70.

Smith, K.R. et al., 2007. Monitoring and evaluation of improved biomass cookstove programs for
indoor air quality and stove performance: conclusions from the Household Energy and Health
Project. Energy for Sustainable Development, 11(2), pp.5–18.

WHO, 2006. WHO guidelines for particulate matter, ozone, nitrogen dioxide and sulfur dioxide
(Geneva: World Health Organization Press).

WHO, 2008. Evaluating household energy and health interventions: a catalogue of methods, World
Health Organization. Available at: http://www.who.int/indoorair/publications/methods/en/index.html.

WHO, 2010. WHO guidelines for indoor air quality: selected pollutants (Bonn: World Health
Organization Regional Office for Europe).

Prepared by Berkeley Air Monitoring Group
July 2013                                                                                           28
Bangladesh Stove Trial: Winrock International, WASHPlus and FHI 360

6 Appendices

     Fuel Consumption Survey: Bangladesh
  A. Background Information: Visit #1
A1.Date (dd-mm-yy)                                                      A2 Time (hh:mm) (24hr time)

A3. Surveyor ID 1        2     3    4     5        6   7      8    9    A4. Household ID

A5. Study      1.Traditional        2. EcoZoom                                                  5.Envirofit        6. Greenway
                                                           3. Prakti          4. Eco Chula
Group          stove                Dura                                                        Z3000              Smart Stove
A6. IAP measurement household?            1. Yes           2. No        A7. Study location. 1. Barisal    2. Sylhet

A8. Name of main cook                                                   A9. Telephone number

A10. Address
A11. Primary stove type [Note this is the stove the household was using most of the time before receiving the intervention stove]:
1. Traditional wood burning chula             2.
A12. Secondary stoves: [Note this any other stove the household was using at least once per week before receiving the
intervention stove- please circle as many as apply]
3. Charcoal         4. LPG          5. Paraffin            6. Other_____________

A13. Photos:      House______ Kitchen______                 Stove1______      Stove 2_____    Stove3______

A14. How many people eat in this household normally per day?

A15. # of children of age 14 or younger in home?                       A16. # of females of age 15 and older in home?

A17. # of men aged 15-59 years in home?                                A18. # of men above 59 years in home?

B. Seasonal patterns: Visit #1
B1. Do you currently use more, less           1= More [answer B2]
or the same amount of wood fuel
per day as you do at other times of           2= Less [answer B3]
the year?                                     3= Same [Go to C1]
B2. For what reasons do you                   1= To heat the room(s)
currently use more wood fuel at this          2= The wood is wet
time of year?
                                              3= Cook different types of food
                                              4= Cook for more people
                                              5= There is no/little agricultural residue
                                              6=Other please describe:_________________________________________
B3. For what reasons do you                   1= Do not need to heat room(s)
currently use less wood fuel at this          2= The wood is dry
time of year?
                                              3= Cook different types of food
                                              4= Cook for less people
                                              5= There are agricultural residues
                                              6=Other please describe:_________________________________________
C. Fuel measurements: Visit #1

Prepared by Berkeley Air Monitoring Group
July 2013                                                                                                                      29
Bangladesh Stove Trial: Winrock International, WASHPlus and FHI 360
C1. New charcoal total (kg) C2. New wood total (kg)
C3. New LPG total (kg) C4. New paraffin total (kg)
C5. New crop residues (kg) C6. New dung (kg)
C7. New ‘dung stick’ (kg)
C8. Wood moisture sample 1 a) Reading 1 b) Reading 2 c) Reading 3
C9. Wood moisture sample 2 a) Reading 1 b) Reading 2 c) Reading 3
C10. Wood moisture sample 3 a) Reading 1 b) Reading 2 c) Reading 3
C11. Crop moisture sample 1 a) Reading 1 b) Reading 2 c) Reading 3
C12. Crop moisture sample 2 a) Reading 1 b) Reading 2 c) Reading 3
C13 Crop moisture sample 3 a) Reading 1 b) Reading 2 c) Reading 3
D. SUMS Monitor: Visit #1
D1. How many SUMS ibuttons in total are placed in this household?
Please fully describe the location of all of the stove SUMS monitors so they can be easily located on the next
visit.
SUMS 1
D2
SUMS 2
SUMS 3
Please fully describe the location of the ambient air SUMS monitor so it can be easily located on the next visit.
D3
D4.Notes/ observations from visit 1.
Visit #2 Household ID__________ Name of main cook_____________
E1. Date (dd-mm-yy) E2.Time (hh:mm) E3.Surveyor ID: 1 2 3 4 5 6 7 8 9
E4. Unused charcoal total (kg) E5. Unused wood total (kg)
E6.Unused LPG total (kg) E7. Unused paraffin total (kg)
E8. Unused crop residues E9. Unused dung
E10. Unused ‘dung stick’ (kg)
E11. New charcoal total (kg) E12. New wood total (kg)
Prepared by Berkeley Air Monitoring Group
July 2013 30You can also read