The Splashing of Melt upon the Impact of Water Droplets and Jets
←
→
Page content transcription
If your browser does not render page correctly, please read the page content below
applied
              sciences
Article
The Splashing of Melt upon the Impact of Water Droplets
and Jets
Sergey E. Yakush * , Yuli D. Chashechkin, Andrey Y. Ilinykh and Vladislav A. Usanov

                                          Ishlinsky Institute for Problems in Mechanics RAS, 119526 Moscow, Russia; chakin@ipmnet.ru (Y.D.C.);
                                          ilynykh@ipmnet.ru (A.Y.I.); usanovmpei@gmail.com (V.A.U.)
                                          * Correspondence: yakush@ipmnet.ru; Tel.: +7-(495)-434-95-25

                                          Featured Application: Nuclear safety, stratified steam explosion.

                                          Abstract: Small-scale experimental studies of melt splashing upon the impact of water are presented
                                          here, with a focus on the fluid dynamics and thermal aspects of these interactions. Gravity-accelerated
                                          droplets and forced short-duration water jets interacted with liquid Rose’s alloy superheated to
                                          100–200 degrees above its melting point. A repeatability study was performed for better-control of
                                          the gravity fall of a droplet. The amount of perturbation on the melt surface was obtained from a
                                          video recording, and indicated the existence of three principal stages of interaction. The cases using
                                          the forced water jet demonstrated the occurrence of a cumulative jet of melt following the collapse
                                          of the cavity caused by the water impact. Also, it was shown that numerous small-diameter melt
                                          droplets were scattered by the primary impulse, and small-scale micro-eruptions were observed,
                                          which generated small but fast melt droplets at the later stages of interaction.

                                          Keywords: splashing; melt–water interaction; droplet impact; jet impact; cumulative jet


Citation: Yakush, S.E.;                   1. Introduction
Chashechkin, Y.D.; Ilinykh, A.Y.;
                                                Melt–water interaction is encountered in nature and in many areas of engineering,
Usanov, V.A. The Splashing of Melt
                                          including nuclear safety, the smelting industry, volcanology, etc. The rapid phase transition
upon the Impact of Water Droplets
                                          that occurs upon the contact of a hot molten material with a temperature above the boiling
and Jets. Appl. Sci. 2021, 11, 909.
                                          point of a liquid coolant produces rapidly propagating pressure waves, known as steam
https://doi.org/10.3390/app11030909
                                          (or vapor) explosions [1]. This is one of the major sources of danger associated with severe
                                          accidents at nuclear power plants with light water reactors where the molten core and
Received: 29 December 2020
Accepted: 18 January 2021
                                          structural materials form a metal-oxide mixture known as corium, which can flow at
Published: 20 January 2021
                                          temperatures as high as 3000 K and have contact with water, either in the lower plenum of
                                          the reactor vessel or in an external water pool. In the steam explosion wave, fragmentation
Publisher’s Note: MDPI stays neutral
                                          of the liquid melt occurs, which dramatically increases the melt–water surface area and
with regard to jurisdictional claims in
                                          heat transfer characteristics, thus accelerating the conversion of the thermal energy stored
published maps and institutional affil-   in the melt into the mechanical energy of the vapor expansion and coolant acceleration.
iations.                                        Research into the topic of steam explosion spans several decades, and the key processes
                                          governing this phenomenon have been established. In particular, it was found that for
                                          a powerful steam explosion to occur, some premixing of the coarsely fragmented melt,
                                          coolant, and vapor (which exists as a vapor film separating the melt from coolant or as
Copyright: © 2021 by the authors.
                                          a separate phase) must be present, thus creating the pre-requisites for propagation of a
Licensee MDPI, Basel, Switzerland.
                                          self-sustained steam explosion wave. When the melt is released due to a vessel breach as
This article is an open access article
                                          a jet into a deep enough water pool, this premixing occurs naturally due to the melt jet
distributed under the terms and           fragmentation. This is governed by various types of instability and interaction mechanisms,
conditions of the Creative Commons        as demonstrated by many integral tests performed worldwide (KROTOS [2], FARO [3],
Attribution (CC BY) license (https://     TROI [4]). However, it was demonstrated recently by PULiMS and SES experiments [5] that
creativecommons.org/licenses/by/          powerful steam explosions can also occur in the stratified configuration, where the melt
4.0/).                                    spreads over the bottom of a shallow enough water pool. Therefore, an important question

Appl. Sci. 2021, 11, 909. https://doi.org/10.3390/app11030909                                                https://www.mdpi.com/journal/applsci
Appl. Sci. 2021, 11, 909                                                                                             2 of 16

                           arises with regard to the mechanisms governing the melt–water premixing in this seemingly
                           stable, stratified, flow with the heavy melt layer located under an of order-of-magnitude
                           less dense water.
                                  A hypothesis on the possible mechanisms for the premixing was proposed in [5] on
                           the basis of experimental observations of melt spreading prior to a steam explosion. It was
                           observed that hot melt did not spread as a smooth layer, rather, quite intensive sporadic
                           melt splashes were observed, which formed a dynamically existing premixing layer above
                           the average melt surface. An idea suggested in [5] was that the melt splashes could be
                           caused by the impact of cumulative water jets generated by the collapse of vapor bubbles
                           in subcooled water, which were observed intermittently near the melt–water interface.
                                  While independent confirmation of the feasibility and efficiency of this mechanism is
                           still a matter of ongoing study (e.g., theoretical estimates of the water energy and impulse
                           that develop upon the collapse of a hot vapor bubble in subcooled water were performed
                           in [6]), the problem of the impact of water on the melt surface is interesting in itself, both
                           from a fundamental and an applied point of view.
                                  Droplet impact on a liquid surface is a classical research topic [7–9] that can be
                           approached from the perspective of fluid dynamics, thermodynamics, and surface physics
                           because it provides an example of a simple, yet phenomena-rich interaction. It is known
                           that the collision of a drop with a liquid surface can involve different regimes, including
                           floating, bouncing, coalescence or splashing [9]. A characteristic feature of the splashing
                           regime, where the surface of the pool liquid is significantly disturbed, is the formation of a
                           deep crater with a crown-like cylindrical liquid film ejected from its rim (e.g., [10]). Also, in
                           this regime, the so-called Rayleigh [11] or Worthington [7,8] central jet, or a liquid column
                           rising above the center of the crater is formed after impact (also called a cumulative jet in
                           Russian literature). The boundaries between different regimes have been researched by
                           many authors in terms of the primary non-dimensional parameters, the Weber number,
                           We = ρu2 D/σ, and the Froude number Fr = u2 /gD, where ρ and σ are the density and
                           surface tension of the liquid droplet, D is the droplet diameter, and u is the impact velocity.
                           A large amount of experimental data indicate that droplet bouncing and coalescence occur
                           for low Weber and Froude numbers, whereas splashing occurs at high values, see review
                           in [12]. The total coalescence, rebound and fast partial bounce regimes of free-falling droplet
                           interaction with the receiving liquid were studied experimentally in [13]. For high impact
                           velocities, numerous fine droplets (spray) are formed including multiple splashes [14].
                           Experiments have also shown that sometimes a large bubble becomes entrapped when the
                           crown closes at the top [10,12].
                                  In addition to finding the regime boundaries, experimental studies and numerical sim-
                           ulations have revealed the fine details of the droplet-pool interaction in different regimes.
                           Cavity development in a shallow liquid pool upon droplet impact was studied numerically
                           by the VOF method in [15] in conditions where the cavity depth was comparable to the
                           thickness of the liquid layer. For example, in the work of [16,17], the material distribution
                           on the cavity surface and in the crown was studied by using contrasting droplet (ink-
                           colored) and pool (transparent) liquids. It was shown that complex net-like patterns tend to
                           develop on the cavity surface; also, the material distribution in the central jet was shown to
                           be highly non-uniform. Note that most of the studies were performed in isothermal condi-
                           tions, with various miscible and immiscible liquids: water–water and water–oil pairs [7–17],
                           liquid metal [18,19], and a distilled water, silicone oil and glycerine–water mixture [20], so
                           that the densities of the impacting and receiving liquids were either identical, or did not
                           differ substantially.
                                  The interaction of droplets with solid surfaces is another closely related area that
                           focuses on drop impingement, in particular with hot (i.e., the temperature is above the
                           boiling point of the droplet liquid) surfaces. This avenue of research is mostly driven by the
                           problems of the spray cooling of surfaces, heat treatment of alloys and other engineering
                           applications [21]. Of particular interest are the effects of surface wettability [22], heat
                           transfer characteristics and the effects of surface texturing [23,24]. It was found that droplet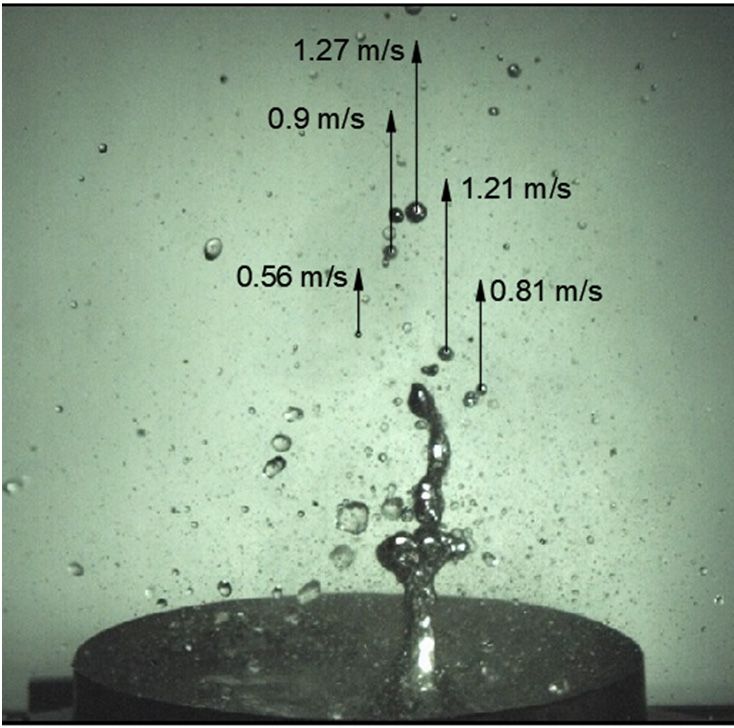
Appl. Sci. 2021, 11, 909                                                                                            3 of 16

                           disintegration into fine spray is governed either by fluid dynamic mechanisms, or by
                           bubble formation upon contact with an overheated surface. Note that in all similar studies,
                           only one fluid is involved, and therefore, the spray measurements were performed for the
                           droplets of impacting liquid.
                                 Analysis of the literature on droplet impingement shows that little attention has been
                           paid so far to the interaction of liquid droplets with a pool comprised of another liquid
                           with a significantly different temperature and density. There is a gap between the studies
                           on liquid splashing, which are mostly performed under isothermal conditions and for
                           density ratios that are close to unity, and studies on droplet impingement on overheated
                           solid surfaces. However, for the research mentioned above (the formation of a premixed
                           zone as a pre-requisite for stratified steam explosion), of particular interest is the splashing
                           of a heavy, high-temperature melt that occurs upon the impingement of another liquid
                           with a boiling temperature below the melt temperature. This problem cannot be reduced
                           to either of the two cases, and it requires special studies.
                                 The current work aims at filling this knowledge gap by presenting the experimental
                           results for the splashing of melt caused by the impact of a more volatile liquid. Melt
                           splashing was studied at the laboratory scale by dropping small (1 mL or less) water
                           volumes (either as free-falling drops, or forced short-duration jets) on the surface of molten
                           Rose’s alloy. The characteristic density ratio between the impacting and pool liquids is
                           about 1:9, which cannot be reproduced in isothermal experiments (water–water, water–oil
                           etc.) or with cryogenic liquids (freon, liquid nitrogen, etc.) interacting with water. Note also
                           that such separate-effect experiments are useful for revealing the fine, fundamental details
                           of the interactions, which remain obscured or unclear in larger-scale integral tests, like [5].

                           2. Experimental Setup
                                The experiments were setup in a laboratory that is part of the GFK facility operated in
                           IPMech RAS. This facility has been used before to perform numerous high-resolution tests
                           on water–water and water–oil interactions under isothermal conditions [13,14], including
                           studies on the material redistribution of the droplet and receiving (target) liquid [16,17], as
                           well as on the acoustic effects and high-speed streamers that develop due to the droplet
                           impact [25]. In the current work, the facility was modified so that it was able to handle high-
                           temperature materials. The experimental setup is presented in Figure 1. The molten Rose’s
                           alloy was used as the working high-temperature fluid; its properties are listed in Table 1.
                           The alloy was melted in a cylindrical vessel of 84 mm diameter and 23 mm height, which
                           was heated electrically from below by a 2 kW heater. The melt was heated to temperatures
                           of 200–300 ◦ C, which superheated it to 100–200 degrees above its melting point, as well
                           as above the normal boiling point of water (because the latter two temperatures are quite
                           close, see Table 1).
                                Water delivery was performed in two ways. The first was as a droplet falling under
                           gravity from a fixed height of 0.58 m. This height was chosen because previous isothermal
                           tests have shown that the height of the cumulative jet was the highest; the higher initial
                           positions of the droplet were not used in the experiments because the droplet became un-
                           stable and fragmented prior to impacting the surface. Smaller heights were also discarded
                           because the impact of the droplet on the heavy melt was too weak to cause any significant
                           perturbations. The droplets were formed by slow water delivery from a thin syringe needle;
                           the droplet was of a nearly-spherical shape due to the effect of surface tension, and grew to
                           a diameter of 4.2 mm, after which it detached naturally from
                                                                                      p the needle without any initial
                           velocity. The free-fall velocity for the above height was 2gh = 3.37 m/s, and the water
                           volume was 0.0388 mL.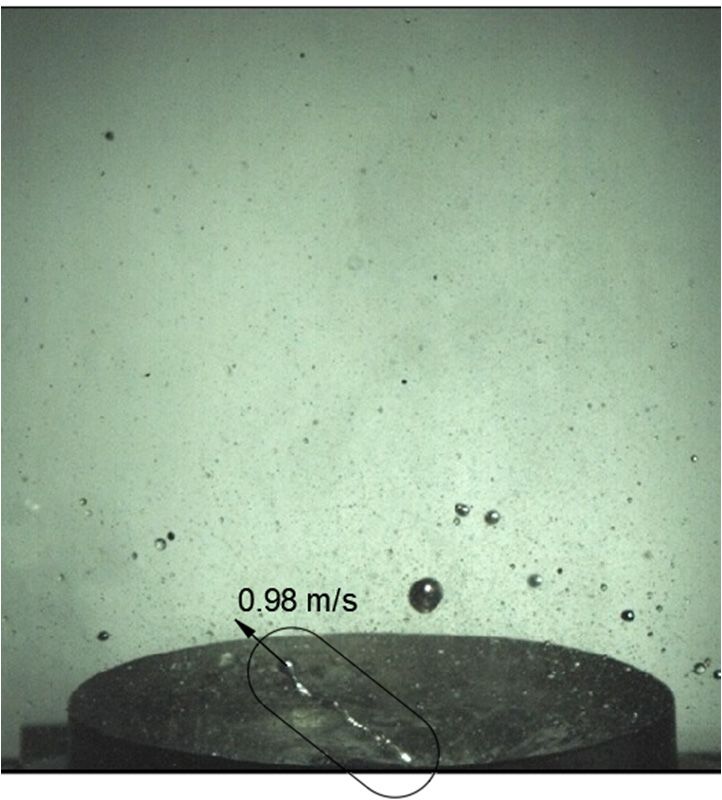
Appl. Sci. 2021, 11, x FOR PEER REVIEW 4 of 16
needle without any initial velocity. The free-fall velocity for the above height was
Appl. Sci. 2021, 11, 909 4 of 16
2 gh = 3.37 m/s, and the water volume was 0.0388 mL.
Figure1.1.Experimental
Figure Experimentalfacility:
facility: 1—computer,
1—computer,2—injector,
2—injector,3—heater,
3—heater,4—reservoir,
4—reservoir,5—camera
5 –cameraOptro-
Op-
tronis CR3000x2, 6—light sources, 7—fume hood, 8—screens, 9—tripods.
nis CR3000x2, 6—light sources, 7—fume hood, 8—screens, 9—tripods.
Table 1. Properties of Rose’s alloy [26,27].
Table 1. Properties of Rose’s alloy [26,27].
Property Value
Property Value
Composition Sn—25%, Pb—25%, Bi—50%
Composition Sn—25%, Pb—25%, Bi—50%
Melting temperature 94 °C ◦
Melting temperature 94 C
Density
Density 97209720
kg/m 3
kg/m3
Specific heat heat
Specific capacity
capacity 0.1470.147
kJ/(kg·K)
kJ/(kg·K)
Thermal conductivity
Thermal conductivity 16.3 W/(m·K)
16.3 W/(m·K)
SurfaceSurface tension
tension 410 mN/m
410 mN/m
Thesecond
The secondtypetypeof ofwater
waterdelivery
deliverywas wasfrom
fromaasyringe
syringewith withthe theneedle
needleremoved;
removed;the the
nozzlediameter
nozzle diameterwas was0.3 0.3cm.
cm. In Inthis
thiscase,
case,water
waterwas wasdelivered
deliveredfrom fromaasmall smallheight
height(about
(about
100mm
100 mmabove
abovethe thesurface),
surface),thus thusforming
formingaaforcedforcedshort-duration
short-durationjet. jet.Delivery
Deliveryfrom fromlarger
larger
heightsresulted
heights resultedininsignificant
significantjetjetfragmentation,
fragmentation, soso that
that water
water reached
reached thethe surface
surface almost
almost as
aasspray
a spray rather
rather thanthan a coherent
a coherent jet. water
jet. The The water velocity
velocity prior toprior
the to the impact
impact was inwas in the
the range
of 3–11of
range m/s,
3–11the volume
m/s, of water
the volume was controlled
of water and setand
was controlled to 1setmL.
to 1 mL.
Video
Video recording
recording was wasperformed
performed using using an anOptronis
OptronisCR3000x2
CR3000x2camera cameraat atthe
theframe
frame
rate of 5000 fps
rate of 5000 fps for for water droplets and 3000 fps for water jets. The camera was located atata
water jets. The camera was located
adistance
distanceofof2525toto7575 cm from the impact
cm from the impact point, its linepoint, its line of view
of view was was inclined
inclined at an at angle
an angle
of 5
of
to 515todegrees
15 degrees withwith
respectrespect
to theto melt
the melt surface.
surface. All experiments
All experiments werewere recorded
recorded at a
at a fixed
fixed resolution
resolution of 800of 800
× 600 × 600 pixels
pixels in inthethe horizontaland
horizontal andvertical
vertical directions.
directions. Selected
Selected video
video
frames
frames arearepresented
presentedin inthe
thefollowing
followingsections;
sections;these
thesewereweretaken
takendirectly
directlyfromfromthe thevideo
video
sequence,
sequence, without
without any any scaling,
scaling, cropping
cropping etc. etc. The
The length
length scale
scale for
for each
eachvideo
videosequence
sequence
was
was determined by placing a test object (medical syringe needle of 0.8 mmdiameter
determined by placing a test object (medical syringe needle of 0.8 mm diameterand and
40
40mmmmlength)
length)above
above thetheexpected
expected impact
impactpoint priorprior
point to thetorelease of the water.
the release of the The frames
water. The
where
framesthe test object
where was
the test visible
object waswere usedwere
visible to calibrate
used tothe spatialthe
calibrate coordinates in Autodesk
spatial coordinates in
AutoCAD
Autodesk 2020 software,
AutoCAD 2020 after which the
software, frames
after which withthethe interaction
frames with were processed. were
the interaction
The impact velocity was obtained from the measurements of droplet (or impulse
processed.
jet) leading point velocity
The impact coordinates wason the video
obtained fromframes immediately preceding
the measurements of dropletthe (or water–melt
impulse jet)
contact. The purpose of the experiments performed
leading point coordinates on the video frames immediately preceding the was to establish the ability of water–melt
the impact
of
contact. The purpose of the experiments performed was to establish the ability ofhot
the water jet or droplet to cause noticeable perturbations and splashes of the heavier the
liquid,
impactas ofwell as to look
the water jet orfordroplet
the specific
to causeeffects resulting
noticeable from the phase
perturbations andtransitions
splashes ofand the
evaporation of a more volatile liquid.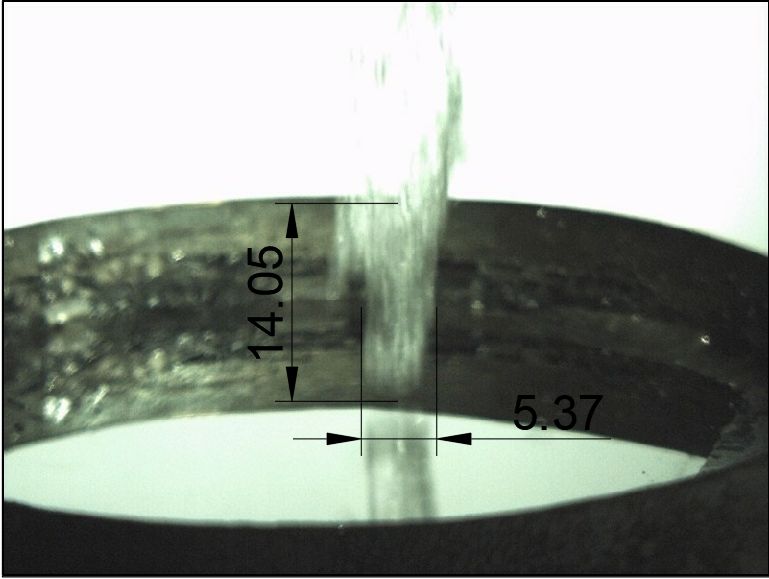
Appl. Sci. 2021, 11, 909                                                                                               5 of 16

                             3. Results
                             3.1. Impact of the Water Droplet
                                  Table 2 summarizes the results from the experiments with the water droplet falling
                             on the molten Rose’s alloy surface. The droplet volume was very well controlled by the
                             experimental procedure of droplet generation, however, perturbations that developed
                             during the droplet’s fall in the air resulted in distortion of its spherical shape, and some
                             scatter was observed in the impact velocities. The pre-impact droplet size indicated in
                             Table 2 was measured as the horizontal droplet size visible on the last frame before the
                             droplet’s contact with the melt surface.

                              Table 2. Parameters of free-falling droplet impact experiments.

                                                     Pre-Impact Droplet
 Case      Drop Height, mm   Water Volume, mL                                  Impact Velocity, m/s   Melt Temperature, ◦ C
                                                          Size, mm
  D1                 58           0.0388                     4.56                       3.17                  200
  D2                 58           0.0388                     4.45                       3.08                  200
  D3                 58           0.0388                     4.48                        2.9                  200
  D4                 58           0.0388                     4.38                       3.46                  200
  D5                 58           0.0388                     3.95                       3.14                  200
  D6                 58           0.0388                     4.26                       3.05                  200
  D7                 58           0.0388                     4.03                       3.24                  200
  D8                 58           0.0388                     4.2                        3.45                  200
  D9                 58           0.0388                     4.04                        3.1                  280

                                   As the baseline case, Case D1 from Table 2 elucidates all the typical features of the
                             interaction observed in all the free-falling droplet experiments. After the droplet touches
                             the melt surface, it starts to disturb it so that a cavity develops, which is surrounded by
                             a circular “crown” into which the melt material is displaced. For each frame, the visible
                             diameter of the crown was obtained; for most of the frames, it was easily detected thanks
                             to the high contrast between the water (looking dark) and the melt (highly reflective).
                                   Along with the experimental photos, it is also useful to analyze the time dependence
                             of the crown diameter, which is presented in Figure 2; the time is plotted on the logarithmic
                             scale. Three distinct stages of cavity development can be seen in the graph, denoted by
                             the linear pieces of the plot, and separated by points A and B where the slope of the lines
                             changes abruptly. Note that once the cavity diameter d(t) is described by a linear function
                             in the coordinates of Figure 2, it can be represented by

                                                                d(t) = d0 log10 (t/t0 ) + d1 ,                            (1)

                             where d0 and d1 are characteristic diameters, and t0 is a characteristic time found for each
                             stage from the best fit of the experimental data. Since the radial velocity of the crown
                             top is v = dr/dt (where r = d/2), it follows from (1) that the cavity velocity decays
                             proportionately to d0 /t, and the constant in the velocity decay law changes abruptly
                             from one stage to another. The best-fit linear regression lines are shown in Figure 2 for
                             each stage, and they will be further discussed below in comparison with other water
                             impact experiments.
                                  The flow corresponding to each above-mentioned stage is shown in Figure 3; the field
                             of view in each frame is 26 × 17.5 mm and the resolution is 800 × 600 pixels. Immediately
                             after the droplet touches the hot melt, high-velocity water streamers are ejected from the
                             contact zone, almost parallel to the melt surface (Figure 3a). The video record clearly shows
                             that water boiling occurs on the water–melt interface, where small-scale bubbles are seen
                             (Figure 3b). It is not clear from the video if a continuous vapor film is formed to completely
                             separate water from the melt, however, liquid water definitely remains in the cavity for
                             long time (Figure 3c–h).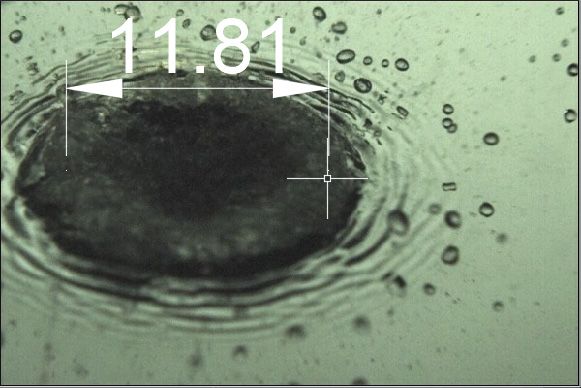
Appl. Sci. 2021, 11, x FOR PEER REVIEW 6 of 16
Appl.
Appl. Sci.2021,
Sci. 2021,11,
11,909
x FOR PEER REVIEW 6 of 16 16
6 of
16 (h)
16 (g) (h)
(g)
12
12 (c)
(b)
mm
(c) B (f )
8 (b)
d,d,mm
B (f )
8 A
(a) (e)
(a) A (d) (e)
4 (d)
4
0
0
0.1 1 10
0.1 1 10
t, ms
t, ms
Timedependence
Figure2.2.Time
Figure dependenceofofthe
thecavity
cavitydiameter
diameter (Case
(Case D1).
D1). Dots:
Dots: experimental
experimental data,
data, solid
solid line:line:
Figure 2. Time dependence of the cavity diameter (Case D1). Dots: experimental data, solid line:
approximation.
approximation.The
Thearrows
arrowsindicate
indicatethetheinstances
instancesshown
shown in
in Figure
Figure 3.
3.
approximation. The arrows indicate the instances shown in Figure 3.
(a)
(a) (b)
(b)
(с)
(с) (d)
(d)
(e) (f)
(e) (f)
(g) (h)
(g) (h)
Figure 3.
Figure 3. Snapshots
Snapshots of of Case
Case 11 video
video at
at the
theinstances
instancesindicated
indicatedininFigure
Figure2 2(the
(thedimensions
dimensions arearein in
Figure 3. Snapshots
millimeters). (a) of Case t1=video at
(c) the instances indicated in Figure 2 (the tdimensions (g)are in
millimeters). (a)t t==0 0ms;
ms;(b)(b) t1=ms;
1 ms; t(c)
= 2.8
t =ms;
2.8 (d)
ms;t (d)
= 6.2t ms;
= 6.2(e)ms;
t = 10
(e) ms;
t = (f) = 13.2
10 ms; (f) ms;
t = 13.2 t =ms;
millimeters).
15.4 ms; (h) t(a) t =ms.
= 20 0 ms; (b) t = 1 ms; (c) t = 2.8 ms; (d) t = 6.2 ms; (e) t = 10 ms; (f) t = 13.2 ms; (g) t =
(g) t = 15.4 ms; (h) t = 20 ms.
15.4 ms; (h) t = 20 ms.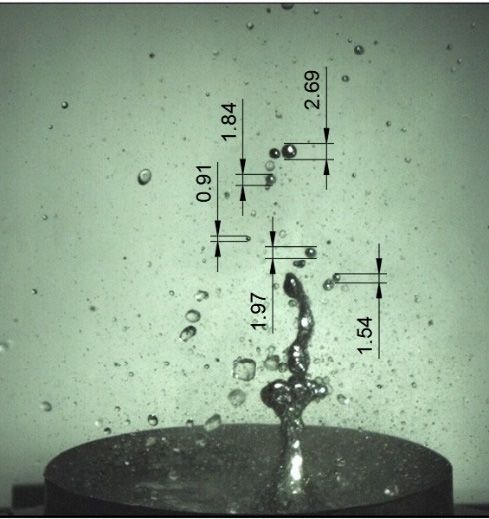
diately after the droplet touches the hot melt, high-velocity water streamers are ejected
from the contact zone, almost parallel to the melt surface (Figure 3a). The video record
clearly shows that water boiling occurs on the water–melt interface, where small-scale
bubbles are seen (Figure 3b). It is not clear from the video if a continuous vapor film is
Appl. Sci. 2021, 11, 909 formed to completely separate water from the melt, however, liquid water definitely 7 of 16
remains in the cavity for long time (Figure 3c–h).
The video frames shown in Figure 3 indicate that stage 1 of the process is mostly
The video
governed by theframes
impactshown
momentumin Figure 3 indicate
gained that stage
by the melt from the1 ofdroplet
the process is mostly
(Figure 3a–c).
governed by the impact momentum gained by the melt from the droplet (Figure 3a–c). The
The cavity rapidly increases in diameter, its edge (crown) remains sharp and easily de-
cavity rapidly increases in diameter, its edge (crown) remains sharp and easily detectable
tectable in the photos. In stage 2, however, the crown edge becomes thicker (Figure 3c–e).
in the photos. In stage 2, however, the crown edge becomes thicker (Figure 3c–e). It can be
It can be said that stage 2 corresponds to the transformation of the crown into the crest of
said that stage 2 corresponds to the transformation of the crown into the crest of a capillary
a capillary wave propagating radially at its own speed from the place where the interac-
wave propagating radially at its own speed from the place where the interaction occurred
tion occurred (Figure 3f–h). Importantly, the droplet’s impact on the melt surface is in-
(Figure 3f–h). Importantly, the droplet’s impact on the melt surface is insufficient for
sufficient for generation of the cumulative jet well that is found in water–water interac-
generation of the cumulative jet well that is found in water–water interactions. Obviously,
tions. Obviously, this is a consequence of a much higher density ratio (higher inertia of
this is a consequence of a much higher density ratio (higher inertia of melt in comparison
melt in comparison with water).
with water).
As shown in Table 2, other experiments with free-falling water droplets were per-
As shown in Table 2, other experiments with free-falling water droplets were per-
formed for quite similar parameters, therefore, they can be considered as a repeatability
formed for quite similar parameters, therefore, they can be considered as a repeatability test.
test. A summary
A summary of allof all experimental
experimental data isdata is presented
presented in Figurein 4.
Figure
It can4.
beItseen
canthat,
be seen that,
generally,
generally,
the slope of the data corresponding to stages 1 and 3 follows the same trend for all of for
the slope of the data corresponding to stages 1 and 3 follows the same trend the
all of the
cases cases However,
D1–D9. D1–D9. However, the repeatability
the repeatability of stage 2of(the
stage 2 (the intermediate
intermediate stage be-
stage between the
tween
initial the initial
cavity cavity development
development due toimpact
due to droplet droplet impact
and and thewave
the surface surface wave prop-
propagation) is
agation) is much poorer; in some cases no distinct plateau was observed
much poorer; in some cases no distinct plateau was observed so that stage 1 was gradually so that stage 1
was graduallyinto
transformed transformed
stage 3. into stage 3.
16 D1 D6
D2 D7
D3 D8
12 D4 D9
D5
d, mm
8
4
0
0.1 1 10
t, ms
Summaryofofdata
Figure4.4.Summary
Figure dataobtained
obtainedfor
forfree-falling
free-fallingdrop
dropexperiments
experimentslisted
listed
inin Table2.2.Solid
Table Solid lines
lines
show
showthe
theapproximation
approximationfound
foundfor
forCase
CaseD1D1(see
(seeFigure
Figure 2).
2).
3.2.Impact
3.2. ImpactofofShort-Duration
Short-DurationWater
WaterJet
Jet
Thesecond
The secondexperimental
experimentalseries
seriesaimed
aimedto
toproduce
produceaamore
moresignificant
significantimpact
impactofofwater
water
on the melt surface by releasing a short-duration jet directed vertically towards
on the melt surface by releasing a short-duration jet directed vertically towards the melt the melt
surface. The parameters of the cases are summarized in Table 3. The two
surface. The parameters of the cases are summarized in Table 3. The two rightmostrightmost columns
present the
columns results
present theobtained by processing
results obtained the video
by processing records;
the they arethey
video records; discussed in more
are discussed
detail for each case in the following text.
in more detail for each case in the following text.
Table 3. Parameters of impulse-jet impact experiments.
Water Jet Diameter, Water Volume, Impact Velocity, Melt Temperature, Melt Depth, Maximum Melt Rise, Time of Maximum
Case ◦C
mm mL m/s mm mm a Rise, ms a
>34; >34; 30.84 >114; >151; 163
J1 5.37 1 11 300 14
94 (est.) b 224 (est.) b
J2 12.97 1 3 300 14 18.4 123
J3 6.69 1 4 300 14 51.5, 38.2 156, 139
J4 7.5 1 3.6 300 14 73; 49.7; 20.41 201; 168; 161
J5 6.22 1 3.1 300 14 53.4; 44 173; 152
aWhen the cumulative jet split into several parts, more than one value is given in relation to each melt part, from the upper to the lower
one. b Estimated from the camera field-of-view exit and re-entry times, assuming free motion in the gravity field.
3.2.1. Case J1
In this case, the jet impact is the strongest of all the studied cases due to the highest
impact velocity. The main features of the interaction are presented in Figure 5, the resolution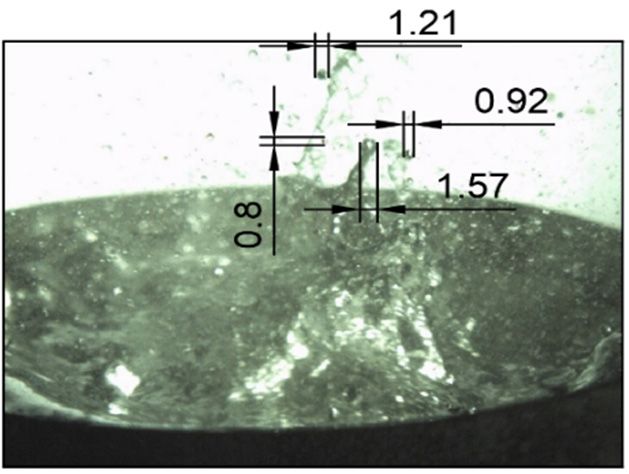
Appl. Sci. 2021, 11, 909 8 of 16
of each frame is 800 × 600 pixels, and the field of view dimensions are 60.8 × 45.5 mm.
The camera was placed at a distance of 25 cm from the impact point and its line of view
was inclined at 15 degrees with respect to the liquid surface. Note that the water jet
approaching the melt surface is not of simple geometry; it consists of a compact leading
Appl. Sci. 2021, 11, x FOR PEER REVIEW
volume followed by a thinner tail, see Figure 5a. Accordingly, the crown formed due to9 of 16
the
impact was asymmetric. Numerous melt droplets of 1–2 mm diameter was scattered by
the splashing, thus detaching from the rising crown. In Figure 5b, the shape of the crown,
as wellmm.
84–92 as a few clearly
Similar visible for
estimates meltthe
drops are shown
second at the
detached instant
melt that the
fragment crown
gave reached
a velocity of
its maximum
0.26 height.
m/s and its rise in height was about 38 mm above the melt level.
(a) (b)
30
163 ms 116 ms
20
y, mm
99 ms
10
0
−20 −10 0 10 20
x, mm
(c) (d)
(e) (f)
Figure 5.
Figure 5. Melt–water
Melt–water jet jet interaction,
interaction, Case
Case J1:
J1: (a)
(a) pre-impact
pre-impact shape
shape ofof water
water jet;
jet; (b)
(b) shape
shapeofofthe
themelt
melt
crown and droplets, t = 18 ms after the impact; (c) cumulative jet and droplet shedding;
crown and droplets, t = 18 ms after the impact; (c) cumulative jet and droplet shedding; (d) visible (d) visible
shape of
shape of the
the primary
primary cumulative
cumulative jet jet at
at different
different times;
times;(e)
(e)secondary
secondarycumulative
cumulativejet jetat
atthe
theinstant
instantofof
its maximum rise, t = 339 ms; (f) bubble floating on the melt
its maximum rise, t = 339 ms; (f) bubble floating on the melt surface. surface.
Only the
Unlike thethird,
weakslowest, part ofcaused
disturbance the cumulative
by the freejetfalling
was therefore
droplet,recorded completely
the perturbation of
and this is presented in Figure 5c. The maximum height of the cumulative
melt in this case was strong enough for the cumulative jet to appear as the result of jet part was
cavity
32 mm, itsMoreover,
collapse. diameter atthethe basecumulative
rising (melt level)jet
was
was30.8 mm. Numerous
fragmented meltdistinct
into three dropletsmelt
de-
taching from
volumes. the jet
At 112.5 ms,during
a ratheritslarge
rise drop-shaped
were observed, moving
volume upwards
detached fromwith velocities
the leading of
edge
about
of 1.2–1.9jet,
the rising m/s.and it left the field of view by 114 ms. Then, another jet fragmentation
Following
occurred, with a the
meltprimary
volume cumulative melt jet, ashape
that had an elongated secondary
with aone emerged size
longitudinal withofa about
maxi-
mum height 17 mm and the diameter near its base was 20.7 mm. After
15 mm, which detached at 135 ms and disappeared from view at 151 ms. At 204 ms, the it went down due to
gravity,
latter a melt part
detached bubble of 6.5
of the × 12.3 mm
jet returned tosize (most probably
the camera filledtowith
field of view impactwater vaporsurface
the melt or en-
trapped air) remained floating on the molten metal surface for a long enough time of 0.13 s.
3.2.2. Case J2
In this case, the impacting water volume is quite compact, measured 9.7 × 13 mm,
and resembled a big droplet of irregular shape rather than a jet; the pre-impact velocity (3
m/s) resembled that of the free-falling droplets in the previous series of experiments,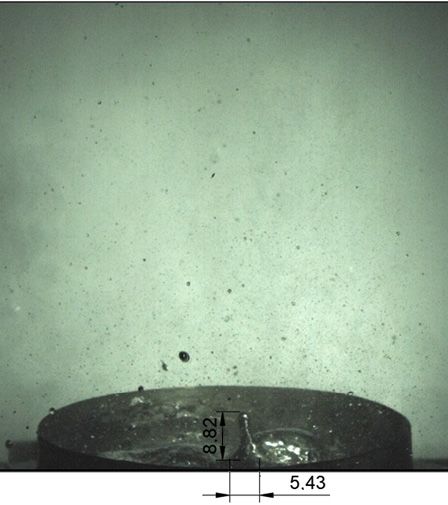
Appl. Sci. 2021, 11, 909                                                                                            9 of 16

                           at 267 ms. At 333 ms, the first detached melt fragment re-entered the camera view to fall
                           on the melt surface at 368 ms.
                                 In the experiment, the camera was placed quite close to the impact point (at a distance
                           of 25 cm), so that its field of view was insufficiently wide to record the first and second
                           detached melt volumes; these left the image upper boundary quite quickly. In Table 3, the
                           rise in height for the first two parts is shown as “>32 mm”, which indicates the height of
                           the upper boundary of the camera field of view. Also, the rising times of these two parts
                           are shown as the times when they left the camera field of view. However, taking the above
                           exit and re-entry times, and assuming the free-space motion in the gravity field, we can
                           obtain the following estimates: since the first detached part was absent from view during
                           the time ∆t = 333 − 114 = 219 ms. Based on the scholarly solution for an object thrown
                           upwards and caught at the same height, we can estimate the velocity of the fragment to be
                           v0 = 12 g∆t ≈ 1.07 m/s. The directly measured (by the video records) velocity of the melt
                           fragment just before it left the field of view was slightly lower, v0 = 0.99 m/s. Therefore,
                           the maximum rise in height is ∆h = v20 /2g ≈ 50.0 − 58.3 mm. Adding the height of the
                           camera view field top boundary above the melt level (34 mm), we can estimate that the
                           melt rise height can reach about 84–92 mm. Similar estimates for the second detached melt
                           fragment gave a velocity of 0.26 m/s and its rise in height was about 38 mm above the
                           melt level.
                                 Only the third, slowest, part of the cumulative jet was therefore recorded completely and
                           this is presented in Figure 5c. The maximum height of the cumulative jet part was 32 mm, its
                           diameter at the base (melt level) was 30.8 mm. Numerous melt droplets detaching from the
                           jet during its rise were observed, moving upwards with velocities of about 1.2–1.9 m/s.
                                 Following the primary cumulative melt jet, a secondary one emerged with a maximum
                           height 17 mm and the diameter near its base was 20.7 mm. After it went down due to gravity,
                           a melt bubble of 6.5 × 12.3 mm size (most probably filled with water vapor or entrapped air)
                           remained floating on the molten metal surface for a long enough time of 0.13 s.

                           3.2.2. Case J2
                                 In this case, the impacting water volume is quite compact, measured 9.7 × 13 mm,
                           and resembled a big droplet of irregular shape rather than a jet; the pre-impact velocity
                           (3 m/s) resembled that of the free-falling droplets in the previous series of experiments,
                           however, the water volume was bigger. The most noteworthy features of the interaction
                           are presented in Figure 6; the camera position and frame dimensions are the same as for
                           Case J1.
                                 The pre-impact shape of the water volume is shown in Figure 6a. Its impact on the
                           melt surface results in the formation of a cavity, as well as of a crown of moderate height,
                           no scattering of melt droplets was observed at this stage. Following the impact, some sort
                           of cumulative jet appeared, in Figure 6b, the shape of this “jet” is shown at the time of its
                           mid-rise and maximum rise. It can be seen that the cumulative “jet” is rather thick and slow
                           (its maximum height is 18.4 mm, while its base diameter is 32 mm), which can indicate the
                           presence of a gas bubble inside it. Indeed, after the disappearance of the cumulative jet, a
                           bubble remained floating on the melt surface for 0.167 s, see Figure 6c.
                                 An interesting feature of the melt–water interaction observed in this case was the
                           sporadic appearance of mini-splashes, which can be the result of micro-bursts of water
                           droplets entrapped by the melt at the earlier interaction stage. These mini-splashes looked
                           like tiny cumulative jets and they produce what visually can be characterized as “micro-
                           eruptions” that eject about 0.8–1.5 mm diameter melt droplets with characteristic velocities
                           of about 1.21–1.52 m/s. One such micro-eruption can be seen clearly to the left of the big
                           bubble in Figure 6c, and many more can be seen in Figure 6d where the melt surface after
                           the bubble collapse is shown.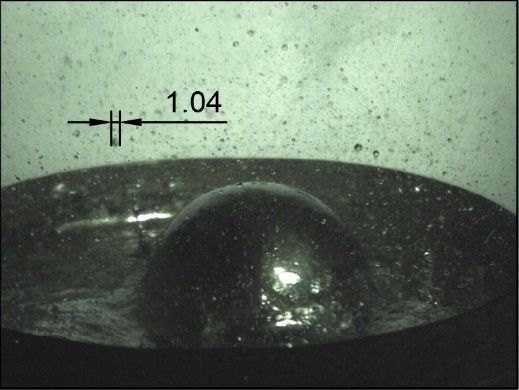
no scattering of melt droplets was observed at this stage. Following the impact, some sort
of cumulative jet appeared, in Figure 6b, the shape of this “jet” is shown at the time of its
mid-rise and maximum rise. It can be seen that the cumulative “jet” is rather thick and
slow (its maximum height is 18.4 mm, while its base diameter is 32 mm), which can in-
Appl. Sci. 2021, 11, 909 dicate the presence of a gas bubble inside it. Indeed, after the disappearance of 10 the
of cu-
16
mulative jet, a bubble remained floating on the melt surface for 0.167 s, see Figure 6c.
30
123 ms
20
y, mm
100 ms
10
0
−20 −10 0 10 20
x, mm
(a) (b)
(c) (d)
Figure6.6.Melt–water
Figure Melt–waterjet
jetinteraction,
interaction,Case
CaseJ2:
J2:(a)
(a)pre-impact
pre-impactshape
shapeofofwater
watervolume;
volume;(b)(b)shape
shapeofofthe
the
primary cumulative jet at different times; (c) floating bubble on the melt surface; (d) emergence
primary cumulative jet at different times; (c) floating bubble on the melt surface; (d) emergence of of
small“eruptions”
small “eruptions”ejecting
ejectingmelt
meltdroplets
dropletsafter
aftercollapse
collapseofofthe
thefloating
floatingbubble.
bubble.
3.2.3. Case J3
An interesting feature of the melt–water interaction observed in this case was the
sporadic appearance
In this experiment, ofthe
mini-splashes, which can
impact is provided by abe the result
rather of micro-bursts
thin water of water
jet with a compact
dropletsvolume
leading entrapped
of 6.7by themm,
× 14 meltfollowed
at the earlier interaction
by a long water tailstage.
of 3.2These mini-splashes
mm diameter. The
looked likefeatures
interaction tiny cumulative jets andinthey
are summarized produce
Figure whattovisually
7. In order canwhole
record the be characterized
evolution ofas
“micro-eruptions”
the melt splash, the thatcameraejectwas
about 0.8–1.5
placed mmaway
further diameterfrommelt droplets
the test vessel,with
at acharacteristic
distance of
velocities of about 1.21–1.52 m/s. One such micro-eruption can
73 cm, thus providing a 141.4 × 106 mm field of view. The line of view was inclined be seen clearly to the
byleft
5
of the big bubble in Figure 6c, and many more can be seen in Figure
degrees with respect to the melt surface (experiments J4 and J5 were also performed with 6d where the melt
surface
this cameraafter the bubble collapse is shown.
position).
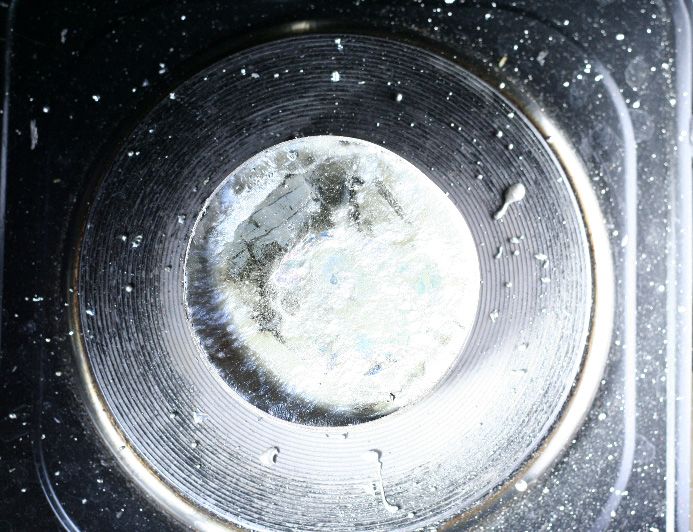
The melt–water interaction in this case was rather intensive, leading to the formation of
a3.2.3.
cavity,Case J3
its collapse and the ejection of a thin, tall cumulative jet, see Figure 7b. This process
was accompanied by
In this experiment,the formation
the impact of aislarge number
provided byofa 0.91–2.69
rather thin mm diameter
water meltadroplets,
jet with compact
moving upwards with velocities ranging from 0.56 to 1.27 m/s,
leading volume of 6.7 × 14 mm, followed by a long water tail of 3.2 mm diameter.see Figure 7c,d. It can be seen,
The
the cumulative
interaction jet fragmented
features into a number
are summarized of isolated
in Figure 7. In order meltto volumes,
record thewhich
whole fell back intoof
evolution
the
themelt
meltand caused
splash, thesecondary
camera was melt streamers,
placed furtherasaway
can be seen
from clearly
the in Figure
test vessel, at a7e,f.
distance of
73 cm, thus providing a 141.4 × 106 mm field of view. The line of view was inclined by 5
3.2.4. Case J4, J5
These cases were generally similar to case J3 in that the cumulative jet appeared to
have a tree-like shape. Therefore, for these two cases only the visible shapes of the jet are
presented in Figure 8a,b. It can be seen that the splashes of melt following the water impact
reach about 5 cm, the height of the splashes observed in the experiments with melt–water
interactions where powerful steam explosions were observed [5].Appl. Sci. 2021, 11, x FOR PEER REVIEW 11 of 16
Appl. Sci. 2021, 11, 909 degrees with respect to the melt surface (experiments J4 and J5 were also performed11with
of 16
this camera position).
40 170 ms
30
y, mm
20
128 ms
10
0
−20 −10 0 10 20
x, mm
(a) (b)
(c) (d)
(e) (f)
Figure
Figure 7. 7. Melt–water
Melt–water jetjet interaction,
interaction, Case
Case J3:
J3: (a)
(a) pre-impact
pre-impact shape
shape of
of water
water jet;
jet; (b)
(b) shape
shape of
of the
the
primary
primary cumulative jet at different times; (c), (d) melt droplets generated with the cumulative jet;
cumulative jet at different times; (c), (d) melt droplets generated with the cumulative jet;
(e) aa streamer
(e) streamer with
with aa melt
melt droplet;
droplet; (f)
(f) floating
floating bubble
bubble onon the
the melt
melt surface with melt
surface with melt streamer.
streamer.
The melt–water interaction in this case was rather intensive, leading to the formation
of a cavity, its collapse and the ejection of a thin, tall cumulative jet, see Figure 7b. This3.2.4. Case J4, J5
These cases were generally similar to case J3 in that the cumulative jet appeared to
have a tree-like shape. Therefore, for these two cases only the visible shapes of the jet are
presented in Figure 8a,b. It can be seen that the splashes of melt following the water im-
Appl. Sci. 2021, 11, 909
pact reach about 5 cm, the height of the splashes observed in the experiments with 12 melt–
of 16
water interactions where powerful steam explosions were observed [5].
50 50
147 ms
154 ms
40 40
30 30
y, mm
y, mm
87 ms
94 ms
20 20
10 10
0 0
−20 −10 0 10 20 −20 −10 0 10 20
x, mm x, mm
(a) (b)
Figure
Figure 8.
8. Melt–water jetinteraction,
Melt–water jet interaction,Cases
CasesJ4J4
(a)(a)
andand
J5 J5
(b):(b): shape
shape of the
of the cumulative
cumulative jet atjet at different
different times.
times.
4. Discussion
4. Discussion
In all the cases where water impacted on the melt surface, cavity development on the
meltIn surface
all thewas observed,
cases where waterfollowed by theon
impacted propagation of a radial
the melt surface, surface
cavity wave at the
development on
later stage of interaction. It is interesting to compare the cavity
the melt surface was observed, followed by the propagation of a radial surfacegrowth features in the cases
wave at
of droplet
the andof
later stage impulse jet impacts.
interaction. It is interesting to compare the cavity growth features in the
casesIn of Figure
droplet9,and
the impulse
time dependencies
jet impacts.of the cavern diameter are plotted for the cases J1
and J2, together with the data
In Figure 9, the time dependenciesfrom Figure 2 for
of the the free-falling
cavern diameter aredroplet impact
plotted (Case
for the D1).
cases J1
It can be seen that the data from Case J1 follow the three-stage sequence that
and J2, together with the data from Figure 2 for the free-falling droplet impact (Case D1). was clearly
seen
It caninbeFigure 2. However,
seen that case J2
the data from shows
Case more the
J1 follow irregular behavior,
three-stage most probably
sequence due to
that was clearly
the bubble formation under the melt surface caused by the evaporation
seen in Figure 2. However, case J2 shows more irregular behavior, most probably due to of water captured
by melt.
the bubble formation under the melt surface caused by the evaporation of water captured
by melt.
Table 4. Best-fit approximation parameters (see Equation (1)).
The parameters of the best-fit approximation (1) for cases D1 and J1 are listed in
Table 4. In Figure
Case 9, the approximations (1)D1 are plotted for each stage by J1the dashed (for
J1) and dashed-dotted (for D1) lines; the line segments are deliberately extended beyond
Stage 1
the limiting points of the stages to highlight the intersection points where the slope
changesTime interval,
abruptly. It ms 0≤t≤
can be seen that Stage 2.745
3 (surface wave propagation)0 ≤ tis≤only
2 weakly
d0 , mm 4.519 8.297
dependent on the interaction details (the slope d0 coincides in Stage 3 in D1 and J1 within
t0 , ms 0.073 0.1
4%, that is, d26.750 vs. 25.611, despite the significant differences in the water mass and
1 , mm 0 0
velocity). However, the cavity edge velocity in Stages 1 is very different, and significant
Stage 2
differences are observed in the duration of Stages 1 and 2. Generally, the data presented
Time interval, ms 2.745 ≤ t ≤ 9.65 2 ≤ t ≤ 3.72
d0 , mm 1.769 5.626
t0 , ms 2.745 2.0
d1 , mm 7.112 10.862
Stage 3
Time interval, ms t > 9.65 t > 3.72
d0 , mm 26.750 25.611
t0 , ms 9.65 3.72
d1 , mm 8.163 12.366Appl. Sci. 2021, 11, x FOR PEER REVIEW 13 of 16
Appl. Sci. 2021, 11, 909 in Figure 9 suggests the idea of possible cavern growth regime similarity, but further
13 of 16
experimental and theoretical studies are needed to find the governing similarity laws.
30
Drop, D1
Impulse jet, J1
Impulse jet, J2
20
d, mm
Appl. Sci. 2021, 11, x FOR PEER REVIEW 13 of 16
10
in Figure 9 suggests the idea of possible cavern growth regime similarity, but further
0
experimental and theoretical studies are needed to find the governing similarity laws.
0.1 1 10
30 t, ms
Drop, D1
Figure
Figure9.9.Time Impulse
Timehistory
historyofofjet,
the J1cavity
the cavitydiameters
diametersfor
forcases
cases D1,
D1, J1,J1,
andand
J2.J2.
TheThe dashed
dashed lines
lines show
show thethe
approximationsImpulse
approximations (1)
(1)for jet, J2
foreach
each stage,
stage, see
see parameters
parameters in
in Table
Table 4.
20
d, mm
AThe parameters
very interesting of the best-fit
feature ofapproximation
the melt–water (1)interaction
for cases D1that andwasJ1 are listed inexperi-
observed Table 4.
In Figureis9,that
mentally the approximations
not only water was (1) are plotted around
scattered for eachthe stage by the
impact dashed
point (forform
in the J1) and
of
10
dashed-dotted (for D1) lines; the line segments are deliberately
small droplets, but noticeable amounts of melt particles (frozen droplets) also collected extended beyond the
limitingthe
around points
vesselof after
the stages to highlight
each test, see Figure the10.
intersection
At this stage, points where theanalysis
no fractional slope changes
of the
abruptly. It can be seen that Stage 3 (surface wave propagation)
dispersed melt was performed because it was beyond the objectives of the current is only weakly dependent
work.
on the0 interaction
However, it can be details
said that (thetheslope d0 coincides
particles scattered inby
Stage
the 3interactions
in D1 and J1 arewithin
in the 4%,
mm,thator
sub-mm 0.1range.
is, 26.750 vs. 25.611, 1despite
It remains to be theseen 10how this
significant differences
dispersedin the water
fraction massdepends
of melt and velocity).
on its
However, and the cavity t, ms in Stages 1 is very different, and significant differences
edge velocity
superheat properties, as well as how sensitive it is to the melt material and water
are observed
Figure
impact 9. Timein the duration
history
characteristics. of Stages
of the cavity diameters1 and 2. Generally,
for cases D1, J1, and theJ2.data presented
The dashed linesinshow
Figure
the 9
suggests the idea
approximations of possible
(1) for each stage, cavern growth regime
see parameters in Table similarity,
4. but further experimental
and theoretical studies are needed to find the governing similarity laws.
A
A very
very interesting
interesting feature of the melt–water interaction that that was
was observed
observed experi-
exper-
imentally
mentally is is that
that not only water was scattered around the impact impact pointpoint inin the
the form
form of of
small
small droplets,
droplets, but but noticeable
noticeable amounts
amounts of of melt
melt particles
particles (frozen
(frozen droplets)
droplets) also
alsocollected
collected
around
around the
the vessel
vessel after
after each
each test,
test, see
seeFigure
Figure10.
10. At
At this
this stage,
stage,no nofractional
fractionalanalysis
analysisof ofthe
the
dispersed
dispersed meltmelt was
was performed
performed becausebecause it waswas beyond
beyond the objectives
objectives of the current work. work.
However,
However, itit cancan be
be said
said that
that thethe particles
particles scattered
scattered byby the
the interactions
interactions are are in
in the
the mm,
mm, oror
sub-mm
sub-mm range. remains to be seen how this dispersed fraction of melt depends on
range. It remains to be seen how this dispersed fraction of melt depends on its
its
superheat
superheat and and properties,
properties, as as well
well as as how
how sensitive
sensitive itit is
is to
to the
the melt
melt material
material and and water
water
impact
impact characteristics.
characteristics.
Figure 10. After-test photo of the heater and vessel with scattered frozen melt particles.
Table 4. Best-fit approximation parameters (see Equation (1)).
Case D1 J1
Stage 1
Time interval, ms 0 ≤ t ≤ 2.745 0≤t ≤2
d 0 , mm 4.519 8.297
t0 , ms 0.073 0.1
d1 , mm 0 0
Figure 10.
10. After-test
After-test photo
photo of
of the
the heater
heaterand
andvessel
Stage 2
vesselwith
withscattered
scatteredfrozen
frozenmelt
meltparticles.
particles.
Figure
It is4.helpful
Table to compare the
Best-fit approximation results obtained
parameters with
(see Equation those available in the literature
(1)).
for droplets impinging on a liquid surface where both liquids are identical (i.e., the pool
Case D1 J1
Stage 1
Time interval, ms 0 ≤ t ≤ 2.745 0≤t ≤2
d0 , mm 4.519 8.297
t0 , ms 0.073 0.1Appl. Sci. 2021, 11, 909 14 of 16
to droplet liquid density ratio is 1). As noted above, the non-dimensional parameters
commonly used to analyze the regime boundaries are the Weber and Froude numbers (see
review in [10]). When there is a big disparity in the properties of the impacting and receiving
liquids, proper definition of these numbers become somewhat difficult. The Weber number
characterizes the droplet stability due to surface tension effects, and it is logical to define
it in terms of water properties; on the other hand, surface tension can also influence the
melt flow. As a result, two Weber numbers can be introduced,Wek = ρk u2 D/σk , where the
subscript k = w denotes water, and k = m denotes melt. The Froude number Fr = u2 /gD
characterizes the gravity effects and it is more relevant to the flow of the heavier liquid
(melt). This number contains no fluid properties; however, it can be argued that the velocity
u in the nominator must be the characteristic velocity acquired by the melt upon impact
of water. In the case where the droplet and the receiving liquid possess identical or close
densities, this velocity can be taken as equal to that of the impacting droplet; however,
when the melt–water density ratio is as high as 9:1, it can be expected that the melt velocity
is lower than the impact one. Proper scaling of these velocities is not known at present and
should be the subject of special studies, both experimental and numerical.
To elucidate the differences between the melt–water and water–water interactions,
we present the values of the non-dimensional parameters (evaluated for water properties
ρw = 103 kg/m3 , σw = 72.8 mN/m, and melt properties from Table 1). For the cases D1–D9
(see Table 2) the calculated ranges are Wew = 517 − 720, Wem = 893 − 1243, Fr = 191 − 288.
For water–water interactions, the experiments generalized in [10] show that the lower
boundary of the regime where a thick central jet is formed with a detaching droplet at its
top, is described by We = 63.1·Fr0.257 (see Figure 8a, page 506 in [10]). The above range of
Froude numbers corresponds to We = 243 − 270, which is well below both Wew and Wem
quoted above. As was shown in the current experiments (see Section 3.1), the perturbations
of the melt surface caused by the impact of free-falling droplets were rather weak, and
despite the high Weber and Froude numbers, no central jet was registered in any of the
cases, D1–D9.
For the cases with jet impact, the corresponding non-dimensional parameters are
listed in Table 5, together with the calculated boundary values of the thick central jet [10].
It can be seen that, generally, the experimental conditions correspond to high Weber and
Froude numbers, well above the boundary We = 63.1·Fr0.257 obtained for the water–water
interactions. Nevertheless, in Case J2 the impact was not strong enough to cause the
formation of the central melt jet; a floating bubble was obtained instead (see Section 3.2).
Table 5. Non-dimensional parameters of the jet impact experiments.
Case D, mm u, m/s Wew Wem Fr We=63.1·Fr0.257 Central Jet
J1 5.37 11 8925 15404 2297 461.1507 +
J2 12.97 3 1603 2767 70.7 188.532 -
J3 6.69 4 1470 2537 243.8 259.1163 +
J4 7.5 3.6 1335 2304 176.1 238.3522 +
J5 6.22 3.1 821 1417 157.5 231.5934 +
5. Conclusions
The experimental results presented in this paper confirmed that the impact of water
jets with velocities of a few meters per second (the highest velocity in the experiments
was 11.4 m/s) is sufficient to produce melt splashes to heights of about 5 cm or more. The
experiments also revealed the three-stage interaction sequence of cavity growth, which has
not been reported in previous studies (see, e.g., [10] and literature quoted therein). It remains
to be seen if these stages are specific to the interactions of fluids with high density ratio.
Comparison of the experimental observations regarding the central jet formation in the
melt pool indicates significant quantitative differences with the water–water interactions
in terms of the regime boundaries characterized by the Weber and Froude numbers. In
particular, it became clear that, due to high inertia of heavy melt, more intensive impact isAppl. Sci. 2021, 11, 909 15 of 16
required in order to create noticeable melt splash. Further research should be devoted to the
establishment of more general features of the interaction mechanism, including the scaling,
which must take into account the density ratio of the pool and impacting liquids. To this
end, studies must be carried out for different melt superheats, as well as a wider range of
water mass and impact velocity, in order to derive relevant non-dimensional correlations.
The results obtained in the current paper are of interest not only from the fundamental
point of view, but also as an extension of the isothermal interaction of identical fluids to the
“thermal hydraulics” dimension. The characteristics of melt splashes are also important for
the evaluation of the thickness and phase concentrations in the zone above the melt layer
spreading in a shallow water pool, where the melt jets and droplets can mix with water,
which provides the conditions for stratified steam explosions, one of the major safety issues
in the nuclear power industry and metallurgy.
Author Contributions: Conceptualization, S.E.Y. and Y.D.C.; methodology, S.E.Y. and Y.D.C.; experi-
ments, A.Y.I. and V.A.U.; data analysis, S.E.Y. and V.A.U.; writing—original draft preparation, S.E.Y.
and V.A.U.; writing—review and editing, Y.D.C. and S.E.Y. All authors have read and agreed to the
published version of the manuscript.
Funding: This research was funded by the Russian Science Foundation (RSF), grant number
18-19-00289.
Institutional Review Board Statement: Not applicable.
Informed Consent Statement: Not applicable.
Data Availability Statement: Data sharing not applicable.
Conflicts of Interest: The authors declare no conflict of interest. The funders had no role in the design
of the study; in the collection, analyses, or interpretation of data; in the writing of the manuscript, or
in the decision to publish the results.
References
1. Berthoud, G. Vapor Explosions. Annu. Rev. Fluid Mech. 2000, 32, 573–611. [CrossRef]
2. Huhtiniemi, I.; Magallon, D. Insight into steam explosions with corium melts in KROTOS. Nucl. Eng. Des. 2001, 204, 391–400.
[CrossRef]
3. Magallon, D. Status and prospects of resolution of the vapour explosion issue in light water reactors. Nucl. Eng. Technol. 2009, 41, 603–616.
[CrossRef]
4. Kim, J.-H.; Park, I.-K.; Hong, S.-W.; Min, B.-T.; Hong, S.-H.; Song, J.-H.; Kim, H.-D. Steam Explosion Experiments Using Nuclear
Reactor Materials in the TROI Facilities. Heat Transf. Eng. 2008, 29, 748–756. [CrossRef]
5. Kudinov, P.; Grishchenko, D.; Konovalenko, A.; Karbojian, A. Premixing and steam explosion phenomena in the tests with
stratified melt-coolant configuration and binary oxidic melt simulant materials. Nucl. Eng. Des. 2017, 314, 182–197. [CrossRef]
6. Melikhov, V.I.; Melikhov, O.I.; Yakush, S.E.; Le, T.C. Evaluation of energy and impulse generated by superheated steam bubble
collapse in subcooled water. Nucl. Eng. Des. 2020, 366, 110753. [CrossRef]
7. Worthington, A.M. The Splash of the Drop Series “The Romance of Science”; Society for Promoting Christian Knowledge: New York,
NY, USA; E. & J.B. Young & Co.: London, UK, 1895.
8. Worthington, A.M. A Study of Splashes; Longmans, Green, and Company: London, UK, 1908.
9. Rein, M. Phenomena of liquid drop impact on solid and liquid surfaces. Fluid Dyn. Res. 1993, 12, 61–93. [CrossRef]
10. Ray, B.; Biswas, G.; Sharma, A. Regimes during liquid drop impact on a liquid pool. J. Fluid Mech. 2015, 768, 492–523. [CrossRef]
11. Castillo-Orozco, E.; Davanlou, A.; Choudhury, P.K.; Kumar, R. Droplet impact on deep liquid pools: Rayleigh jet to formation of
secondary droplets. Phys. Rev. E 2015, 92, 053022. [CrossRef] [PubMed]
12. Liow, J.L. Splash formation by spherical drops. J. Fluid Mech. 2001, 427, 73–105. [CrossRef]
13. Chashechkin, Y.D.; Ilynykh, A.Y. 2020. Total coalescence, rebound and fast partial bounce: Three kinds of interaction of free fallen
drop with a target fluid. Fluid Dyn. Mater. Process. 2020, 16, 801–811. [CrossRef]
14. Chashechkin, Y.D.; Ilinykh, A.Y. Multiple emissions of splashes upon drop impact. Dokl. Phys. 2020, 65, 384–388. [CrossRef]
15. Berberović, E.; Van Hinsberg, N.P.; Jakirlić, S.; Roisman, I.V.; Tropea, C. Drop impact onto a liquid layer of finite thickness:
Dynamics of the cavity evolution. Phys. Rev. E 2009, 79, 036306. [CrossRef] [PubMed]
16. Chashechkin, Y.D.; Ilinykh, A.Y. Banded structures in the distribution pattern of a drop over the surface of the host liquid. Dokl.
Phys. 2018, 63, 282–287. [CrossRef]
17. Chashechkin, Y.D. Evolution of the fine structure of the matter distribution of a free-falling droplet in mixing liquids. Izvest.
Atmos. Ocean. Phys. 2019, 55, 285–294. [CrossRef]You can also read