Surface precipitation of supersaturated solutes in a ternary Fe-Au-W alloy and its binary counterparts
←
→
Page content transcription
If your browser does not render page correctly, please read the page content below
J Mater Sci (2021) 56:5173–5189

Metals &Ccorrosion
METALS & ORROSION

Surface precipitation of supersaturated solutes
in a ternary Fe–Au–W alloy and its binary counterparts
Y. Fu1,2,* , C. Kwakernaak3, J. C. Brouwer3, W. G. Sloof3, E. Brück1, S. van der Zwaag2,4, and
N. H. van Dijk1

1
  Fundamental Aspects of Materials and Energy Group, Faculty of Applied Sciences, Delft University of Technology, Mekelweg 15,
  2629 JB Delft, The Netherlands
2
  Novel Aerospace Materials Group, Faculty of Aerospace Engineering, Delft University of Technology, Kluyverweg 1, 2629 HS Delft,
  The Netherlands
3
  Department of Materials Science and Engineering, Delft University of Technology, Mekelweg 2, 2628 CD Delft, The Netherlands
4
  School of Materials Science and Engineering, Tsinghua University, Beijing 100084, China

Received: 22 July 2020               ABSTRACT
Accepted: 13 November 2020           The precipitation of supersaturated solutes at free surfaces in ternary Fe–3Au–
Published online:                    4W and binary Fe–3Au and Fe–4W alloys (composition in weight percentage)
30 November 2020                     for different ageing times was investigated at a temperature of 700 °C. The time
                                     evolution of the surface precipitation is compared among the three alloys to
Ó   The Author(s) 2020               investigate the interplay between the Au and W solutes in the ternary system.
                                     The Au-rich grain-interior surface precipitates show a similar size and kinetics
                                     in the Fe–Au–W and Fe–Au alloys, while the W-rich grain-interior surface
                                     precipitates show a smaller size and a higher number density in the Fe–Au–W
                                     alloy compared to the Fe–W alloy. The kinetics of the precipitation on the
                                     external free surface for the ternary Fe–Au–W alloy is compared to the previ-
                                     ously studied precipitation on the internal surfaces of the grain-boundary cav-
                                     ities during creep loading of the same alloy.

Handling Editor: P. Nash.

Address correspondence to E-mail: Y.Fu-1@tudelft.nl

https://doi.org/10.1007/s10853-020-05571-w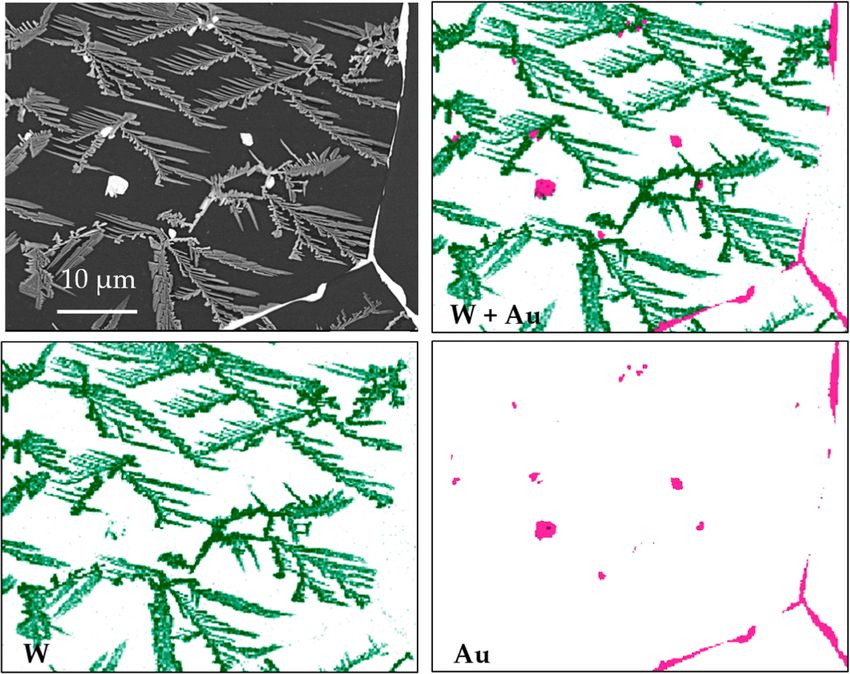
5174                                                                              J Mater Sci (2021) 56:5173–5189

                                GRAPHICAL ABSTRACT

Introduction                                               has been demonstrated that Au atoms dissolved in
                                                           bcc iron can actively heal early-stage radiation dam-
                                                           age by solute segregation [10]. In a systematic study
Metals in service degrade due to processes like creep,     on ferritic steels (with a bcc lattice structure), a series
fatigue, wear, corrosion, and radiation damage. Tra-       of binary and ternary alloys [6, 7, 12–17], including
ditionally, efforts have been made to stabilize the        Fe–Cu, Fe–Au, Fe–Mo, Fe–W and Fe–Au–W, were
material composition and microstructure so that the        investigated to reveal the mechanism of self-healing
occurrence of damage is postponed as long as pos-          during creep. The composition of these alloys was
sible, which corresponds to a damage prevention            selected such that at the operating temperatures the
strategy [1]. Since the initiation of the damage is        solute is in a supersaturated state by approximately 1
assumed to be inevitable, the concept of self-healing      at.%. The supersaturated solute atoms are expected to
is proposed as an alternative strategy, in which case      segregate on the surfaces of the creep-induced grain-
the occurrence of damage triggers mobile healing           boundary cavities and fill them progressively. As a
agents to move towards the defect and heal the defect      result, the coalescence of neighbouring creep cavities
site [2, 3]. In the self-healing approach, the propaga-    can be prevented or delayed.
tion of damage is interrupted.                                One of the challenges in studying the healing of the
   The self-healing concept has been applied to            creep-induced defects lies in the observation of both
improve the creep resistance [4–7], fatigue resistance     the creep cavities and the precipitation inside these
[8, 9] and the radiation damage resistance [10] of         cavities at different stages of the creep life. In previ-
various metallic systems. The combined addition of         ous studies [7, 16], characterisation techniques, such
boron and nitrogen into austenitic stainless steels        as scanning electron microscopy (SEM), transmission
(with an fcc lattice structure) is effective in reducing   electron microscopy (TEM) and atom probe tomog-
the cavity growth rate, as well as increasing the creep    raphy (APT), provided extensive information on the
rupture strength [4, 11]. The self-healing behaviour       microstructure including the composition of the
was studied in underaged Al alloys subjected to            precipitates, the orientation relation between the
creep [5, 8] and fatigue [8] conditions. The healing       precipitation and the matrix and the local composi-
solutes (usually Cu atoms) migrate to the defects and      tional distribution. Recently, synchrotron X-ray nano-
form precipitates via bulk diffusion or pipe diffusion     tomography was utilized on the Fe-Au and Fe-W
along dislocations. The improvement in creep and           systems [12, 13], and 3D structures of the cavities and
fatigue performance is achieved by dynamic precip-         the healing precipitates were reconstructed with a
itation, the subsequent reduction in the dislocation       voxel size down to 25 nm. However, these techniques
mobility and/or the closure of the incipient cracks. It
J Mater Sci (2021) 56:5173–5189                                                                            5175

are either limited to 2D information (SEM and TEM)        precipitation study. The Fe-based alloys were pro-
or to small 3D regions with a nanometre length scale      duced by GoodfellowÒ. Small plates with dimen-
(APT). The synchrotron X-ray nano-tomography can          sions of about 10 9 10 9 0.5 mm3 were cut from the
probe a wider range of length scales in 3D, but can       as-received rolled sheet materials by spark erosion.
only provide limited access due to the high demand.       Subsequently, the samples were sealed separately in
Sun and co-workers [18] provided a complimentary          evacuated quartz tubes filled with 200 mbar ultra-
solution by linking the precipitation on the free         high purity argon to prevent oxidation during
creep-cavity surface during creep to the precipitation    annealing. The annealing (8 h at 868 °C for the Fe–
behaviour on an external surface during ageing. In        Au–W and Fe–Au alloys and 24 h at 900 °C for the
contrast to a self-healing system during creep load-      Fe–W alloy) and the subsequent water quenching
ing, where the precipitation is formed on the internal    were performed to dissolve the solute elements into
surface of a cavity, in a surface precipitation experi-   the single-phase ferritic (bcc) matrix. The samples
ment [19], the solute diffuses towards the external       were then polished to an OPS level, ultrasonically
free surface of the sample and forms surface precip-      cleaned extensively, and subsequently placed in an
itates there. These precipitates at an external surface   alumina crucible that was mounted into a horizontal
are much easier to observe than those at internal         quartz tube furnace (Carbolite MTF 12/38/850, UK)
surfaces. By comparing the growth kinetics of the         with an inner tube diameter of 30 mm. The temper-
precipitates formed on the external surface (from         ature in the furnace tube was measured with a NiCr/
surface precipitation experiments) and on the inter-      NiAl (type K) thermocouple at the sample location.
nal surfaces (from self-healing creep experiments), it    To avoid oxidation of the samples, a gas mixture of
was demonstrated that the underlying physics for          argon and 10 vol.% hydrogen was used to flush the
precipitation on the external surface and on internal     furnace for about 1 h at a flow rate of 1 L/min before
surfaces is the same [18].                                the samples were heated. Prior to admitting the gas
   In the present study, the precipitation of super-      mixture to the furnaces, each gas, i.e. Ar and H2 (both
saturated solutes in bcc iron at free surfaces for        with a purity better than 5 N vol.%, Linde, The
ternary Fe–3Au–4W and related binary Fe–3Au and           Netherlands), was filtered to remove any residual
Fe–4W alloys (all in weight percentage) is explored.      hydrocarbons, moisture and oxygen, with Accosorb
The time evolution of the Au-rich and W-rich pre-         (\ 10 ppb hydrocarbons), Hydrosorb (\ 10 ppb H2O)
cipitates is investigated for different ageing times.     and Oxysorb (\ 5 ppb O2) filters (Messer Griesheim,
This study aims to provide a complimentary method         Germany), respectively. To further reduce the oxygen
to understand and predict the precipitation beha-         level, the argon was passed through an inline quartz
viour and the mass transfer of supersaturated solutes.    tube filter with titanium powder (100 lm, 99.5 wt%
The results for the ternary Fe–Au–W alloy are com-        purity, TLS Technik GmbH & Co) heated to 800 °C.
pared with the binary Fe–Au and Fe-W alloys to            The flow of each gas was regulated and monitored
investigate the interplay between the two healing         using mass flow controllers (Bronkhorst, The
agents in the ternary system. The Au-rich and W-rich      Netherlands). After flushing the furnace tube, the
precipitates found in the ternary Fe–Au–W system          crucible was heated and kept at 200 °C for 2 h to
are consistent with the ones observed in the binary       remove any oxygen and water adsorbed on the sur-
Fe–Au and Fe–W systems. The Au-rich precipitates          faces inside the quartz tube. After that, the samples
formed at 700 °C show an fcc structure with 60 at.%       were heated to 700 °C and held isothermally for dif-
Au and 40 at.% Fe, while the formed W-rich precip-        ferent times. After the ageing, the samples were
itation corresponds to the hexagonal Fe2W Laves           cooled in the furnace to room temperature. Scanning
phase.                                                    electron microscopy (SEM, JEOL JSM 6500F, Japan)
                                                          coupled with energy-disperse X-ray spectroscopy
                                                          (EDS) was used to characterize the samples after the
Experimental                                              heat treatment. In addition, scanning electron
                                                          microscopy combined with a xenon plasma focused
One ternary Fe–3.07Au–3.80W system and two bin-           ion beam (Helios G4 PFIB UXe, Thermo Fisher Sci-
ary systems, Fe–2.87Au and Fe–3.80W (in weight            entific, USA) was performed to create cross-sections
percentage) were selected for the present surface         to obtain information on the precipitation underneath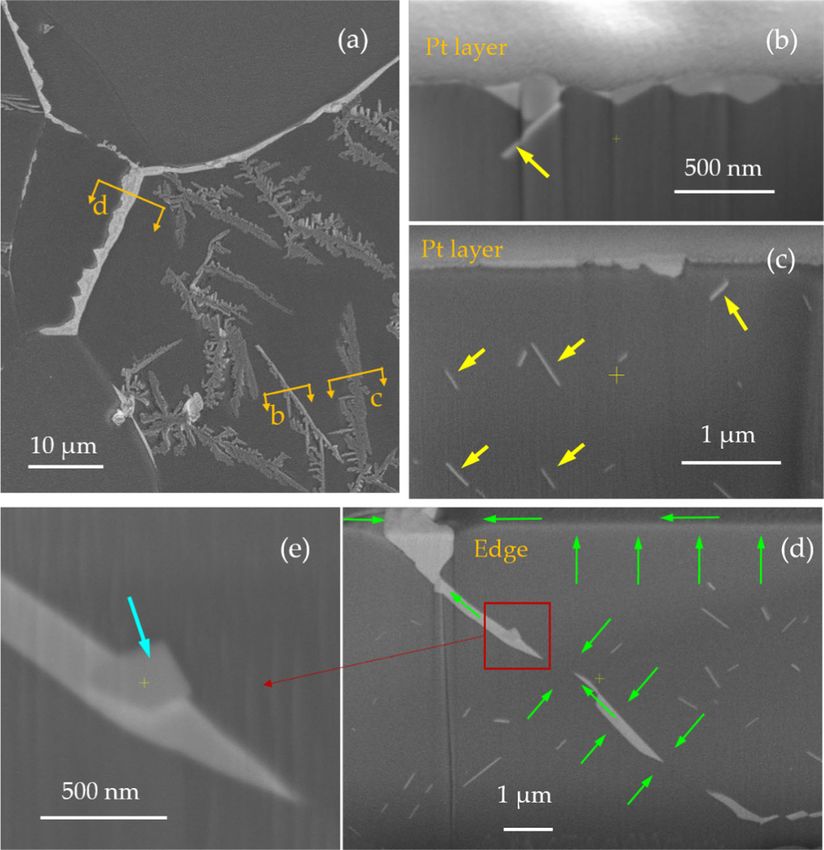
5176 J Mater Sci (2021) 56:5173–5189
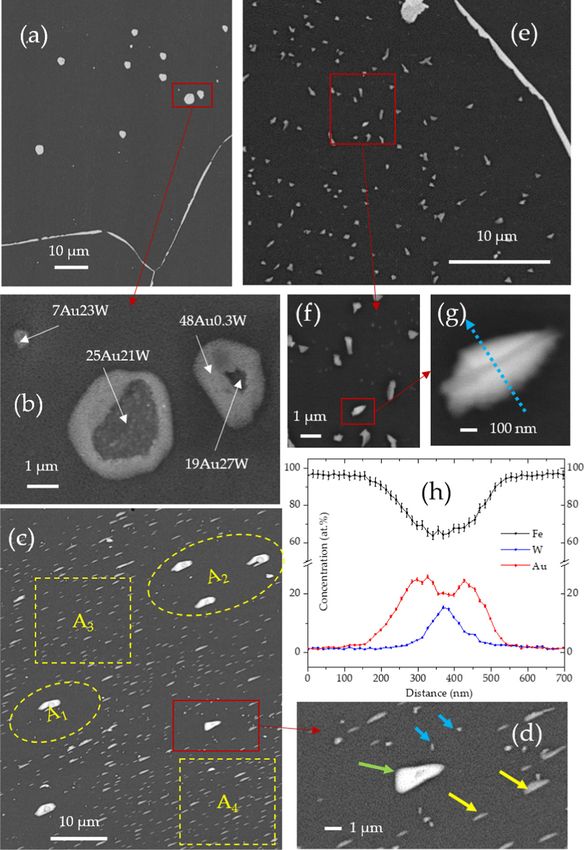
Figure 1 SEM images for the Fe–Au–W, Fe-Au and Fe-W alloys for 8, 32 and 100 h, respectively; g, h: Fe-W sample after ageing
after ageing for different times. a–c: Fe–Au–W sample after ageing for 32 and 100 h, respectively. The scale bars correspond to
for 8, 32 and 100 h, respectively; d–f: Fe-Au sample after ageing 10 lm.
the free surface. On small features (cf. Fig 3g and h), 100 h, only a limited amount of GI precipitates can be
the beam energy employed was 5 keV with an observed for the Fe–Au alloy (Fig. 1f), indicating that
effective analysis volume of about 200 nm across. most of the Au-rich GI precipitates are collected at
the grain boundaries. For the Fe-W samples, the
precipitates start to form after 32 h of ageing
Results (Fig. 1g). By EDS, it is observed that the W concen-
tration corresponds to 20–32 at.%. The precipitates
The SEM images of the three alloys after ageing for show some variation in number density for different
different times are shown in Fig. 1. For all three grains, but their shapes are similar (Fig. 1g and 1h).
alloys, the precipitates are found both on and within From 32 to 100 h, the W-rich precipitates experience
the perimeter of the grain boundaries. Based on their an obvious increase in size.
surface location with respect to the grain boundaries, The precipitation in the ternary Fe–Au–W alloy
the precipitates are referred as the grain-boundary shows more complexity. In the 8 h sample (Fig. 1a),
(GB) surface precipitates or grain-interior (GI) surface only Au-rich precipitates were found. The GI pre-
precipitates, respectively. For the precipitates in the cipitates in different grains show different shapes
Fe-Au alloy, the EDS results show a gold concentra- and distributions, similar to their counterparts in the
tion of 40–60 at.%. After ageing for 8 and 32 h (Fig. 1d Fe-Au sample. On the surface of the 32 h sample,
and e), the GI precipitates vary from grain to grain, in precipitates with different compositions can be
their size, shape and spatial distribution. After 32 h observed: the GB precipitation is generally enriched
annealing, the GI precipitates are generally larger in Au, while the GI precipitates can be (1) enriched in
than their counterparts at 8 h, while after ageing for W, (2) enriched in Au and (3) enriched in both W and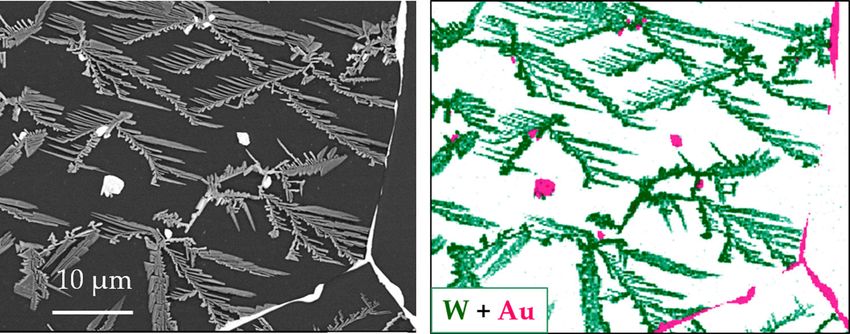
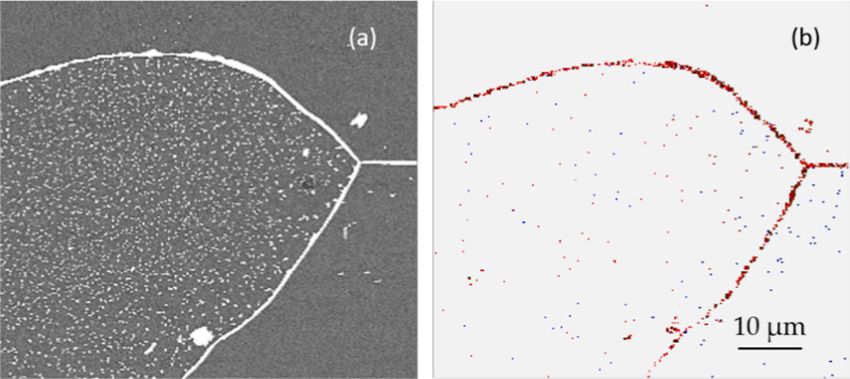
J Mater Sci (2021) 56:5173–5189                                                                                    5177

Figure 2 Compositional map of the Fe–Au–W sample after ageing for 100 h.

Au. The W-rich precipitates are the small particles             that the grain boundaries are mainly covered by Au-
scattered within the perimeter of the grain bound-              rich precipitates, while the GI branched surface pre-
aries. Similar to their counterparts in the Fe-W alloy,         cipitate structures are W-rich. In the interior also Au-
the W-rich GI precipitates distribute uniformly in the          rich precipitates can be observed: some are isolated,
grains, and usually show irregular shapes with sharp            and some are in contact with the W-rich patterns like
edges. However, for the 32 h samples, the W-rich GI             snow decorating the branches. From Figs. 1 and 2, by
precipitates in the Fe–Au–W ternary alloy are much              comparing the 100 h Fe–Au–W ternary sample with
smaller, compared to those in the Fe–W sample. The              its binary counterparts, two major differences can be
Au-rich and (Au/W)-rich precipitates are generally              observed: (1) in the grains covered with the branched
larger and show a roundish shape, which are difficult           surface precipitate structures the area fraction of the
to differentiate without further compositional analy-           W-rich precipitates is much larger for the Fe–Au–W
sis. After ageing for 100 h, the W-rich precipitates            sample than that in the Fe–W sample and (2) in the
show a branched surface precipitate structure for               Fe–Au alloy, the Au-rich precipitates show a strong
some of the grains (Fig. 1c). It is clear that there are        tendency to dissolve and migrate towards the grain
more W-rich precipitates for some grains (e.g. grain            boundaries via the diffusion of Au atoms, leaving
1) than in others (e.g. grain 2 and 3). Grain 4 in Fig. 1c      only small GI precipitates in the grains (Fig. 1f), while
gives an example in which some roundish Au-rich GI              in the Fe–Au–W alloy, large Au-rich GI precipitates
precipitates can be observed, while no W-rich pre-              are found in the majority of the examined grains.
cipitates are found.                                               A closer observation of the (Au/W)-rich GI parti-
   A compositional map of the Fe–Au–W sample after              cles yields more detailed information. Figure 3 shows
ageing for 100 h is shown in Fig. 2. It can be observed         the GI precipitates for the ternary Fe–Au–W alloy
5178                                                                                          J Mater Sci (2021) 56:5173–5189

Figure 3 SEM images for the Fe–Au–W sample after ageing for        distribution of the Au-rich GI precipitates. e–g Au-rich and W-rich
32 h. a, b: Morphology and structure of the (Au/W)-rich GI         GI precipitates form in contact to each other, yielding a sandwich
precipitates; c, d Effect of the (Au/W)-rich precipitates on the   structure; h Compositional scan along the line in (g).

after ageing for 32 h. The roundish precipitates in                left corner is enriched in both Au and W, while the
Fig. 3a are either enriched in Au or enriched in both              two larger particles show a core–shell structure. The
Au and W. A SEM image with higher magnification                    cores of the particles are enriched in both Au and W,
is provided in Fig. 3b. The small precipitate at the top           while the shells are enriched in Au only. It is
J Mater Sci (2021) 56:5173–5189                                                                              5179

therefore inferred that the W-rich precipitates formed     reference [19], the core–shell structure was due to the
first, while the Au-rich precipitation is added from       temperature change during cooling and the associ-
below, and subsequently wrapped the previously-            ated changes in the equilibrium Ge concentration,
formed W-rich particles, eventually forming a core–        while in the current study, the core–shell structure
shell structure. There are three types of GI precipi-      results from the Au diffusion towards the pre-exist-
tates in Fig. 3c and d: the ones enriched in Au            ing W-rich particles, which act as nucleation sites.
(indicated by yellow arrows), the ones enriched in W          To investigate how far the precipitates extend
(indicated by blue arrows) and the ones with a core–       below the surface into the matrix, a plasma focused
shell structure (indicated by a green arrow). In           ion beam (PFIB) was used to further investigate the
Fig. 3c, it is observed that the majority of the Au-rich   Fe–Au–W alloy after 100 h of ageing, as shown in
GI precipitates are uniformly distributed, but in the      Fig. 4. As indicated in Fig. 4a, three cross-sectional
vicinity of a core–shell particle, a Au depletion zone     slits were generated containing the W-rich precipi-
is generated. In the depletion zone, only W-rich           tates (Fig. 4b and c) and the Au-rich grain boundary
precipitates can be observed, which indicates that the     (Fig. 4d). W-rich precipitates form on the free surface,
Au-rich precipitates show a higher mobility on the         with an average thickness of about 74 nm (Fig. 4b
free surface compared to their W-rich counterparts.        and c). The matrix precipitates (indicated by the
   Similar to the grain boundaries, the precipitates       yellow arrows) are Au-rich precipitates. Our previ-
with a core–shell structure also act as a sink (or         ous research [6, 7] revealed that these precipitates
assembly site) for the Au-rich precipitates. This          have a disc-shaped geometry and are generally con-
explains the difference in size distribution of the Au-    nected to dislocations. In Fig. 4d, a valley filled with
rich precipitates between the ternary Fe–Au–W alloy        Au-rich precipitation along the grain boundary can
and the binary Fe-Au alloy for long ageing times. In       be observed, with a width of about 1.4 lm and a
the Fe-Au alloy only, the grain boundaries act as a        depth of about 0.9 lm. Au-rich precipitation is also
sink for the Au-rich precipitates, and therefore most      observed on the grain boundary underneath the free
of the Au-rich GI precipitates are collected by the        surface, suggesting that Au transport primarily pro-
grain boundaries after 100 h of ageing. In the Fe–Au–      ceeds via (1) diffusion along the grain boundaries
W alloy, however, both the grain boundaries and the        underneath the surface and (2) surface diffusion. The
core–shell particles act as assembly sites for the Au-     diffusion paths of the Au atoms are indicated by the
rich precipitates, and as a result some GI precipitates    green arrows in Fig. 4d. It is worth noting that W-rich
have survived the long-term ageing in the form of          precipitates are also observed on the Au-covered
core–shell particles. It is worth noting that compared     grain boundary (indicated by a blue arrow in Fig. 4d
to the uniformly distributed Au-rich precipitates, the     and e), indicating a segregation tendency of W
precipitates attracted by the assembly sites cover a       solutes towards the grain boundaries. However, the
smaller area fraction. For example, the area fraction      solute Au shows a much stronger segregation ten-
of the Au-rich precipitates in regions A3 and A4 in        dency towards the grain boundaries compared to
Fig. 3c is about twice as high as in regions A1 and A2.    solute W.
This strongly suggests that the precipitates thicken          To our knowledge, the Fe–Au–W ternary phase
during the coarsening. Figure 3e–h may correspond          diagram has not yet been measured or calculated.
to the early stage of the core–shell structure forma-      However, given the immiscibility and the positive
tion. In Fig. 3g, it is observed that Au-rich precipi-     formation energy for the Au–W system [20, 21], and
tates form from both sides of a previously-formed          the fact that the Au-rich and W-rich precipitates form
W-rich precipitate, resulting in a sandwich-like           independently instead of forming a compound [17],
structure. This observation of side-by-side formation      the phases of the Au-rich and W-rich precipitates
is consistent with the results from creep-failed sam-      were estimated on the basis of the binary phase dia-
ples [17], where Au-rich and W-rich precipitated are       grams for Fe–Au and Fe–W systems, respectively.
found to be present in contact with each other             According to the binary phase diagrams, the Au-rich
(without forming a compound).                              precipitates should show fcc structure with 60 at.%
   It is worth to note that a core–shell structure was     Au and 40 at.% Fe at 700 °C, while the W-rich pre-
also observed in [19], however, different mechanisms       cipitates should correspond to the Fe2W Laves phase
account for the structures in the two studies. In          with a hexagonal structure. The phases of the
5180                                                                          J Mater Sci (2021) 56:5173–5189

Figure 4 PFIB-SEM results
for the Fe–Au–W alloy after
ageing for 100 h. a The three
locations where PFIB was
performed; b and c The cross-
section of W-rich precipitates;
d and e the cross-section of an
Au-rich grain boundary. The
yellow arrows, blue arrow and
green arrows indicate the Au-
rich matrix precipitates,
W-rich precipitate segregated
on a grain boundary and the
diffusion paths of Au,
respectively.

Figure 5 Backscattered
electron image a and EBSD
phase map b for a Fe–Au–W
sample after 32 h of ageing.
The red corresponds to the fcc
Au phase, while the blue
corresponds to the hexagonal
Fe2W Laves phase.

precipitates were determined by EBSD as shown in         particles enriched in both Au and W (see Fig. 3b), a
Fig. 5. The red and blue colours correspond to the fcc   particle has 7 at.% Au and 23 at.% W) correspond to a
Au phase and the hexagonal Fe2W Laves phase,             situation where the Au-rich and W-rich precipitates
respectively. In the current research, the Au-rich       are formed in contact to each other (instead of
precipitates show a Au concentration of 40—60 at.%,      forming a ternary compound), but due to the spatial
while the W-rich precipitates show a W concentration     resolution limitation of EDS, we cannot separate
of 20—32 at.%, which is consistent with the expected     them.
composition within the accuracy of the EDS. The

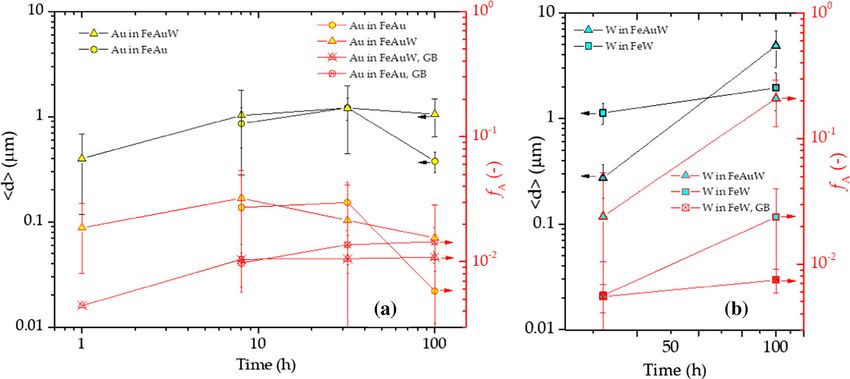
J Mater Sci (2021) 56:5173–5189                                                                                                     5181

Figure 6 Equivalent diameter of the GI precipitates and area fraction of both the GB and GI precipitates for a the Au-rich precipitation in
Fe–Au–W and Fe-Au alloys and b the W-rich precipitation in Fe–Au–W and Fe-W alloys for different ageing times.

   To quantify the precipitation in the three alloys,                   as can be seen from the area fraction of the GB pre-
and thus compare the precipitates in the ternary alloy                  cipitates. This is consistent with the results in Fig. 1:
with its binary counterparts, in Fig. 6 the equivalent                  in the Fe-Au alloy most of the Au-rich GI precipitates
diameter (for the GI precipitates) and the area frac-                   are collected by the grain boundaries after 100 h
tion (for the sum of the GI and GB precipitates) are                    ageing, while in the ternary Fe–Au–W system the
presented for the three alloys as a function of the                     particles with a core–shell structure provide extra
ageing time. For each sample, 7 to 15 grains were                       assembly sites for the Au-rich GI precipitates.
analysed, and the average value and the scatter are                        The size and the area fraction of the W-rich pre-
shown. The Au-rich and W-rich precipitates are                          cipitates in Fe–Au–W and Fe-W alloys are compared
presented separately for clarity. The results of Fig. 6a                in Fig. 6b. Unlike the fast size evolution of the Au-
indicate that: (1) the equivalent diameter of the GI                    rich GI precipitates that results in a maximum size
precipitates increases up to about 32 h for both the                    around 32 h, the W-rich GI precipitates are still
Fe–Au–W and Fe-Au alloys. However, from 32 to                           growing from 32 to 100 h. The W-rich GI particles are
100 h, the size of the GI precipitates in the Fe–Au–W                   smaller in size in the Fe–Au–W alloy at 32 h, but the
alloy remains about constant, while in the Fe–Au                        smaller particles show a larger area fraction com-
alloy the GI precipitates show a significant decrease                   pared to their counterparts in the Fe-W alloy. During
in size. (2) the area fraction of the GI precipitates for               the whole ageing process, the area fraction of the
the Fe-Au alloy increases slightly from 8 to 32 h                       W-rich precipitates in the ternary Fe–Au–W alloy is
before it decreases significantly from 32 to 100 h,                     5–10 times larger than that in the binary Fe-W alloy. It
indicating a significant Au diffusion towards the                       is also worth noting that from 32 to 100 h, the area
grain boundaries. For the Fe–Au–W alloy, the area                       fraction of the GI precipitates in the Fe-W alloy
fraction peaks at 8 h before it decreases gradually                     increased by 5 times, while the area fraction of the GB
from 8 to 100 h. The decrease in area fraction occurs                   precipitates remains at a relative constant level. This
earlier in the Fe–Au–W ternary alloy, because there                     indicates that the surface diffusion of W is much
are more assembly sites (the precipitates with the                      slower than that of Au, so that the Au-rich GI pre-
core–shell structure) for the Au-rich GI precipitates.                  cipitates on the surface show an obvious tendency to
With the diffusion of Au, some Au-rich precipitates                     migrate towards the grain boundaries (and to the
grow at the expense of the others dissolving, result-                   core–shell structures) via the Au atom diffusion,
ing in a smaller area fraction. (3) the grain boundaries                while the W-rich precipitates tend to be immobile
of the Fe-Au alloy collect more Au-rich GI precipi-                     once formed on the surface.
tates compared to the ternary Fe–Au–W counterpart,
5182                                                                                J Mater Sci (2021) 56:5173–5189

   As indicated in Fig. 6b, the Au segregation clearly        Discussion
enhances the precipitation kinetics of the W-rich
Fe2W Laves phase on the surface. This is expected to          The evolution of the size and site density
be caused by the enhanced W diffusion in the matrix           of grain-interior precipitates
and an enhanced nucleation in the ternary Fe–Au–W
alloy, as the solute Au depleted diffusion layer below        The size and distribution of the GI precipitates in
the surface shows a significant shrinkage. From               every analysed grain are provided in Fig. 7. Each
Fig. 6b, it is clear that at 100 h the surface fraction for   data point corresponds to the information from a
the Fe2W precipitates in the ternary Fe–Au–W alloy            single grain. The Au-rich and W-rich precipitates in
(fA & 21%) is one order of magnitude larger com-              the Fe–Au–W alloy are considered separately. Since it
pared to that in the binary Fe-W alloy (fA & 2%). This        is difficult to classify the Au-rich and (Au/W)-rich
indicates a much slower kinetics. In fact, the value of       particles unambiguously just by their shape, the
the surface fraction fA observed for the binary Fe-W          roundish particles with a core–shell structure
alloy at 100 h is of the same order as the surface            (Fig. 3b) are regarded as Au-rich precipitates.
fraction fA for the ternary Fe–Au–W alloy at 32 h             Assuming that the ratio between the GB precipitation
(fA & 2%). As shown in Fig. 1, for the ternary Fe–            and the GI precipitation is constant in each grain after
Au–W alloy at 32 h also no branched structure was             a fixed annealing time, then the total amount of the
observed, consistent with the observation for the             GI precipitates per unit area is the same for each
binary Fe-W alloy at 100 h. It is therefore expected          grain. If all precipitates have a constant thickness,
that the branched structure in the binary Fe-W alloy          then the area fraction of precipitates shows a scaling
is only formed for a larger surface fraction fA, which        relation nA / hdim with a slope of m = - 2. If the
is expected to be reached for significantly longer            precipitates are shape-conserved, then the particles
times (about 400 h). The origin for the transition in         grow in three directions and their thickness is pro-
morphology from roundish to branched surface pre-             portional to the corresponding equivalent diameter,
cipitates has not been established, but is expected to        resulting a scaling relation nA / hdim with a slope of
be related to an anisotropy in growth rate with               m = -3.
respect to orientation. As the hexagonal Fe2W Laves              For a grain area SG , a number of precipitates N, and
phase has a significantly lower symmetry than the bcc         a particle average diameter hdi, the number density
Fe-based matrix the most favourable growth condi-             nA and the area fraction fA of the GI precipitates

tions are expected for specific orientation relations         correspond to nA ¼ N=SG and fA ¼ N ðp=4Þ d2 SG
                                                                          .
between the precipitate and the matrix (for which the         N ðp=4Þhdi2 SG ¼ ðp=4Þhdi2 nA . The dashed lines in
interfacial strain is minimised). In TEM studies, on
                                                              Fig. 7 with a slope of m = - 2 correspond to 0.1%, 1%
bulk Fe–Cr-Co-W steels three different orientation
                                                            and 10% area fraction contours, respectively.
relations (OR1: ½101a k ½1211L , ð111Þa k 1103 L ,
                                                          Assuming an average GI precipitate height hhi that is
ð011Þa k ð0001ÞL ; OR2: ½113a k ½2110L , 110 a k 0113 L ,   proportional to its equivalent diameter hdi with a

  411 a k ð0001ÞL ; and OR3: ½011a k ½2110 , ð100Þ k
                                                L        a    scaling factor A, then the total volume VG of the GI

  0223 L , 111 a k ð0001ÞL ) have been identified for the     precipitates per unit area SG (the equivalent thickness
hexagonal Fe2W Laves phase (L) precipitates and the           of the precipitation layer on the surface if the pre-
a-Fe matrix (a) [22]. These orientations relations are        cipitates spread over the sample surface, covering it

expected to also govern the branching growth beha-            uniformly) corresponds to a ¼ VG =SG  NAhdi3 =
viour of the Fe2W surface precipitates on the bcc Fe
                                                              ðN=nA Þ ¼ Ahdi3 nA . The scaling factor A depends on
matrix.
                                                              the GI precipitate shape. The solid lines in Fig. 7 with
                                                              a slope of m = - 3 correspond to an equivalent
                                                              thickness of 0.1, 1 and 10 nm, respectively (A = p/20,
                                                              for a cylinder-shaped particle with a height of 0.2 hdi
                                                              [18]).
                                                                As indicated in the schematic diagram inserted
                                                              Fig. 7a, it is easy to determine whether the GI
J Mater Sci (2021) 56:5173–5189 5183
Figure 7 Map of the number density nA versus the average size W alloy and e W-rich precipitates in the Fe–Au–W alloy,
hdi of the GI precipitates in each grain of the three alloys after respectively. The dashed straight lines correspond to nA / hdi2
different ageing times. a Summary all the data. b–e Individual scaling behaviour (constant thickness) and the solid lines to nA /
maps for: b Au-rich precipitates in the Fe-Au alloy, c Au-rich
hdi3 scaling behaviour (shape conservation).
precipitates in the Fe–Au–W alloy, d W-rich precipitates in the Fe-5184 J Mater Sci (2021) 56:5173–5189 precipitates are in the stage of nucleation, growth, of ageing (probably in the form of a core–shell coarsening or a combination. For instance, if the structure). From 1 to 100 h, the data points follow a precipitates experienced an increase in number den- nA / hdim scaling with a slope m of -2.4(3) at 1 h, sity without a change in their size (as indicated by the -3.0(2) at 8 h, -3.2(2) at 32 h and -2.5(5) at 100 h of upward pointing green arrow), then the particles are ageing. This indicates that the precipitation beha- in the nucleation stage. If the number density keeps viour of the Au-rich is similar for the Fe–Au–W and constant and the size increases, then the precipitates the Fe-Au alloys. are growing (indicated by the right pointing purple As shown in Fig. 7d, for the W-rich precipitates in arrow). A constant area fraction (or equivalent the Fe-W alloy, from 32 to 100 h, the GI precipitates thickness) with an increase in size and a decrease in increase both in size and number density with ageing number density corresponds to a coarsening process time, indicating a combined nucleation and growth (indicated by the black arrow). process. For the Fe–Au–W alloy shown in Fig. 7e The size and distribution of the GI Au-rich pre- most of the W-rich precipitates after 32 h ageing have cipitates for the Fe-Au alloy after ageing for 8, 32 and the diameter between 0.2 and 0.4 lm, while their 100 h, respectively, are shown in Fig. 7b. By com- number densities vary by nearly two orders of mag- paring the 8 and 32 h data, it is clear that the collec- nitude. This indicates that the W-rich precipitates are tion of the data points shifted towards the right in the nucleation stage. The data points for the Fe-W bottom direction, indicating a typical coarsening alloy follow a nA / hdim scaling with a slope m of process. From 32 to 100 h, the number density of the -4(1) at 32 h and -2.6(3) at 100 h. Compared to the precipitates remains around the same level, yet the binary Fe-W alloy, the W-rich precipitates in the average size and the corresponding area fraction and ternary Fe–Au–W alloy are much smaller in size (for equivalent thickness decreased significantly, result- 32 h of ageing), but their area fraction is either similar ing from the diffusion of the Au solute towards the to or nearly one order of magnitude larger than the grain boundaries. For all the three ageing times, the precipitate area fraction in the Fe-W system. This is data points closely follow a nA / hdim scaling with a consistent with the W-rich precipitation behaviour in slope m of -3.2(3) at 8 h, -3.1(6) at 32 h and -2.3(5) the creep-failed samples [17]: the W-rich particles are at 100 h. It is therefore indicated that for shorter smaller in the Fe–Au–W alloy than in the Fe-W alloy, ageing times (B 32 h), the GI precipitates in the Fe- but the total amount of the W-rich precipitates is not Au system are likely to be shape-conserved, while suppressed. On the contrary, the W-rich precipitation after ageing for 100 h, the thickness of the precipi- in the Fe–Au–W alloy seems to be accelerated after tates seems to approach a constant value. long-time ageing: for the 100 h samples, the W-rich The characteristics of the Au-rich GI precipitates in precipitates show an average area fraction of about the Fe–Au–W alloy are shown in Fig. 7c. At an ageing 21% with an average height of about 74 nm (see time of 1 h, most of the precipitates have an equiva- Fig. 4), yielding an equivalent thickness of about lent diameter smaller than 0.3 lm, but the equivalent 15 nm. Both the area fraction and the equivalent diameter of the largest precipitate already exceeded thickness in the Fe–Au–W alloy are much larger than 1 lm, indicating that growth had occurred in some that for the Fe-W alloy. Compared to the Au-rich grains. From 1 to 8 h, the precipitates experience an precipitates, the W-rich precipitates show different obvious growth, and the precipitate area fraction and growth mechanism: after 100 h of ageing, the W-rich equivalent thickness are similar in all the grains (also precipitates in the Fe–Au–W sample follow a nA / similar to the Fe-Au counterpart). The precipitation hdim scaling with a slope m of -2.1(6), indicating that behaviour in the Fe–Au–W alloy after ageing for 32 the W-rich precipitates are plate-shaped with a rela- and 100 h is very different from the observation in tively constant thickness. Two examples are provided the Fe-Au alloy. Firstly, the precipitate size and in Fig. 8, where the W-rich precipitates with different number density show a wider distribution. In addi- in sizes and number densities in the two grains yield tion, the decrease in area fraction and equivalent similar area fractions. The lateral growth of the thickness only occurred in limited number of grains. branched surface precipitates stops when the bran- This is consistent with the observation in Fig. 1d, ches are about to make contact. Since the individual where several large GI particles remained after 100 h branched surface precipitates are sometimes difficult
J Mater Sci (2021) 56:5173–5189 5185
Figure 8 Two examples of W-rich GI precipitates in the Fe–Au– respectively) are obviously different in the two grains, while the
W alloy for an ageing time of 100 h. The equivalent sizes (5.0 and area fractions are similar (22 and 24% in a and b, respectively).
1.7 lm in a and b, respectively) and number densities of the The dashed lines in a show the partitions of precipitates.
W-rich precipitates (0.0073 and 0.0900 lm-2 in a and b,
to distinguish (indicated in Fig. 8(a)), in the grains precipitates. The 1D flux and the equivalent thickness
where they are formed, the number density of the of the precipitation layer are estimated by [23]:
precipitates may have been underestimated and the rffiffiffiffiffiffiffi
DX Dx 1 Dx DX
equivalent size overestimated. JX ¼ pffiffiffiffiffiffiffiffiffiffiffi ¼ ð2Þ
X pDX t X pt
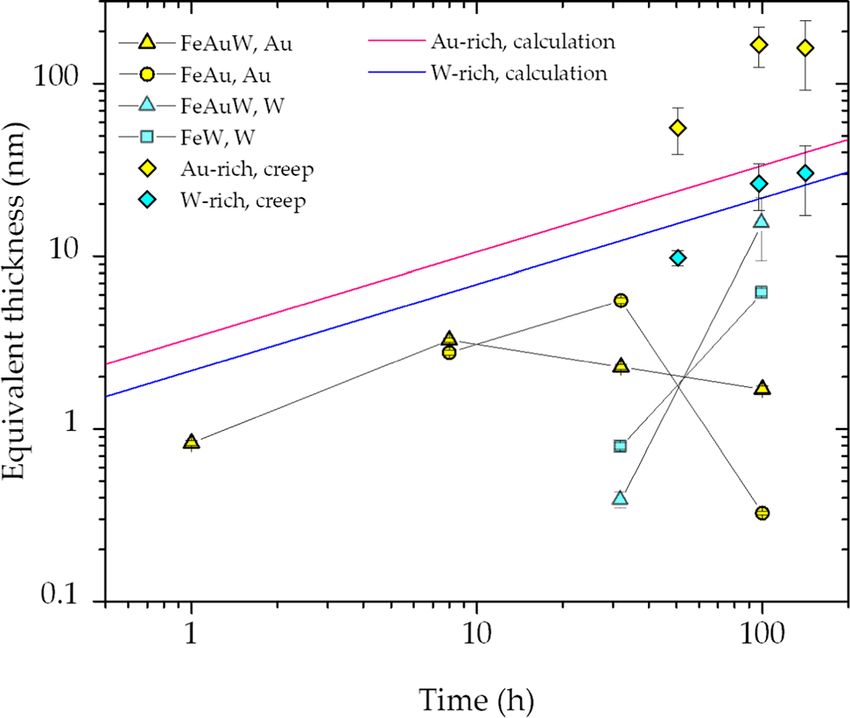
The evolution of the equivalent thickness and
of the grain-interior precipitates rffiffiffiffiffiffiffiffiffiffiffi
Zt
X 0 0 Dx 4DX t
The number density nA and equivalent diameter hdi aðtÞ ¼ JX ða; t Þdt ¼ ð3Þ
xp xp p
show for most of the GI precipitates a nA / hdim 0
scaling with a slope m of about -3, indicating a 3D where Dx ¼ x1 x1 is the supersaturation of the
shape conserving growth and coarsening (see Fig. 7). solute element X, DX is the diffusivity of the solute
It is therefore easy to obtain the equivalent thickness element in the matrix phase, X is the atomic volume, t
attributed by the GI precipitates by fitting the data in is the time and xp is the concentration of the solute
Fig. 7 with a fixed slope of m = - 3 (assuming A = p/ element in the precipitate phase.
20). The experimental results estimated by Eq. (1) and
a Ahdi3 nA ð1Þ the results calculated by Eqs. (2) and (3) are com-
pared in Fig. 9. The Au-rich GI precipitates show a
For the W-rich precipitates in the Fe–Au–W alloy similar trend in the ternary Fe–Au–W alloy as in the
after 100 h of ageing, fitting by Eq. (1) yields an binary Fe-Au alloy. In the early stage (before 32 h for
equivalent thickness of 102 nm. Since the branched the Fe-Au sample and 8 h for the Fe–Au–W system),
surface precipitates seem to have a constant thickness the thickness of the Au-rich GI precipitates shows an
(as discussed in Sect. ‘‘The evolution of the size and increase a / ta with a slope a of approximately 0.5,
site density of grain-interior precipitates’’), the indicating a diffusion-controlled process. For the W-
equivalent layer thickness of the W-rich precipitates rich precipitates, the corresponding slope a is much
is estimated by aW hfA . After 100 h of ageing, the larger than 1/2, indicating that the W-rich precipi-
average height of the W-rich precipitates corresponds tates are still in the nucleation stage. Compared to the
to h = 74 nm. W-rich GI particles in the binary Fe-W alloy, the
The surface precipitation of the solutes can be precipitates in the ternary Fe–Au–W alloy starts with
simplified into a 1D diffusion process, where the a smaller size and a higher number density nA,
solute agents diffuse towards the free surface, and yielding a lower equivalent thickness. After ageing
after reaching the surface they nucleate to form for 100 h, however, the thickness of the W-rich5186 J Mater Sci (2021) 56:5173–5189
significant amount of excess vacancies and disloca-
tions are generated by the deformation [25, 26], which
enhances the diffusion of the solutes. (2) for surface
precipitation only a fraction of the solutes diffuses
towards the grain-interior free surface directly, as the
rest of the solutes are attracted by the nearby grain
boundaries, through which the solutes can reach the
free surface (indirect route with different diffusion
rates). Assuming the solutes choose the shortest dif-
fusion path (to either the nearest grain boundary or
the nearest free surface), then GI precipitates would
no longer form after the diffusion length reaches half
of the grain size. For average grain sizes of 84 lm (Fe-
Au sample) and 105 lm (Fe–Au–W sample), the
newly-nucleated Au-rich GI precipitates are not
expected to form any longer after about 500 h and
Figure 9 Equivalent thickness of the GI precipitation layer a for 800 h ageing, respectively.
the three alloys as a function of ageing time t. The solid lines are
pffiffiffi pffiffiffiffiffiffiffiffiffi
calculated by aðtÞ ¼ ð2= pÞ Dx xp DX t, where Dx is the Linking the surface precipitation
supersaturated solute fraction, xp the solute fraction in the to the creep cavity precipitation
precipitate and DX the solute (volume) diffusivity of element X.
The experimental data are obtained from Fig. 7 assuming The external free surface precipitation bears great
3
nA / hdi . The scattered data points are creep results from a resemblance to the formation of precipitates on the
previous research on Fe–Au–W system [17]. surface of the internal creep cavities as formed in
creep experiments. In a previous study on the Fe-Au
precipitation in the Fe–Au–W system exceeded that system [18], the growth rate of the Au-rich precipi-
in the Fe-W system by nearly three times, indicating tates on the external free surface was found to be
that the W diffusion in the Fe–Au–W system is comparable to that on the internal free surface of a
accelerated for longer ageing times. The acceleration creep-induced cavity. By comparing the present
phenomenon may result from the depletion of study with the creep results for the Fe–Au–W alloy
supersaturated Au solute. At 700 °C, the diffusivity [17], similarities are observed in terms of the size and
of Au is two orders of magnitude higher than that of distribution of the precipitates and the interplay
W, so that the depletion of Au is much faster. With between the two solutes. In the Fe–Au–W alloy, the
the diffusion of Au towards the surface, a shrinkage Au-rich and W-rich precipitates are found to form in
is generated in the Au-depleted matrix, due to the contact to each other, yielding a sandwich-like
size difference between the Au and Fe atoms. The structure, for surface conditions (present work) and
resulting elastic tensile strain field may cause an for creep conditions (ref. [17]). In the Fe–Au–W alloy
enhanced diffusion of W [24]. and the Fe-Au alloy, the evolution of the Au-rich GI
The scattered data on the right top corner cor- precipitates (the ones not connected to grain bound-
responds to the equivalent thickness of the aries) is similar, indicating that the addition of W
particles from the creep experiment [17]. The creep does not seem to have a strong influence on the
experiments were performed at 550 °C. For com- kinetics of solute Au. Similar results were obtained
parison, the data in Fig. 9 were normalised using under the creep conditions, where the size evolution
Eq. (3), i.e. by applying a scaling factor of the Au-rich precipitates is comparable in the Fe–
qffiffiffiffiffiffiffiffi qffiffiffiffiffiffiffiffi
aT1 aT2 ¼ xTp 2 DxT1 DTX1 xTp 1 DxT2 DTX2 . It is Au–W alloy [17] and the Fe-Au alloy [13]. The pre-
cipitation behaviour of the W-rich GI precipitates is,
clear that the equivalent thicknesses of both the Au- however, significantly different in the Fe–Au–W alloy
rich and W-rich precipitates are systematically higher compared to the Fe-W alloy. In the present research,
under the creep conditions. Two reasons are expected it is observed that the W-rich GI precipitates in the
to be responsible for the difference: (1) During creep a Fe–Au–W alloy start with a smaller size and largerJ Mater Sci (2021) 56:5173–5189 5187
Figure 10 Terraces generated after the nucleation of Au-rich GI precipitates on the surfaces of a Fe-Au and b Fe–Au–W alloy samples.
number density, but the overall diffusion flux is not Another difference between the two conditions is
reduced for longer ageing times. The creep experi- the diffusivity of the solutes. As indicated in Fig. 9
ments show similar results: the W-rich precipitates and discussed in ‘‘The evolution of the equivalent
formed in the creep-induced cavities show smaller thickness of the grain-interior precipitates’’ section
sizes and a higher number density in the Fe–Au–W the diffusion of both Au and W solutes are enhanced
alloy [17] compared to the Fe-W alloy [12], indicating under the creep condition, due to the deformation-
that more nucleation sites are available for W-rich induced excess vacancies and dislocations. The
precipitation in the Fe–Au–W alloy (both under sur- overall deformation-enhanced diffusivity of element
face and creep conditions). One explanation may be X (either solute or host) corresponds to [25, 26]:
the increased roughness that is generated with the DX ¼ ð1 gÞDV P
X þ gDX
depletion of the supersaturated Au solute from the
¼ ð1 gÞDX ð1 þ xex
L th P
V xV ÞþgDX ð5Þ
underlying matrix. As discussed in ‘‘The evolution of
the equivalent thickness of the grain-interior precip- in which DLX is the lattice diffusivity, DV X is the
itates’’ section, the continuous depletion of Au results
solute diffusivity induced by the vacancies, DPX is the
in a shrinkage of the matrix and strains resulting
dislocation-induced pipe diffusivity, xex V is the con-
from local gradients in the solute Au concentration, th
centration of the excess vacancies, xV is the concen-
which further leads to a re-organisation of the surface
tration of the vacancies under thermal equilibrium
atoms into terraces (examples are shown in Fig. 10).
condition, and the factor g corresponds to the fraction
Therefore, more nucleation sites are available for the
of atoms associated with the pipe. Since the produc-
W-rich precipitates in the ternary system, which
tion rate of the excess vacancies is proportional to the
causes a higher nucleation rate together with the
strain rate, at the strain rates as low as (2–
enhanced diffusivity. An estimation of the healing
7) 9 10–5 h-1 [17], the pipe diffusion is mainly
kinetics in [17] also indicated that the W diffusion is
responsible for the diffusion enhancement and Eq. (5)
not suppressed in the relevant creep cavities.
One difference between the surface precipitation can be simplified to DX ¼ gDPX . At 823 K (550 °C), the
and the creep-cavity precipitation is the shape of the Fe self-diffusivity in bcc iron is 1.5 9 10–21 m2s-1,
precipitates. Under surface conditions, the aspect while the self-diffusivity along dislocations corre-
ratio of the Au-rich GI precipitates varies from 1.2 sponds to about 10–15 m2s-1 [27]. For self-diffusion,
(nearly round) to about 12, while for the Fe–Au–W assuming g ¼ pb2 q, in which b and q are the burger’s
alloy the W-rich GI precipitates develop into bran- vector and the dislocation density, and taken as
ched surface precipitates after long ageing. However, 2.58 Å and 1014 m-2, respectively. The enhanced
under creep conditions, the shapes of both the Au- diffusivity is then estimated to be about 28 times
rich and W-rich precipitates are constrained by the larger than the lattice diffusivity, resulting in an
shape of the creep cavity, so that the Au-rich pre- equivalent thickness of about 5 times bigger than
cipitates with a high aspect ratio and the W-rich under surface conditions. For higher strain rates (e.g.
branched surface precipitates are not likely to form. for the Fe-Au [7, 13] and Fe-W [12] systems) where
the diffusion through the excess vacancies can no5188 J Mater Sci (2021) 56:5173–5189
longer be neglected, a stronger enhancement in dif- Creative Commons licence, and indicate if changes
fusivity may be expected. were made. The images or other third party material
in this article are included in the article’s Creative
Commons licence, unless indicated otherwise in a
Conclusions credit line to the material. If material is not included
in the article’s Creative Commons licence and your
The precipitation of supersaturated solutes at free intended use is not permitted by statutory regulation
surfaces was studied in a ternary Fe-3Au-4W alloy or exceeds the permitted use, you will need to obtain
and two binary Fe-3Au and Fe-4W counterpart permission directly from the copyright holder. To
alloys. The surface precipitation can be categorised view a copy of this licence, visit http://creativecom
into GI precipitates (not connected to grain bound- mons.org/licenses/by/4.0/.
aries) or GB precipitates. The Au-rich GI precipitates
show a 3D shape-conserving growth before they are
collected by the grain boundaries, while the W-rich References
Laves phase precipitates, which are relatively
immobile once nucleated on the surface, are found to [1] Van der Zwaag S (2007) Self healing materials: an alterna-
grow laterally with a relative constant thickness. The tive approach to 20 centuries of materials science. Springer,
Au-rich GI precipitates are similar in terms of their Netherlands
size and kinetics to those for the ternary Fe–Au–W [2] Hager MD, Greil P, Leyens C, van der Zwaag S, Schubert
and binary Fe-Au systems. However, the W-rich GI US (2010) Self-healing materials. Adv Mater
precipitates in the Fe–Au–W system show a smaller 22(47):5424–5430. https://doi.org/10.1002/adma.201003036
starting size, a higher number density and an overall [3] Van Dijk NH, van der Zwaag S (2018) Self-healing phe-
faster kinetics compared to the binary Fe-W system. nomena in metals. Adv Mater Interfaces 5(17):1800226. h
ttps://doi.org/10.1002/admi.201800226
While the precipitation on the free surface showed an
[4] Laha K, Kyono J, Kishimoto S, Shinya N (2005) Beneficial
overall slower diffusivity than during creep condi-
effect of B segregation on creep cavitation in a type 347
tions, the surface precipitation experiments can
austenitic stainless steel. Scr Mater 52(7):675–678. https://d
qualitatively predict the healing of the creep-induced
oi.org/10.1016/j.scriptamat.2004.11.016
grain boundary cavities in terms of the interplay
[5] Lumley RN, Morton AJ, Polmear IJ (2002) Enhanced creep
between multiple solutes in the matrix and the
performance in an Al-Cu-Mg-Ag alloy through underageing.
resulting solute diffusivities, precipitate nucleation
Acta Mater 50:3597–3608. https://doi.org/10.1016/S1359-6
rates and the precipitate size distributions.
454(02)00164-7
[6] Zhang S, Kwakernaak C, Sloof W, Brück E, van der Zwaag
Acknowledgements S, van Dijk NH (2015) Self healing of creep damage by gold
precipitation in iron alloys. Adv Eng Mater 17(5):598–603. h
The authors thank Haixing Fang and Paula Martin ttps://doi.org/10.1002/adem.201400511
Rojo for assistance with the experimental work. Y. Fu [7] Zhang S, Kwakernaak C, Tichelaar FD, Sloof WG, Kuzmina
acknowledges the financial support provided by M, Herbig M, Raabe D, Brück E, van der Zwaag S, van Dijk
China Scholarship Council (CSC). NH (2015) Autonomous repair mechanism of creep damage
in Fe-Au and Fe-Au-B-N Alloys. Metall Mater Trans A
Compliance with ethical standards 46(12):5656–5670. https://doi.org/10.1007/s11661-015-316
9-9
Conflict of interest The authors declare that they [8] Lumley RN, Polmear IJ (2007) Advances in self healing of
have no conflict of interest. metals. In: Paper presented at the Proceedings of the First
International Conference on Self Healing Materials, Noord-
Open Access This article is licensed under a Crea-
wijk aan Zee, Netherlands
tive Commons Attribution 4.0 International License,
[9] Shinya N (2008) Self-healing of metallic materials: self-
which permits use, sharing, adaptation, distribution
healing of creep cavity and fatigue cavity/crack. In: Ghosh
and reproduction in any medium or format, as long
SK (ed) Self-healing materials: fundamentals, design stra-
as you give appropriate credit to the original
gegies, and applications. Wiley, Hoboken, pp 219–250
author(s) and the source, provide a link to theJ Mater Sci (2021) 56:5173–5189 5189
[10] Zhang S, Cizek J, Yao Z, Oleksandr M, Kong X, Liu C, van Au alloys to its self-healing potential during creep loading.
Dijk NH, van der Zwaag S (2019) Self healing of radiation- Metall Mater Trans A 48(5):2109–2114. https://doi.org/10.
induced damage in Fe–Au and Fe–Cu alloys: combining 1007/s11661-017-4025-x
positron annihilation spectroscopy with TEM and ab initio [19] Chen Y, Fang XY, Brechet Y, Hutchinson CR (2014) Surface
calculations. J Alloys Comp 817:152765. https://doi.org/10. precipitation on engineering alloys. Acta Mater 81:291–303.
1016/j.jallcom.2019.152765 https://doi.org/10.1016/j.actamat.2014.08.044
[11] Laha K, Kyono J, Sasaki T, Kishimoto S, Shinya N (2005) [20] Vijayakumar H, Sriramamurthy AH, Nagender Naidu SV
Improved creep strength and creep ductility of type 347 (1988) Calculated phase diagrams of Cu-W, Ag-W and Au-
austenitic stainless steel through the self-healing effect of W binary systems. Calphad 12:177–184. https://doi.org/10.
boron for creep cavitation. Metall Mater Trans A 1016/0364-5916(87)90034-4
36a(2):399–409. https://doi.org/10.1007/s11661-005-0311-0 [21] Zhang R-F, Shen Y-X, Kong L-T, Lai W-S, Liu B-X (2004)
[12] Fang H, Szymanski N, Versteylen CD, Cloetens P, Kwak- Metastable phase selection of an immiscible Au–W System
ernaak C, Sloof WG, Tichelaar FD, Balachandran S, Herbig studied by ab initio calculation, molecular dynamics simu-
M, Brück E, van der Zwaag S, van Dijk NH (2019) Self lation and ion-beam mixing. Jpn J Appl Phys 43:7648–7653.
healing of creep damage in iron-based alloys by supersatu- https://doi.org/10.1143/jjap.43.7648
rated tungsten. Acta Mater 166:531–542. https://doi.org/10. [22] Yamamoto K, Kimura Y, Mishima Y (2004) Orientation
1016/j.actamat.2019.01.014 relationships of icosahedral quasicrystalline phase and Laves
[13] Fang H, Versteylen CD, Zhang S, Yang Y, Cloetens P, Ngan- phase precipitates in a ferritic alloy. Mater Trans
Tillard D, Brück E, van der Zwaag S, van Dijk NH (2016) 45:2598–2601. https://doi.org/10.2320/matertrans.45.2598
Autonomous filling of creep cavities in Fe-Au alloys studied [23] Versteylen CD, Szymański NK, Sluiter MHF, van Dijk NH
by synchrotron X-ray nano-tomography. Acta Mater (2018) Finite element modelling of creep cavity filling by
121:352–364. https://doi.org/10.1016/j.actamat.2016.09.023 solute diffusion. Philos Mag 98(10):864–877. https://doi.org/
[14] He SM, van Dijk NH, Schut H, Peekstok ER, van der Zwaag 10.1080/14786435.2017.1418097
S (2010) Thermally activated precipitation at deformation- [24] Jang J-W, Kwon J, Lee B-J (2010) Effect of stress on self-
induced defects in Fe-Cu and Fe-Cu-B-N alloys studied by diffusion in bcc Fe: an atomistic simulation study. Scr Mater
positron annihilation spectroscopy. Phys Rev B 63(1):39–42. https://doi.org/10.1016/j.scriptamat.2010.02.
81(9):094103. https://doi.org/10.1103/PhysRevB.81.094103 045
[15] van der Zwaag S, Brinkman E (2015) Self healing materials: [25] Militzer M, Sun WP, Jonas JJ (1994) Modelling the effect of
pioneering research in the Netherlands. IOS Press, deformation-induced vacancies on segregation and precipi-
Amsterdam tation. Acta Metall Mater 42(1):133–141. https://doi.org/10.
[16] Zhang S, Fang H, Gramsma ME, Kwakernaak C, Sloof WG, 1016/0956-7151(94)90056-6
Tichelaar FD, Kuzmina M, Herbig M, Raabe D, Brück E, [26] Song SH, Chen XM, Weng LQ (2011) Solute diffusion
van der Zwaag S, van Dijk NH (2016) Autonomous filling of during high-temperature plastic deformation in alloys. Mater
grain-boundary cavities during creep loading in Fe-Mo Sci Eng A 528(24):7196–7199. https://doi.org/10.1016/j.ms
alloys. Metall Mater Trans A 47(10):4831–4844. https://doi. ea.2011.06.015
org/10.1007/s11661-016-3642-0 [27] Shima Y, Ishikawa Y, Nitta H, Yamazaki Y, Mimura K,
[17] Fu Y, Kwakernaak C, Sloof WG, Tichelaar FD, Brück E, Isshiki M, Iijima Y (2002) Self-diffusion along dislocations
Van der Zwaag S, van Dijk NH (2020) Competitive healing in ultra high purity iron. Mater Trans 43(2):173–177. http
of creep-induced damage in a ternary Fe-3Au-4W alloy. s://doi.org/10.2320/matertrans.43.173
Metall Mater Trans A 51:4442–4455. https://doi.org/10.100
7/s11661-020-05862-6 Publisher’s Note Springer Nature remains neutral with
[18] Sun WW, Fang H, van Dijk NH, van der Zwaag S, regard to jurisdictional claims in published maps and
Hutchinson CR (2017) Linking surface precipitation in Fe- institutional affiliations.You can also read