Well below 2 C: Mitigation strategies for avoiding dangerous to catastrophic climate changes - PNAS
←
→
Page content transcription
If your browser does not render page correctly, please read the page content below
PERSPECTIVE

                                                                                                                                                                                                            PERSPECTIVE
                                        Well below 2 °C: Mitigation strategies for avoiding
                                        dangerous to catastrophic climate changes
                                        Yangyang Xua,1 and Veerabhadran Ramanathanb,1

                                        Edited by Susan Solomon, Massachusetts Institute of Technology, Cambridge, MA, and approved August 11, 2017 (received for review
                                        November 9, 2016)

                                        The historic Paris Agreement calls for limiting global temperature rise to “well below 2 °C.” Because of
                                        uncertainties in emission scenarios, climate, and carbon cycle feedback, we interpret the Paris Agree-
                                        ment in terms of three climate risk categories and bring in considerations of low-probability (5%) high-
                                        impact (LPHI) warming in addition to the central (∼50% probability) value. The current risk category of
                                        dangerous warming is extended to more categories, which are defined by us here as follows: >1.5 °C as
                                        dangerous; >3 °C as catastrophic; and >5 °C as unknown, implying beyond catastrophic, including
                                        existential threats. With unchecked emissions, the central warming can reach the dangerous level
                                        within three decades, with the LPHI warming becoming catastrophic by 2050. We outline a three-
                                        lever strategy to limit the central warming below the dangerous level and the LPHI below the cata-
                                        strophic level, both in the near term (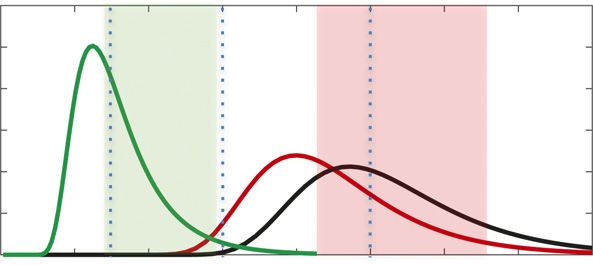
Box 1. The Non-CO2 Climate Pollutants
                                         The first category is SLCPs, which include GHGs such as methane, tropospheric ozone, HFCs, and aerosols such as BC, and coe-
                                         mitted OC. The lifetimes of these pollutants range from days (BC and OC), to months (tropospheric ozone), to about a decade
                                         (methane and HFCs), which explains the term “short-lived” in SLCPs. The second category of non-CO2 climate pollutants includes
                                         LLGHGs such as N2O and halocarbons other than HFCs (e.g., CFCs, HCFCs). Our model is forced by IPCC historical forcing of all non-
                                         CO2 gases and aerosols. The third category of non-CO2 climate pollutants is cooling aerosols (other than BC and OC) such as
                                         sulfates, nitrates, and dust. It should be noted that those cooling aerosols, along with the BC and OC aerosols included under SLCPs,
                                         are the major source of air pollution, leading to about 7 million deaths annually (31).
                                             Box 1 Figure shows the individual contribution of CO2, SLCPs, and cooling aerosols (other than those included in SLCPs) to the
                                         transient warming during the 20th and 21st centuries. All of the warming trends are relative to preindustrial temperatures. By 2015, the
                                         warming due to CO2 is about 0.8 °C and that due to SLCPs is about 1.1 °C. The sum of the CO2 and SLCP warming is already close to
                                         the Paris Agreement limit of 2 °C by 2015. On the other hand, the aerosols have a cooling (“masking”) effect of about −0.9 °C. When
                                         we add the sum of the CO2, SLCPs, and aerosol effects to the warming due to non-CO2 LLGHGs, the estimated warming by 2015 is
                                         ∼1.1 °C (black curve in Box 1 Figure), which can be compared with the observed warming of about 1 °C (SI Appendix, Fig. S1). The
                                         main inference from Box 1 Figure is that CO2 and SLCPs have exerted comparable warming effects (0.8 °C and 1.1 °C) to the past,
                                         while the aerosol masking effect is also comparable in magnitude but of opposite sign, with a cooling of −0.9 °C.

                                                                                                   5
                                                                                                                Transient Warming as in Baseline-fast
                                                                                                                due to CO2 only
                                                                                                   4            due to aerosol only
                                                                          Warming since 1900 (K)

                                                                                                                due to SLCPs only

                                                                                                   3

                                                                                                   2

                                                                                                   1

                                                                                                   0

                                                                                                   -1
                                                                                                            1       2      3       4        5         6
                                                                                                        Cumulative Emission since 1750 (Tt CO2)
                                         Box 1 Figure. Simulated transient warming (°C) following the baseline-fast scenario, as a function of the cumulative emission of CO2
                                         (x axis; black line). The decades at which each additional trillion tons of CO2 was emitted and the corresponding CO2 concentration
                                         are shown at the top. The red, blue, and green lines illustrate transient simulated warming due to CO2, cooling aerosols, and SLCPs
                                         only, respectively.

                                        Projected Warming in the Absence of Climate Policies                                    model and the climate model simulations have been extensively
                                        A convenient place to start the discussion is the projected                             validated by comparison with observations of atmospheric CO2
                                        warming in the absence of climate policies. Determining this                            (7) (SI Appendix, Figs. S1 and S2), global mean temperature (8),
                                        baseline warming sets the stage for exploring and justifying mit-                       ocean heat content (box 1 of ref. 7), and sea-level rise (figure 2 of
                                        igation pathways. Published future CO2 emission scenarios (1, 4),                       ref. 9), as well as by comparison with published projections from
                                        along with historical emissions, are fed into a carbon cycle model                      3D global climate model simulations (9, 10).
                                        to estimate the CO2 concentration during the 20th and 21st                                  The projected warming (relative to 1900) at 2050 and 2100 is
                                        centuries (SI Appendix, Figs. S1 and S2). The calculated CO2                            shown in Fig. 1, under the two baseline emission scenarios in the
                                        concentration is used to estimate its climate forcing (SI Appendix,                     absence of climate policy during the 21st century. The temporal
                                        Figs. S4 and S6). For climate forcing due to other atmospheric                          evolution of CO2 emissions, CO2 concentrations, and global av-
                                        compositions, we adopted the Intergovernmental Panel on Cli-                            erage temperatures are shown in SI Appendix, Fig. S1. To gen-
                                        mate Change (IPCC)-derived historical values (Box 1) and future                         erate the probability distribution curves shown in Fig. 1 (as well as
                                        projections (SI Appendix, Fig. S6). The temperature response is                         in SI Appendix, Figs. S3, S9, and S10), temperature under each
                                        estimated with an energy balance climate model (SI Appendix,                            scenario is simulated with 1,500 stochastic runs to cover the full range
Downloaded by guest on April 18, 2021

                                        section 1). In a series of published studies (7–10), the carbon cycle                   of climate sensitivity involving feedback related to water vapor, clouds,

                                        10316 | www.pnas.org/cgi/doi/10.1073/pnas.1618481114                                                                                          Xu and Ramanathan
A 1.6 B 0.8
Baseline-fast Baseline-fast
1.4 Baseline-fast (Carbon-cycle Feedback) 0.7 Baseline-fast (Carbon-cycle Feedback)
Baseline-default Baseline-default
Probability density ( o C) -1
Probability density ( o C) -1
1.2 0.6 Baseline-fast (Aerosol Uncertainty)
1 0.5
0.8 0.4
0.6 0.3
0.4 0.2
0.2 0.1
0 0
1 1.5 2 2.5 3 3.5 4 4.5 1 2 3 4 5 6 7 8 9 10
o o
2050 Warming( C) 2100 Warming( C)
Fig. 1. Probability density function of projected warming for 2050 (A) and 2100 (B) for the baseline-fast (thick red line) and baseline-default (thick
black line) scenarios. The base year for the warming estimates is 1900. The red dashed line shows the projection forced by the baseline-fast
CO2 emission, but a positive carbon cycle feedback due to the ocean and land carbon uptake reduction is included. The blue dashed line in
B shows the projection in which the aerosol forcing uncertainty is considered as well.
and snow/ice albedo (SI Appendix, section 1), hereafter referred to as the periods between 1986–2005 and 2081–2100 (13). Since this
climate physical-dynamical feedback. The projected warming is shown study attempts to evaluate the extreme outcomes consistent with
for two baseline emission scenarios proposed by the IPCC (4): data and published model parameters, we also examine the LPHI
baseline-fast and baseline-default. The baseline-fast scenario assumes (5% probability) values. The LPHI warming under the two baseline
an aggressive 80% reduction in the energy intensity of the economy scenarios can exceed 3.5–4 °C by 2050 and 6.5–8 °C by 2100
(still using fossil fuels) compared with the 2010 energy intensity. The (Fig. 1). Note that the 5–95% range in the projected warming
baseline-default scenario adopts the current rate of reduction in en- due to emission uncertainties within each baseline scenario is
ergy intensity until 2100, achieving a 50% reduction from the less than 0.3 °C for 2050 and ∼0.7–1 °C for 2100 (red shading in
2010 level. The two baseline emission trajectories, along with the SI Appendix, Fig. S1).
corresponding 5–95% range within each scenario (shading in SI Ap- The warming probability distribution shown in Fig. 1 (and
pendix, Fig. S1), capture expert projections for a plausible range of elsewhere in this paper) is due to the wide range of uncertainties
future emissions in the absence of climate policies. in modeling the climate feedbacks (14). The upper range of
In what follows, the analyses rely mainly on the central (50%) warming projection, with a probability of less than 5% (Figs. 1 and
and LPHI (upper 5%) values of the probability distribution shown 2), may appear unrealistically large, but this may not be the case.
in Fig. 1 and elsewhere. So, we first comment on how the present Here, we choose to use a high range of climate sensitivity because
model compares with published studies on the central and upper some studies have suggested that 3D climate models have
5% probability climate sensitivities. The central (50%) value of underestimated three major positive climate feedbacks: positive
equilibrium climate sensitivity adopted in our model is 3 °C for a ice albedo feedback from the retreat of Arctic sea ice (15), positive
doubling of CO2 and is consistent with the published 30-model cloud albedo feedback from retreating storm track clouds in mid-
mean value of 3.2 °C in the most recent IPCC report (11). The latitudes (16, 17), and positive albedo feedback by the mixed-phase
transient climate response of this model to a gradual increase in
CO2 is also within 10% of the IPCC 30-model mean values (more
Probability density ( o C) -1
elaboration on the validation of the climate sensitivity is provided
in SI Appendix, section 3). The 5% probability values (Fig. 2 and SI 1
Appendix, Figs. S9 and S10) are about 45–50% higher than the
central value, and these are also consistent with published values for 0.8
the 95% percentile of climate model values. For example, among the 0.6
30 models assessed in the IPCC report, the central value of climate
0.4
sensitivity is 3.2 °C, while two of the 30 models yield a sensitivity of
4.5 °C and 4.7 °C (about 40–46% higher than the central value). 0.2
The primary inference from Fig. 1 and SI Appendix, Fig. S1 is 0
the following: There is a 50% probability of 2.4 (baseline-fast)– 0 1 2 3 4 5 6 7 8
2.6 °C (baseline-default) warming in the near term (2050) and 4.1–
2100 Warming(o C)
5 °C warming by 2100. For the rest of this discussion, the lower
value represents the baseline-fast scenario and the upper value Fig. 2. Probability density function of projected warming in 2100 for
represents the baseline-default scenario. In evaluating the 50% the baseline-default, baseline-fast, and Target-WB2C (CN2030 +
SLCP2020 + CES1t) scenarios. The green and red color shading
probability, we assumed both baseline scenarios are equally proba-
shows the 50–95% range of the projection for the Target-WB2C and
ble as there is no prior basis for choosing one over the other. The baseline-fast scenarios due to uncertainty in climate sensitivity. The
warming range of 4.1–5 °C at 2100 (since 1900) compares favorably vertical dotted lines indicate the range of the three risk categories as
Downloaded by guest on April 18, 2021
with the published estimates of 4.9 °C warming (12) and 3.7 °C for defined in this study.
Xu and Ramanathan PNAS | September 26, 2017 | vol. 114 | no. 39 | 10317(water and ice) clouds (18) (more discussion is provided in SI Ap- Assigning Climate Risks. Following the societal risk character-
pendix, section 5). The potential underestimation of these feed- ization as defined in Box 2, the projected warming trends in Fig. 1
backs, along with the positive carbon cycle feedback to be described for the two scenarios without climate policies fall under the fol-
below, persuaded us to show the warming distribution (Figs. 1 and lowing risk categories.
2 and SI Appendix) for low probabilities much less than 5%. Again, Near term (1.5 °C), with the
bability less than 5% for rest of the mitigation analyses. LPHI warming reaching catastrophic levels (>3 °C).
Thus far, the thick curves in Fig. 1 and SI Appendix, Fig. S1 Long term (>2050). Within eight decades, the warming has a
capture the uncertainties in the emissions scenarios and in the 50% probability of subjecting the global population to cata-
model treatment of climate physical-dynamical feedback. There strophic (>3 °C) to unknown risks (>5 °C) and a 5% probability of
are two other major sources of uncertainties: being fully in the unknown risk category, which also includes ex-
istential threats for everyone.
i) Aerosol radiative forcing uncertainties and their entanglement
with climate sensitivity estimate (19). These uncertainties, Mitigation Criteria for Warming. The meaning of the phrase
when included in the probability distribution shown in Fig. “well below 2 °C” was not adequately defined in the Paris Agree-
1B (blue dashed line), would slightly change the skewed dis- ment. A hint was given through the aspirational goal of limiting the
tribution of the projected warming. warming to “below 1.5 °C.” Using the probability approach, we
ii) Biogeochemical feedback between climate change and the car- propose that mitigation measures attempting to limit the warming to
bon cycle. Different climate-carbon feedbacks, all of which am- WB2C must consider adopting the following criteria: (i) The warming
plify the warming, are considered below. The first feedback should be limited to below dangerous levels with at least a 50%
deals with the decrease in the oceanic and land uptake of car- probability; (ii) in addition, the LPHI warming should be limited to
bon with warming, the second is the release of soil carbon due below catastrophic levels; and (iii) instead of stabilizing at 1.5 °C or
to the thawing of the permafrost, and the third is the increase in 2 °C, the warming must begin to decrease with time before the end
carbon emission (as CO2 and methane) from wetlands (20). of the 21st century. In other words, we must bend the warming curve
Recent studies using 3D climate models coupled with a bio- by the end of the century. Why is this criterion for bending the
geochemistry component have systemically examined the warming curve important? The Eemian period of 130,000 years ago
carbon cycle response to future warming (21), which revealed was an interglacial period similar to the present and was warmer by
the following: Modeling uncertainties introduce a −16% to ∼1 °C. It was associated with a 6- to 9-m rise in sea level (26), which
13% uncertainty range in the cumulative emission (as of 2100), suggests that a warming of 1.5 °C or more sustained over centuries
can cause a catastrophic sea level rise.
climate-carbon feedback on the carbon uptake by land and
oceans introduces a 6–27% increase in the cumulative emissions
Time Constraints. The near-term (Box 2. Risk Categorization of Climate Change to Society
The United Nations Framework Convention on Climate Change coined the phrase “dangerous anthropogenic interference” (DAI)
with the climate system. The DAI phrase spurred quite a bit of research on what climate change means for society and the ecosystem
(45). Subsequently, in 2001, the IPCC (46) came up with the burning embers diagram, in which it categorized climate risks under five
reasons for concern (RFCs) that ranged from risks to natural systems, risks of extreme weather events, distribution of impacts between
regions of the world, aggregate impacts, and risks of large-scale discontinuities. In the burning embers diagram, risks under each RFC
were ranked based on the warming magnitude. For what follows, we adopt the most recent version of DAI analysis (47). At 2 °C, risks
for two RFCs were designated as high, while at 4 °C, all RFCs were ranked as a high-risk category, with two of them ranked as very
high. The burning embers diagram does not extend beyond 5 °C.
We are proposing the following extension to the DAI risk categorization: warming greater than 1.5 °C as “dangerous”; warming
greater than 3 °C as “catastrophic?”; and warming in excess of 5 °C as “unknown??,” with the understanding that changes of this
magnitude, not experienced in the last 20+ million years, pose existential threats to a majority of the population. The question mark
denotes the subjective nature of our deduction and the fact that catastrophe can strike at even lower warming levels. The justifi-
cations for the proposed extension to risk categorization are given below.
From the IPCC burning embers diagram and from the language of the Paris Agreement, we infer that the DAI begins at warming
greater than 1.5 °C. Our criteria for extending the risk category beyond DAI include the potential risks of climate change to the
physical climate system, the ecosystem, human health, and species extinction. Let us first consider the category of catastrophic (3 to
5 °C warming). The first major concern is the issue of tipping points. Several studies (48, 49) have concluded that 3 to 5 °C global
warming is likely to be the threshold for tipping points such as the collapse of the western Antarctic ice sheet, shutdown of deep
water circulation in the North Atlantic, dieback of Amazon rainforests as well as boreal forests, and collapse of the West African
monsoon, among others. While natural scientists refer to these as abrupt and irreversible climate changes, economists refer to them
as catastrophic events (49).
Warming of such magnitudes also has catastrophic human health effects. Many recent studies (50, 51) have focused on the direct
influence of extreme events such as heat waves on public health by evaluating exposure to heat stress and hyperthermia. It has been
estimated that the likelihood of extreme events (defined as 3-sigma events), including heat waves, has increased 10-fold in the recent
decades (52). Human beings are extremely sensitive to heat stress. For example, the 2013 European heat wave led to about
70,000 premature mortalities (53). The major finding of a recent study (51) is that, currently, about 13.6% of land area with a pop-
ulation of 30.6% is exposed to deadly heat. The authors of that study defined deadly heat as exceeding a threshold of temperature as
well as humidity. The thresholds were determined from numerous heat wave events and data for mortalities attributed to heat waves.
According to this study, a 2 °C warming would double the land area subject to deadly heat and expose 48% of the population. A 4 °C
warming by 2100 would subject 47% of the land area and almost 74% of the world population to deadly heat, which could pose
existential risks to humans and mammals alike unless massive adaptation measures are implemented, such as providing air condi-
tioning to the entire population or a massive relocation of most of the population to safer climates.
Climate risks can vary markedly depending on the socioeconomic status and culture of the population, and so we must take up the
question of “dangerous to whom?” (54). Our discussion in this study is focused more on people and not on the ecosystem, and even
with this limited scope, there are multitudes of categories of people. We will focus on the poorest 3 billion people living mostly in
tropical rural areas, who are still relying on 18th-century technologies for meeting basic needs such as cooking and heating. Their
contribution to CO2 pollution is roughly 5% compared with the 50% contribution by the wealthiest 1 billion (55). This bottom 3 billion
population comprises mostly subsistent farmers, whose livelihood will be severely impacted, if not destroyed, with a one- to five-year
megadrought, heat waves, or heavy floods; for those among the bottom 3 billion of the world’s population who are living in coastal
areas, a 1- to 2-m rise in sea level (likely with a warming in excess of 3 °C) poses existential threat if they do not relocate or migrate. It
has been estimated that several hundred million people would be subject to famine with warming in excess of 4 °C (54). However,
there has essentially been no discussion on warming beyond 5 °C.
Climate change-induced species extinction is one major concern with warming of such large magnitudes (>5 °C). The current rate
of loss of species is ∼1,000-fold the historical rate, due largely to habitat destruction. At this rate, about 25% of species are in danger
of extinction in the coming decades (56). Global warming of 6 °C or more (accompanied by increase in ocean acidity due to increased
CO2) can act as a major force multiplier and expose as much as 90% of species to the dangers of extinction (57).
The bodily harms combined with climate change-forced species destruction, biodiversity loss, and threats to water and food
security, as summarized recently (58), motivated us to categorize warming beyond 5 °C as unknown??, implying the possibility of
existential threats. Fig. 2 displays these three risk categorizations (vertical dashed lines).
further decreased to near-zero growth (−0.2% per year) for 2015. The other long-lived GHG (LLGHG) with nonnegligible forcing
This near-zero growth rate continued into 2016 (2). The low to is nitrous oxide (N2O) (SI Appendix, Fig. S6). Its current forcing is
near-zero growth rate since 2014 is due to a combination of ∼0.15 watts per square meter (Wm−2) and is projected to increase
several factors: switching from coal to oil and natural gas; an in- to 0.23 Wm−2 by 2100 (SI Appendix, Fig. S6). Its net contribution
crease in production of renewable energy such as nuclear (1.3%),
to the warming from 2010 to 2100 is only about 0.1 °C (50%
hydro (1%), and wind and solar (15%); and a reduction in carbon
probability). Given the small size of its warming from the present
intensity of the economy. The negative growth rate from the
United States (−2.6%) and China (−0.7%) mostly contributed to to 2100 and the fact that N2O emission is tied to agriculture and it
the recent bending of the emissions curve. While these are en- is the greatest challenge in limiting N2O emissions by 2100 with a
couraging signs, aggressive policies will still be required to world population of 10 billion, we are not targeting N2O in the
Downloaded by guest on April 18, 2021
achieve carbon neutrality and climate stability. mitigation measures discussed here.
Xu and Ramanathan PNAS | September 26, 2017 | vol. 114 | no. 39 | 10319Super Pollutants (SLCPs). As of now, the CO2 warming in con- in 2020 will unmask some of the aerosol cooling (red lines in SI Ap-
junction with the larger than 1 °C future warming imposed by pendix, Fig. S5) and offset the warming reduction by CO2 and SLCP
SLCPs (Box 1 Figure) makes it extremely difficult, if not impossible, mitigation. In the baseline scenarios of this study, the cooling aerosols
to limit the near-term (next three decades) warming below the are regulated gradually between 2020 and 2100 (SI Appendix, Fig.
dangerous levels by reducing CO2 concentrations. The following S6), whereas in the mitigation scenario examined here, CO2 mitigation
discussion is restricted to the impact of reducing the atmospheric is implemented starting from 2020 and CO2 emission is brought to net
concentrations of SLCPs with the required measures discussed zero in about three decades (SI Appendix, Fig. S2B). As a result, the
later. This distinction is important since measures to reduce CO2 unmasking of coemitted aerosol cooling (a net warming effect) is more
would also indirectly reduce some of the SLCP emissions. rapid in the decreasing CO2 emissions beginning in 2020 (CN2020)
The four SLCPs [methane, tropospheric ozone, black carbon mitigation scenario (SI Appendix, Fig. S5B vs. S7).
(BC), and hydrofluorocarbons (HFCs)] are referred to as super pol- Given the uncertainties in aerosol forcing; the socioeconomic
lutants (SPs) since their global warming potential (on a 100-year and political challenges involved in CO2 mitigation; climate
time scale) ranges from 25 to 2,000. When the warming due to CO2 feedback uncertainties; and, above all, the possibilities of cata-
is added to the SP warming, the 2 °C threshold should have been strophic climate change (a 5% probability) within three decades, a
crossed, but for the masking effect of the −0.9 °C (−0.5 to −1.5 °C) no-regret policy will be to undertake both CO2-dedicated and
aerosol cooling due to sulfate, nitrate, and dust aerosols (Box 1 SLCP-dedicated measures simultaneously. In 2016, California did
Figure). Since these cooling aerosols [along with BC and organic exactly that by passing the SB-1383 bill (37), which targets miti-
carbon (OC) aerosols] are also the major sources of air pollution, gation of methane, HFCs, and BC beginning in 2020. Since Cal-
leading up to 7 million mortalities (31), they are being regulated ifornia has already passed laws to reduce CO2 emissions by 80%
independent of climate mitigation regulations. Phasing out the before 2050, the SB-1383 bill is a demonstration that both CO2
cooling aerosols completely within a few decades (e.g., by and the SPs can be mitigated simultaneously using complemen-
switching to renewable fuels) can lead to an additional warming of tary technologies. Furthermore, in 2011, the United Nations En-
about 0.3 °C between 2020 and 2050 (SI Appendix, Fig. S7). vironment Program formed the Climate and Clean Air Coalition
In summary, dangerous to catastrophic climate changes in the (www.ccacoalition.org/en) to mitigate all four SLCPs in coalition
near term can be avoided only by reducing the concentrations of with many member nations.
SPs substantially beginning in 2020. Technological measures to
reduce SLCPs are mostly available and fall under two categories: Mitigation: A Three-Lever Strategy
We will now take up the mitigation strategy subject to the criteria
i) CO2-dedicated measures: Technology measures to curb CO2 and constraints identified above. We have to consider two time
emissions such as switching to renewables will also mitigate scales. First is the near term of three decades extending from now to
some of the emissions of SLCPs: methane (22% of methane midcentury, when the warming is likely to cross over to the dangerous
emissions are due to production and consumption of fossil
fuels), BC emitted by diesel vehicles, and emissions of ozone
precursors such as carbon monoxide and NOx (nitrogen
oxides) by fossil fuel consumption (32, 33).
ii) SLCP-dedicated measures. Technological measures indepen-
dent of CO2-dedicated measures are already available (34) for
reducing methane, ozone, and BC concentration, and deploying
immediately to scale is feasible. For the halocarbons, including
HFCs, the Kigali amendment to the Montreal Protocol, which
was approved by 160 nations (35), will phase out high-GWP
(global warming potential) HFCs by 2050. The Montreal Protocol
was unanimously adopted by the United Nations in the 1980s to
ban chlorofluorocarbons (CFCs) due to the negative impact on the
ozone layer, but it was also effective in mitigating the super green-
house effect of these halocarbons (36). The Kigali amendment
specifically recognized the climate-warming effect of halocarbons
and approved phasing down these powerful climate pollutants.
The mitigation of the coemitted SLCPs and cooling aerosols by
CO2-dedicated measures requires special consideration (33).
SLCP emissions are not entirely independent of CO2 emissions, Fig. 3. Model-simulated temperatures for the 20th century
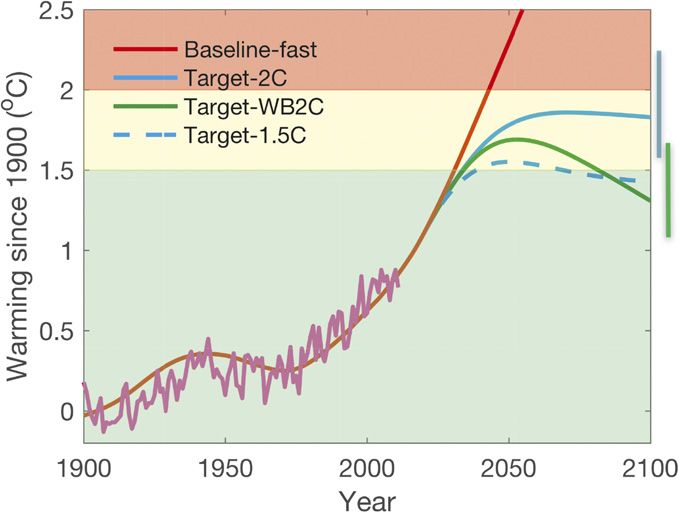
and emission rates of SLCPs can decrease due to CO2 mitigation, (observations are shown in magenta) and their projections into the
and likewise CO2 emissions can decrease due to mitigation of 21st century under four different scenarios: baseline-fast (red line);
SLCPs. The role of coemitted SLCPs that are dependent on CO2 is Target-2C (CN2030 + SLCP2020) with CO2 mitigation starting at
2030 (CN2030), followed by decarbonization as in INDCs (blue solid
estimated in SI Appendix, Fig. S5. A fraction of CH4 (about 70%)
line) [SLCPs are also mitigated starting from 2020 (SLCP2020)];
and BC (about 30%) emissions can be mitigated through CO2- Target-WB2C (CN2030 + SLCP2020 + CES1t), which is the same as
dedicated measures. While HFCs are not dependent on CO2 the blue solid line but also includes extraction of 1 trillion tons of CO2
mitigation, CO2-dedicated mitigation measures can accomplish starting from 2030 (green solid line); and Target-1.5C, which is the
roughly 50% of the 0.6 °C mitigated warming by SLCPs by same as the blue solid line, except that decarbonization starts earlier
at 2020 (CN2020 + SLCP2020) (blue dashed line). The vertical bars on
2050 and 40% of the 1.2 °C mitigated warming by 2100. Another
the right show the uncertainty of projected warming at 2100 due to
complexity of the coemission issue is that a major part of the climate sensitivity uncertainty (10–90%) for the cases of Target-2C
cooling aerosols (mostly sulfates and nitrates) is also coemitted by (CN2030 + SLCP2020, blue solid line) and Target-WB2C (CN2030 +
Downloaded by guest on April 18, 2021
CO2-dedicated measures. Hence, the CO2 measures implemented SLCP2020 + CES1t, green solid line).
10320 | www.pnas.org/cgi/doi/10.1073/pnas.1618481114 Xu and Ramanathanthreshold (baseline curves in Fig. 1A and Fig. 3). Next is the long term, of current technologies (32) is about 0.6 °C by 2050 and 1.2 °C by
extending from midcentury to 2100, when the baseline LPHI warming 2100 (SI Appendix, Fig. S5B and Table S1).
can reach beyond the catastrophic regime into the unknown domain
(baseline curves in Fig. 1B and Fig. 2). Carbon Extraction and Sequestration Lever. The third lever is
There are three levers available for bending the warming curve. the carbon extraction and sequestration (CES) lever, which will
extract CO2 from the source (e.g., the coal power plant) or from
Carbon Neutral Lever. The carbon neutral (CN) lever is for miti- the air and sequester it. While the CN and SP levers can help
gation of CO2 emissions. It has taken society nearly 220 years mitigate the 50% probability warming targets, they are in-
(from 1750 to 1970) to emit the first trillion tons of CO2 and only adequate to mitigate the LPHI warming. Ultimately, we must thin
another 40 years (1970–2010) to emit the next trillion tons. The the CO2 greenhouse blanket by removing the CO2 that is already
third trillion tons, under current emission trends, would be emitted in the atmosphere.
by 2030 and the fourth trillion tons before 2050 (Box 1 and SI Given the near-term risk of exceeding the dangerous to cata-
Appendix, Fig. S1A). Even if the INDCs are implemented rigor- strophic thresholds, the timing for pulling these levers is a crucial
ously and verifiably, the third trillion tons will be added by 2035 (SI issue. Ideally, these levers should be pulled immediately by 2020.
Appendix, Fig. S2A). Earlier studies (30) have identified that cu- We will now elaborate on three options to constrain the choices
mulative CO2 emissions must be limited to less than 3.7 trillion considered in earlier studies, starting with the least preferable
tons (or 1 trillion tons of carbon) to have any chance of limiting the option first.
warming below 2 °C. These studies often focused on targeting Target-2C option. This option involves following the INDCs until
the central value (50% probability) of the warming and less on the 2030 and bending the CO2 emissions downward by 2030, and
LPHI warming. The maximum warming reduction feasible by pulling bending the SP (SLCP) emissions downward by 2020 and reaching
on the CN lever can be inferred from Box 1, which shows the full potential by 2060. The CO2 part of this option is referred to as
2100 baseline-fast warming by CO2 alone to be 2.6 °C. Since the CN2030, while the SLCP part is referred to as SLCP2020 (Table 1).
lifetime of CO2 ranges from decades (for the first 50%), to centuries, CN2030 will achieve carbon neutrality by 2060–2070, which
to millennia (for 20%) (38), not all of the 2.6 °C warming can be will limit the cumulative CO2 emissions (since preindustrial) to
mitigated by 2100. Constrained by CO2 lifetime and the diffu- 3.2 trillion tons (SI Appendix, Fig. S2A). We refer to this as the
sion time of new technologies (decades), the scenarios consid- Target-2C option since it has been proposed by several earlier
ered here (SI Appendix, Fig. S2A) suggest that about half of the studies (3, 23). However, even when CN2030 is combined with
2.6 °C CO2 warming in the baseline-fast scenario can be miti- SLCP2020, the Target-2C option will only be able to limit the
gated by 2100 and only 0.1–0.3 °C can be mitigated by 2050. 50% probability warming below 2 °C (Fig. 3) but will fail to meet
Had we followed the baseline-default trajectory, the CO2- the mitigation criteria of avoiding dangerous warming (50%
alone warming would have been 3.5 °C instead of 2.6 °C as shown probability of warming less than 1.5 °C) both in the near term and
in Fig. 2. It is important to note both scenarios use fossil fuels. in the long term (SI Appendix, Figs. S9 and S10).
Since the baseline-default scenario reduces carbon intensity of Target-1.5C option. Instead of allowing CO2 emissions to in-
the economy by only 50% from the 2010 values compared with an crease until 2030, we should start bending the curve by 2020 [i.e.,
80% reduction in the baseline-fast scenario, we infer that reducing CN2020 and achieving a CN status by 2050 (SI Appendix, Fig.
the carbon intensity of the economy is a very potent mitigation S2B)]. Since 2020 is just a few years away, this is a highly optimistic
measure since, by itself, it can reduce the 2100 CO2 warming by option. The 10-year head start in bending the CO2 curve, when
0.9 °C from 3.5 to 2.6 °C (additional details are provided in SI combined with SLCP2020, was sufficient to bring down the
Appendix, section 6). probability of 1.5 °C warming (the threshold for dangerous
warming) from more than 99% to less than 50% (blue dashed
SP Lever. The SP lever targets SLCPs. Reducing SLCP emissions curve in SI Appendix, Figs. S9 and S10). Furthermore, advancing
thins the SP blanket within few decades, given the shorter life- the CN lever by 10 years has reduced the probability of cata-
times of SLCPs (weeks for BC to about 15 years for HFCs). The strophic warming (>3 °C) to below 5%. The main reason is be-
mitigation potential of the SP lever with a maximum deployment cause the CN2030 case allows additional emissions of 1.2 trillion
Table 1. Scenarios of CO2 and SLCPs considered in the study
Decarbonization pathway toward
Scenario acronyms carbon neutrality starting at? SLCPs mitigation starting at? CES included?
Baseline-default (RCP8.5) No (SI Appendix, Fig. S1B) No No
Baseline-fast (RCP6.0-like) No (SI Appendix, Fig. S1A) No No
Target-2C (CN2030 + SLCP2020) 2030 (SI Appendix, Fig. S2A) 2020 (SI Appendix, Fig. S4) No
Target-1.5C (CN2020 + SLCP2020) 2020 (SI Appendix, Fig. S2B) 2020 (SI Appendix, Fig. S4) No
Target-WB2C (CN2030 + SLCP2020 + CES1t) 2030 (SI Appendix, Fig. S2A) 2020 (SI Appendix, Fig. S4) Yes (SI Appendix,
Fig. S2C)
FixedConcentration2020 2020, but the reduction rate is No No
slower than CN2020 (SI
Appendix, Fig. S8A)
ZeroEmission2020 2020, but the CO2 emission is No No
reduced to zero abruptly (SI
Appendix, Fig. S8B)
CN2020 + SLCP2020-dependent 2020 (SI Appendix, Fig. S2B) 2020, but only includes the portion No
that is coemitted by CO2 sources
Downloaded by guest on April 18, 2021
(SI Appendix, Fig. S5)
Xu and Ramanathan PNAS | September 26, 2017 | vol. 114 | no. 39 | 10321tons between 2010 and 2050 (SI Appendix, Fig. S2A), whereas in stress phenomenon and the likelihood of approximately half of
the CN2020 case, the additional increase is only 0.5 trillion tons (SI the population exposed to deadly heat by 2050 (Box 2).
Appendix, Fig. S2B). The inference is that to meet the criteria for We conclude with a commentary on the feasibility of the mit-
avoiding dangerous warming (10 Xu Y, Lin L (2017) Pattern scaling based projections for precipitation and potential evapotranspiration: Sensitivity to composition of GHGs and aerosols forcing.
Clim Change 140:635–647.
11 Flato G, et al. (2013) Evaluation of climate models. Climate Change 2013: The Physical Science Basis. Contribution of Working Group I to the Fifth Assessment
Report of the Intergovernmental Panel on Climate Change, eds Stocker TF, et al. (Cambridge Univ Press, Cambridge, UK).
12 Hsiang S, et al. (2017) Estimating economic damage from climate change in the United States. Science 356:1362–1369.
13 Collins M, et al. (2013) Long-term climate change: Projections, commitments and irreversibility. Climate Change 2013: The Physical Science Basis. Contribution of
Working Group I to the Fifth Assessment Report of the Intergovernmental Panel on Climate Change, eds Stocker TF, et al. (Cambridge Univ Press, Cambridge, UK).
14 Roe GH, Baker MB (2007) Why is climate sensitivity so unpredictable? Science 318:629–632.
15 Pistone K, Eisenman I, Ramanathan V (2014) Observational determination of albedo decrease caused by vanishing Arctic sea ice. Proc Natl Acad Sci USA
111:3322–3326.
16 Bender FA-M, Ramanathan V, Tselioudis G (2012) Changes in extratropical storm track cloudiness 1983–2008: Observational support for a poleward shift. Clim
Dyn 38:2037–2053.
17 Norris JR, et al. (2016) Evidence for climate change in the satellite cloud record. Nature 536:72–75.
18 Tan I, Storelvmo T, Zelinka MD (2016) Observational constraints on mixed-phase clouds imply higher climate sensitivity. Science 352:224–227.
19 Forest CE, Stone PH, Sokolov AP, Allen MR, Webster MD (2002) Quantifying uncertainties in climate system properties with the use of recent climate observations.
Science 295:113–117.
20 Ciais P, et al. (2013) Carbon and other biogeochemical cycles. Climate Change 2013: The Physical Science Basis. Contribution of Working Group I to the Fifth
Assessment Report of the Intergovernmental Panel on Climate Change, eds Stocker TF, et al. (Cambridge Univ Press, Cambridge, UK).
21 Randerson JT, et al. (2015) Multicentury changes in ocean and land contributions to the climate-carbon feedback. Global Biogeochem Cycles 29:744–759.
22 Wigley TML, Raper SCB (2001) Interpretation of high projections for global-mean warming. Science 293:451–454.
23 Knutti R, Stocker TF, Joos F, Plattner G-K (2002) Constraints on radiative forcing and future climate change from observations and climate model ensembles.
Nature 416:719–723.
24 Webster M, et al. (2003) Uncertainty analysis of climate change and policy response. Clim Change 61:295–320.
25 Roe GH, Bauman Y (2013) Climate sensitivity: Should the climate tail wag the policy dog? Clim Change 117:647–662.
26 Rohling EJ, et al. (2008) High rates of sea-level rise during the last interglacial period. Nat Geosci 1:38–42.
27 Matthews HD, Solomon S (2013) Irreversible does not mean unavoidable. Science 340:438–439.
28 Grübler A, Nakicenovic N, Victor DG (1999) Dynamics of energy technologies and global change. Energy Policy 27:247–280.
29 IPCC (2014) Summary for policymakers. Climate Change 2014: Mitigation of Climate Change. Contribution of Working Group III to the Fifth Assessment Report of
the Intergovernmental Panel on Climate Change, eds Edenhofer O, et al. (Cambridge Univ Press, Cambridge, UK).
30 Meinshausen M, et al. (2009) Greenhouse-gas emission targets for limiting global warming to 2 degrees C. Nature 458:1158–1162.
31 WHO (2016) Burden of disease from the joint effects of Household and Ambient Air Pollution for 2012. Available at www.who.int/phe/health_topics/outdoorair/
databases/AP_jointeffect_BoD_results_Nov2016.pdf. Accessed August 23, 2017.
32 Shindell D, et al. (2012) Simultaneously mitigating near-term climate change and improving human health and food security. Science 335:183–189.
33 Rogelj J, et al. (2014) Disentangling the effects of CO2 and short-lived climate forcer mitigation. Proc Natl Acad Sci USA 111:16325–16330.
34 UNEP and WMO (2011) Integrated assessment of black carbon and tropospheric ozone. Available at https://wedocs.unep.org/rest/bitstreams/12809/retrieve.
Accessed August 23, 2017.
35 United Nations (2016) Kigali amendment. Available at https://treaties.un.org/doc/Publication/CN/2016/CN.872.2016-Eng.pdf. Accessed August 23, 2017.
36 Ramanathan V (1975) Greenhouse effect due to chlorofluorocarbons: Climatic implications. Science 190:50–52.
37 California Legislative Information (2016) SB-1383 Short-lived climate pollutants: Methane emissions: dairy and livestock: organic waste: landfills. Available at
https://leginfo.legislature.ca.gov/faces/billNavClient.xhtml?bill_id=201520160SB1383. Accessed August 23, 2017.
38 Archer D, Brovkin V (2008) The millennial atmospheric lifetime of anthropogenic CO2. Clim Change 90:283–297.
39 IPCC (2011) IPCC Special Report on Renewable Energy Sources and Climate Change Mitigation. Prepared by Working Group III of the Intergovernmental Panel
on Climate Change, eds Edenhofer O, et al. (Cambridge Univ Press, Cambridge, UK).
40 Ramanathan V, et al. (2016) Bending the curve: Ten scalable solutions for carbon neutrality and climate stability. Collabra: Psychology 2:15.
41 Streiff LG, Ramanathan V (July 12, 2017) Under 2 °C living laboratories. Urban Clim, 10.1016/j.uclim.2017.06.008.
42 Tilman D, Hill J, Lehman C (2006) Carbon-negative biofuels from low-input high-diversity grassland biomass. Science 314:1598–1600.
43 Woolf D, Amonette JE, Street-Perrott FA, Lehmann J, Joseph S (2010) Sustainable biochar to mitigate global climate change. Nat Commun 1:56.
44 Lal R (2006) Enhancing crop yields in the developing countries through restoration of the soil organic carbon pool in agricultural lands. Land Degrad Dev 17:197–209.
45 Smith JB, et al. (2009) Assessing dangerous climate change through an update of the Intergovernmental Panel on Climate Change (IPCC) “reasons for concern”.
Proc Natl Acad Sci USA 106:4133–4137.
46 Smith JB, et al. (2001) Vulnerability to climate change and reasons for concern: A synthesis. Climate Change 2001: Impacts, Adaptation, and Vulnerability, eds
McCarthy JJ, Canziani OF, Leary NA, Dokken DJ, White KS (IPCC, Cambridge Univ Press, Cambridge, UK), pp 913–967.
47 O’Neill BC, et al. (2017) IPCC reasons for concern regarding climate change risks. Nat Clim Chang 7:28–37.
48 Lenton TM, et al. (2008) Tipping elements in the Earth’s climate system. Proc Natl Acad Sci USA 105:1786–1793.
49 Kopits E, Marten E, Wolverton E (2014) Incorporating ‘catastrophic’ climate change into policy analysis. Clim Policy 14:637–664.
50 Sherwood SC, Huber M (2010) An adaptability limit to climate change due to heat stress. Proc Natl Acad Sci USA 107:9552–9555.
51 Mora C, et al. (2017) Global risk of deadly heat. Nat Clim Chang 7:501–506.
52 WMO (2016) Global Climate in 2011–2015. Available at https://public.wmo.int/en/resources/library/global-climate-2011%E2%80%932015. Accessed
August 23, 2017.
53 Mitchell D, et al. (2016) Attributing human mortality during extreme heat waves to anthropogenic climate change. Environ Res Lett 11:074006.
54 Mann ME (2009) Defining dangerous anthropogenic interference. Proc Natl Acad Sci USA 106:4065–4066.
55 Dasgupta BP, Ramanathan V (2014) Pursuit of the common good. Science 345:1457–1458.
56 Pontifical Academy of Sciences (2017) Final Statement. PAS-PASS Workshop, Feb 27–March 1, 2017. Available at www.pas.va/content/accademia/en/events/
2017/extinction/statement.html. Accessed August 23, 2017.
57 Barnosky AD (2014) Dodging Extinction: Power, Food, Money, and the Future of Life on Earth (Univ of California Press, Berkeley, CA).
58 Diffenbaugh NS, Field CB (2013) Changes in ecologically critical terrestrial climate conditions. Science 341:486–492.
Downloaded by guest on April 18, 2021
Xu and Ramanathan PNAS | September 26, 2017 | vol. 114 | no. 39 | 10323You can also read