AFGHANISTAN: CLIMATE CHANGE SCIENCE PERSPECTIVES - Islamic Republic of Afghanistan
←
→
Page content transcription
If your browser does not render page correctly, please read the page content below
Islamic Republic of Afghanistan
National Environmental Protection Agency

AFGHANISTAN: CLIMATE CHANGE
SCIENCE PERSPECTIVES

AFGHANISTAN: CLIMATE CHANGE
SCIENCE PERSPECTIVES

First published in December 2016 by the National Environmental Protection Agency (NEPA)
©2016, National Environmental Protection Agency

This report was developed jointly by the National Environmental Protection Agency (NEPA)
of the Islamic Republic of Afghanistan together with UN Environment, with funding from the
Global Environment Facility’s Least Developed Countries Fund (GEF LDCF), UKaid, Estonian
Development Cooperation, and the European Union.

This publication may be reproduced in whole or in part and in any form for educational
or non-profit purposes without special permission from the copyright holder provided
acknowledgement of the source is made. No use of this publication may be made for resale or
for any other commercial purpose whatsoever without prior permission in writing from
NEPA and UN Environment. The contents of this volume do not necessarily reflect the views
of NEPA, UN Environment, or contributory organizations. The designations employed and
the presentations do not imply the expressions of any opinion whatsoever on the part of
NEPA, UN Environment, or contributory organizations concerning the legal status of any
country, territory, city or area or its authority, or concerning the delimitation of its frontiers
or boundaries.

Suggested citation: NEPA & UN Environment. (2016). Afghanistan: Climate Change Science
Perspectives. Kabul: National Environmental Protection Agency & UN Environment.

Authors: Dr. Valentin Aich and Ahmad Jamshed Khoshbeen, UN Environment
Editor: Alec Knuerr, UN Environment
Design and Layout: Ahmad Reza Amiri, UN Environment

Acknowledgements: Many thanks to the Indian Institute of Tropical Meteorology for
providing the CORDEX data.

CONTENT

EXECUTIVE SUMMARY                                    3

[ 1 ] INTRODUCTION                                  4-5

[ 2 ] OBSERVED CHANGES IN AFGHANISTAN´S CLIMATE    6-15
    2.1. TEMPERATURE                                  8
    2.2. PRECIPITATION                               10

[ 3 ] CLIMATE PROJECTIONS FOR AFGHANISTAN         16-25
    3.1. TEMPERATURE                                 17
    3.2. PRECIPITATION                               20

        3.2.1. ANNUAL PRECIPITATION                  20

        3.2.2. SPRING PRECIPITATION                  21

        3.2.3. WINTER PRECIPITATION                  23

        3.2.4. HEAVY PRECIPITATION                   24

[ 4 ] VALIDATION                                  26-31
    4.1. REANALYSIS DATA                             28
    4.2. CLIMATE MODEL PROJECTIONS                   30

[ 5 ] STATISTICAL METHODS                         32-33

LITERATURE AND REFERENCES                           34
EXECUTIVE SUMMARY

Global climate change will likely have severe impacts in Afghanistan. Even an “optimistic”
scenario with limited Green House Gas (GHG) emissions (RCP 4.5) is projected to lead, with
high certainty, to strong warming. Climate change projections for Afghanistan also show a
temperature increase of around 1.4°C until 2050 and stabilization at the end of the century
at around 2.6°C. Under a “pessimistic,” business-as-usual scenario with unchecked
emissions, temperature rise is projected to become extreme with a mean increase of 2°C
until 2050 and reaching more than 6°C by the end of the 21st century. The temperature
increase shows regional differences with the strongest increases in the Central Highlands
and the Hindukush regions. These findings are in line with historical temperate trends
of over 1.8°C since the middle of the 20th century, though in the past the country’s South
experienced the strongest warming.
Precipitation projections are more uncertain and the differences between scenarios is less
distinct, with no clear trend for annual precipitation for the past and the future. However,
most models predict a distinct decrease in precipitation during the spring season, which
are the most important months for rain-fed agriculture. For the relevant regions in the
East, North and Central Highlands, these precipitation decreases are estimated at around
-30% to nearly -40 % for the past. Future projections show decreases in these relevant
regions of around -20% until 2100. The trends for winter precipitation are also significant,
but not systematic. Heavy precipitation (95th percentile) shows no statistically significant
trend for the past and the future.
In sum, the climate signals for Afghanistan are alarming, particularly with regard to
temperature increase. Even with limited GHG emissions, Afghanistan’s ecosystems,
agriculture, economy, biodiversity, health, and food security will face big challenges. The
changes caused by unchecked GHG emissions will be considerably more extreme and
lead to unpredictable changes in the aforementioned systems and sectors in Afghanistan.
In the face of an already existing adaptation deficit in the country, Afghanistan urgently
needs enhancement of adaptation measures and strategies in all sectors, and a strong
global effort to limit GHG emissions.

                                 AFGHANISTAN: CLIMATE CHANGE SCIENCE PERSPECTIVES         p3
1

INTRODUCTION

1. INTRODUCTION
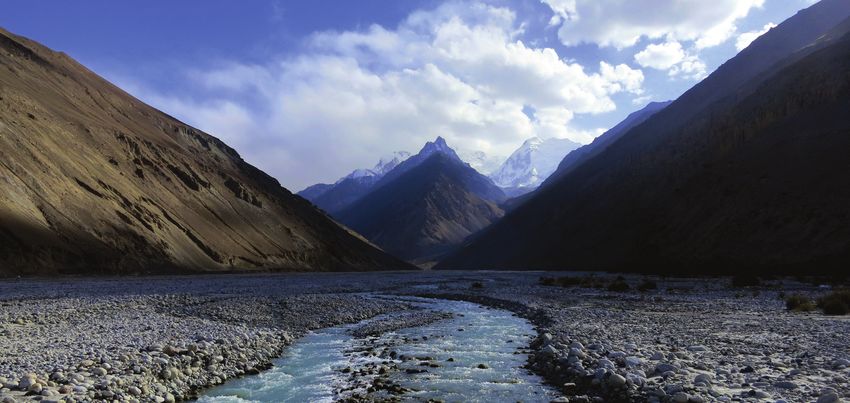
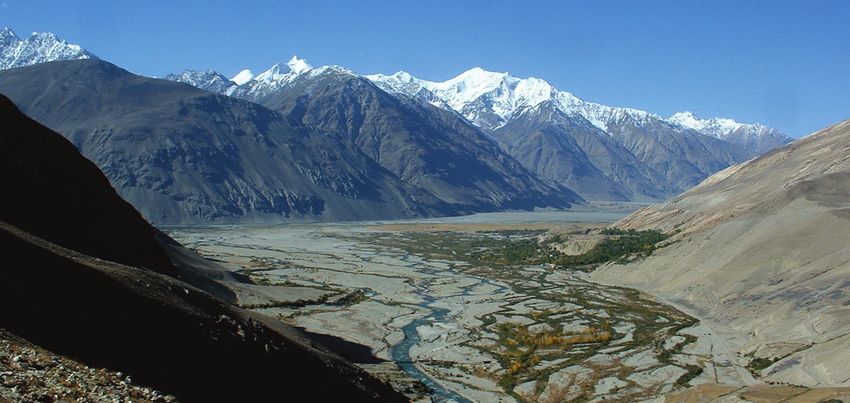
Afghanistan has a unique geography, ranging from the glaciered peaks of the Hindukush to
the arid deserts of the South, covering altitudes from over 7,000 m.a.sl. down to under 250
m.a.sl. It is a landlocked country, located between 29-37° north, and its main geographical
features are the very pronounced topography which are part of the Hindukush. These
geographic features result in a generally dry and very characteristic continental climate.
It is only influenced partly by the Indian sub-continent monsoon from the southeast,
bringing moist maritime air in the summer. The majority of the country generally
experiences cold winters and hot summers. Temperature ranges vary with elevation. This
variation holds not only for the annual cycle but also within one day; temperatures often
vary considerably from very cold nights to very hot days. Precipitation is mainly limited to
the months between October and May, whereas the arid deserts receive less than 100 mm
and in the mountains, mean annual precipitation is considerable above 1000 m.a.sl. In the
mountains, most precipitation falls as snow during winter.
Afghanistan’s variety of different climates has a large natural variability; however, over
recent decades people are beginning to perceive climatological changes. There are very few
scientific studies on climate change in Afghanistan. Analysis of past climate and future
climate projections for Afghanistan only exist from a study of the Tyndell Center for UNDP
and DFID country profiles1,2 of which results are also published in a study of the Stockholm
Environmental Institute (SEI)3 on the socio-economic impacts on climate change from
2009. The analysis of the past is based on observations of station data which have large
gaps, especially after 1970. The projections are based on the third generation of Global
Climate Models (GCM) generated within the Coupled-Model Intercomparison Project
(CMIP).4 They have a grid size of 2.5°, which means that Afghanistan is covered by a total
of 19 cells. Regional climate models (RCM) or statistically downscaled GCMs have not been
evaluated for Afghanistan comprehensively. In regard of its distinguished topography, a
finer grid might bring new insights on climate trends for the future.
This report intends to update the former findings and evaluate the consistency with a new
generation of climate models. Due to the large gaps in the observation data, reanalysis
data has been analyzed for different regions in Afghanistan (Figure 1) from 1950 to 2010.
For future climate trends, seven different RCM GCM combinations generated from the
CORDEX5 project have been evaluated. Their grid size is 0.5° and Afghanistan is covered by
over 300 cells in total, which permits a spatially detailed analysis.
AFGHANISTAN: CLIMATE CHANGE SCIENCE PERSPECTIVES p5
2

OBSERVED CHANGES IN
AFGHANISTAN´S CLIMATE

OBSERVED CHANGES IN AFGHANISTAN´S CLIMATE

  Climate regions of Afghanistan:
  Due to the geographic heterogeneity of Afghanistan, the country has been divided into five regions
  for this analysis (Figure 1):
   1. The Hindukush region in the Northwest mainly consists of Badakhshan province, which
      also comprises the Wakhan area, including parts of the Pamir and Karakoram regions. It is
      the highest and most mountainous part of Afghanistan. It receives the highest amount of
      precipitation and is therefore a major water source, feeding important rivers like the Amu
      Darya.
   2. The Northern Plains (North) have a mean altitude of around 600m and are covered mainly
      by grasslands. Though the region is rather dry, it is important for agriculture, especially the
      almond trees and sheep and goat grazing.
   3. The Central Highlands in the middle of Afghanistan is characterized by deep valleys and
      mountain ranges up to 6400m.
   4. The Eastern Slopes (East) are influenced by the moist air masses of the Indian monsoon which
      get trapped at the high mountain slopes and bring rain. Therefore, it is covered by forests and
      allows agriculture. The rains, however, also can cause flooding and land/mud slides.
   5. The Southern Plateau (South) is the largest region and mainly covered by arid desert. Only
      along the rivers and in the marshlands is agriculture possible. The Helmand River divides the
      region and nourishes Lake Helmand. This region is also prone to sand and dust storms, mainly
      associated with northerly winds.

Figure 1: Climate Regions of Afghanistan Used for this Analysis.
                                                                            K K                                        CHINA

                                                      UZBEK I STAN
                                                                             K K K         TAJ I KI STA N

                                                                                 K K K K
                                                                  d d K K K
                                               d d                               K K K K
                        TURK MENISTAN

                                                            d d d d  d K K K K K
                                           d d d d    d d d
                                                                               K
                                                                     d K K K K
                                           d d d d    d d d d d d d
                                                                     K K K K
                                        d d d d d d   d d d d d d K
                                            RR        RRRR    R K  K K K K K
                       d d d d d d d d d
                       d d d d d d d d    R R R R R R R Kabul R R  H  H H H H

                       d d d d    d R R R R R R R R R R
                                                        R R) H H H H
                                  RRRRRRRRRRRR H H H H
                                                                   H
                     d d d d d
                     I I I I I    I I R R R R R R R R
                                                      R H H H H H
                      I I I I     I I R R R R R R R R H H H H H
             IR AN
                                                        H                                          K
                      I I I I I I I I I I I H H H H H H
                                                                                                        Hindukush

                                                                                                   d    North

                      I I I I I I I I I I I H H H H H H
                                                        H
                                                                                                   R    Central Highlands

                      I I I I I I I I I I I H H H H H H                                            H    East

                                                                     PA K I S TA N                 I    South
                            I I I I I I I I I I

                                                                                                                            ¯
                         I I I I I I I I I I I
                      I I I I I I I I I I I I                                 0      100       200          300
                                                                                                              Kilometers
                        I I I I I I I I I
                                                                               © 2015 UNEP ALL RIGHTS RESERVED.

                                            AFGHANISTAN: CLIMATE CHANGE SCIENCE PERSPECTIVES                                    p7
Reanalysis Data
Climate reanalyses are numerical descriptions of the past climate. They are produced by
combining model outputs with observations from weather stations, radiosondes, satellites,
buoys, aircrafts and ship reports. They contain estimates of all main climatic parameters
such as air temperature, wind at different altitudes, and precipitation. For this study,
different reanalysis products have been evaluated against observation data (see Statistical
Methods) for Afghanistan and finally the dataset from the Global Soil Wetness Project Phase
3 (GSWP3)6 has been selected due to its performance over Afghanistan and its temporal
coverage of the period from 1950 until 2010. It is generated globally on a 0.5° x 0.5° grid and
provides all parameters at a daily time step.
2.1. TEMPERATURE
Afghanistan’s mean annual temperature has increased significantly and pronouncedly
since 1950 by 1.8°C (Figure 2). The map in Figure 3 shows the spatial distribution of the
warming between the 30-year periods from 1951-1980 and 1981-2010 (see box Weather
and Climate). A strong warming trend was experienced in the largest parts of the country,
from the Central Highlands to the Southwest. Particularly in the South, this warming was
extraordinarily strong at 2.4°C (Figure 12). In the Central Highlands and the North, it was
still very distinct with 1.6°C and 1.7°C (Figures 9 and 10). In the Hindukush region, the
warming was around 1°C; in the East, the warming is still significant, but with 0.6°C lower
than in the rest of Afghanistan (Figure 11). In some sub-regions of the East there was also
little or no warming, or even a slight decrease in temperature (Figure 8).
Uncertainty: The temperature trend results are robust even though they do not rely on
weather observations but rather reanalysis data (see box Reanalysis Data). The performance
of the dataset has been tested against observed station data and proved to be reliable
(section 4.2, below). In addition, the warming trends are in line with results of global
analysis the NASA9,10 and former findings of a temperature increase for Afghanistan,
though the formerly found temperature increase of 0.6 °C between 1960 and 2008 for
Afghanistan is distinctly higher for most of Afghanistan.
Figure 2: Trends for Temperature, Annual Precipitation, Spring Precipitation (March-May), Winter
Precipitation (November-January), and Heavy Precipitation (95th percentile) for Afghanistan from
1951-2010 Derived from Reanalysis Data (GSWP3). If Trends are Statistically Significant (α=0.5),
They are Plotted as Dashed Line and the Magnitude is Added.
Temperature
in °C
Precipita�on
in mm
Spring precip.
in mm
Winter precip.
in mm
Heavy precip.
in mmObservations and Weather Stations in Afghanistan
Observed weather data is scarce in Afghanistan due the limited meteorological stations and
the political instability in the last decades, particularly under the Taliban regime, when data
records were lost and observation ceased. Historic data sets have been restored by the PEACE
project7 and are publicly available. Recent weather observations are beside other sources
available from the Global Summary of the Day (GSOD).8
Figure 3: Change in Temperature Between 1981-2010 and 1951-1980 in Afghanistan Derived
from Reanalysis Data (GSWP3)
CH I NA
UZBEK I STAN TAJ I KI STA N
TURK M ENISTAN
Kabul
)
+1.5 °C
IR AN
0 °C
PA K I S TA N
-0.5 °C
0 100 200 300
Kilometers
© 2015 UNEP ALL RIGHTS RESERVED.
¯
Weather and Climate
Weather is commonly defined as the state of the atmosphere at a given time and place with
respect to variables such as temperatures, moisture, wind velocity, and barometric pressure.
Climate in contrast is the “average weather,” and is defined as the measurement of the mean
and variability of the weather over a period of time, ranging from months to thousands or
millions of years. The classic period of measurement is 30 years, as defined by the World
Meteorological Organization (WMO). Climate in a wider sense is the state, including a
statistical description, of the climate system. Hence, when we compare two 30-year periods
of weather observations, we compare the climate and if there are changes, we may refer to
them as climatic changes.
AFGHANISTAN: CLIMATE CHANGE SCIENCE PERSPECTIVES p92.2. PRECIPITATION Precipitation has not changed significantly when considered over the whole of Afghanistan and for all months (Figures 2 and 4). However, the detailed analysis for spring and winter precipitation reveals that the changes are simply levelled out since spring precipitation has significantly decreased by almost a third and winter precipitation has slightly increased, though not by a statistically significant amount. The decrease in spring (March-May) is particularly relevant for agriculture, since spring crops are typically rain- fed and dependent on sufficient rainfall during this period. Figure 5 shows that the regions with most significant agriculture (East, Central Highlands, and North) are affected by the decrease in spring precipitation. Figures 8, 9, and 10 show the trends in detail for these regions, with the strongest decrease in the Central Highlands of almost 40% from 1950 until 2010. In the Hindukush and the South, the decrease is less distinct during these months and there is even a slight increase in the Wakhan and the far South (Figure 5). Winter precipitation, contrastingly, has increased in most parts of the countries (Figure 6), or only slightly decreased, and none of the regional trends is significant. Heavy precipitation has often been reported to have increased during the last decades, leading to more frequent and intense flooding, landslides and other related hazards. In contrast, this study could not find an increase in heavy precipitation (defined as 95th percentile of annual rainfall) between 1950 and 2010 (Figures 2 and 7). However, an increase in heavy precipitation is just one reason amongst many that can lead to these aforementioned catastrophes. For example, rising temperatures might lead to more rapid and earlier spring snow melt, causing an increased risk of flash flooding. Also, droughts can exacerbate the impact of heavy precipitation by hardening soils and reducing their permeability, which can cause flash floods or landslides. In addition, increasing exposure and/or vulnerability against certain hazards might have increased the risk. Uncertainty: The uncertainty of precipitation trends is higher than temperatures due to the greater spatial variability and the complexity of processes that lead to precipitation. neverthless the validation of the reanalysis precipitation data has shown good results when compared with observations. Mainly in the spring, there are deficits of the re- analysis precipitation data, but the general pattern is well represented. Heavy precipitation is by definition a rare event and therefore connected with more statistical uncertainty, also in the representation of the reanalysis data.
Figure 4: Change in Annual Precipitation Between 1981-2010 and 1951-1980 in
Afghanistan Derived from Reanalysis data (GSWP3)
                                                                                                                           CHINA

                                                 UZBEK I STAN                                   TAJ I KI STA N

                         TURK MENISTAN

                                                                    Kabul
                                                                        )

                                                                                                                   +85%

            IR AN

                                                                                                                      0%

                                                                                                                   -35%
                                                                         PA K I S TA N

                                                                                     0         100      200       300
                                                                                                                    Kilometers
                                                                                         © 2015 UNEP ALL RIGHTS RESERVED.
                                                                                                                                   ¯
Figure 5: Change in Spring Precipitation (March-May) Between 1981-2010 and 1951-1980 in
Afghanistan Derived from Reanalysis Data (GSWP3)
                                                                                                                        CHINA

                                             UZBEK I STAN                                   TAJ I KI STA N

                    TURK MENISTAN

                                                                Kabul
                                                                   )

                                                                                                                 +85%

    IR AN

                                                                                                                 0%

                                                                    PA K I S TA N
                                                                                                                 -35%

                                                                               0         100      200         300

                                                                                © 2015 UNEP ALL RIGHTS RESERVED.
                                                                                                                Kilometers   ¯

                                         AFGHANISTAN: CLIMATE CHANGE SCIENCE PERSPECTIVES                                              p11
Figure 6: Change in Winter Precipitation (November - January) Between 1981-2010 and 1951-
1980 in Afghanistan Derived from Reanalysis Data (GSWP3)
CHINA
UZBEK I STAN TAJ I KI STA N
TURK MENISTAN
Kabul
)
+85%
IR AN
0%
PA K I S TA N
-35%
0 100 200 300
Kilometers
© 2015 UNEP ALL RIGHTS RESERVED.
¯
Figure 7: Change in Heavy Precipitation (95th percentile) Between 1981-2010 and 1951-1980
in Afghanistan Derived from Reanalysis Data (GSWP3)
CH I NA
UZBEK I STAN TAJ I KI STA N
TURK M ENISTAN
Kabul
)
+85%
IR AN
0%
PA K I S TA N
-35%
0 100 200 300
© 2015 UNEP ALL RIGHTS RESERVED.
Kilometers ¯Figure 8: Similar to Figure 2 but for the Hindukush of Afghanistan (see Figure 1)
Hindukush
Temperature
in °C
Precipita�on
in mm
Spring precip.
in mm
Winter precip.
in mm
Heavy precip.
in mm
Figure 9: Similar to Figure 2 but for the North of Afghanistan (see Figure 1)
North
Temperature
in °C
Precipita�on
in mm
Spring precip.
in mm
Winter precip.
in mm
Heavy precip.
in mm
AFGHANISTAN: CLIMATE CHANGE SCIENCE PERSPECTIVES p13Figure 10: Similar to Figure 2 but for Central Highlands of Afghanistan (see Figure 1)
Central Highlands
Temperature
in °C
Precipita�on
in mm
Spring precip.
in mm
Winter precip.
in mm
Heavy precip.
in mm
Figure 11: Similar to Figure 2 but for the East of Afghanistan (see Figure 1)
East
Temperature
in °C
Precipita�on
in mm
Spring precip.
in mm
Winter precip.
in mm
Heavy precip.
in mmFigure 12: Similar to Figure 2 but for the South of Afghanistan (see Figure 1)
South
Temperature
in °C
Precipita�on
in mm
Spring precip.
in mm
Winter precip.
in mm
Heavy precip.
in mm
AFGHANISTAN: CLIMATE CHANGE SCIENCE PERSPECTIVES p153 CLIMATE PROJECTIONS FOR AFGHANISTAN
CLIMATE PROJECTIONS FOR AFGHANISTAN

  CORDEX Regional Climate Model:
  CORDEX is an international coordinated framework to produce an improved generation
  of regional climate change projections world-wide for input into impact and adaptation
  studies. It covers different domains and Afghanistan is part of the South Asian domain. The
  regional climate projections are generated by different physical Regional Climate Models
  (RCM) (see Table 1). These RCMs are nested into General Circulation Models (GCM). This
  means, at the edges of the regional domain, in this case the South Asia domain, the RCM
  receives information from the GCM. The RCM has a higher temporal and spatial resolution
  and can therefore include processes which are not represented by GCMs. Especially extreme
  events and regional trends in mountainous areas are modelled with a higher efficiency. In
  the CORDEX project, domains on continental or sub-continental scale are modelled by all
  major regional climate modelling groups of the world. They are the state-of-art in regard
  of regional climate modelling and since all models are run under the same conditions,
  estimating the robustness of the results and the connected uncertainty is possible. For the
  South Asia domain, 11 model combinations are currently available and the data has been
  validated for the Central Himalayan region with satisfying results.11 Some of the model runs
  are corrupt for a certain parameter or not available for the analyzed period and finally seven
  models have been used consistently (see Table 1). Therefore, not all model combinations
  could be used for the analysis. The CORDEX data is on a 0.5° mash and for Afghanistan
  it comprises over 300 tiles, which allows a detailed spatial analysis, especially for the
  mountainous areas of Afghanistan.

3.1 TEMPERATURE
The trends for the mean temperature increase over Afghanistan are significant and
very distinct for both scenarios and all models. For the “pessimistic” business-as-usual
scenario (RCP 8.5), the mean warming is extreme and model mean projects an increase
of around 2°C until 2050 and of 6.3° C until the end of the century. For the “optimistic”
scenario (RCP 2.6) the projections show a warming around 1.4°C until 2050 and a
stabilization afterwards, with a warming around 2.6°C until 2100.
The maps of Figure 14 show that the spatial distribution of the warming, when comparing
the future periods from 2021-2050 with the base period (1976-2005), is projected to be most
severe under both scenarios in the Central Highlands and the Hindukush, particularly in
the Wakhan, where the model mean reaches even 3°C in the near future. This pattern is
also confirmed by the regional trend analysis shown in Figure 15.
The implications of the warming for both scenarios are drastic. Even under the
optimistic scenario, the warming in Afghanistan is above the global mean warming (see
box Scenarios). Warming of 1.5°C until 2050 will have severe impacts on ecosystems,
agriculture, water resources, food security, economy, health, energy, and other sectors.
The extreme warming of the pessimistic scenario will lead most probably to complete
changes of the environment and the current ecosystems. It is unlikely, that ecosystems
can adapt to these changes in less than 100 years, e.g. via emigration to higher altitudes
and the extinction of endemic species is very likely. In addition, it is likely that it will not
be possible to adapt the current agricultural system to the projected severe temperature
increase and further economic decay and its associated implications become likely. Even
the optimistic scenario will pose difficult challenges to adaptation in Afghanistan in terms
of temperature, but a warming as projected by the pessimistic scenario should be avoided
since the consequence of a complete and radical change of the environment and socio-
cultural is likely.

                                   AFGHANISTAN: CLIMATE CHANGE SCIENCE PERSPECTIVES           p17
Uncertainty: The validation of the temperature of the models during the base period has shown that the RCMs used in his study are generally capable of reproducing the temperature dynamics of all regions of Afghanistan well (see section 4.1.2, below). The model spread, also called the band of uncertainty, of the projections is around +/-2 °C and all model runs show the same increasing tendency. This means, taking into account the different starting levels of the models, all RCMs project similar degrees of warming for both scenarios. This implies robust results, which also confirm the projections of the former GCM results of warming levels between 2°C to over 6°C.2 Figure 13: Mean Annual Temperature for Afghanistan for Seven Regional Climate Models for a Base Period (grey, 1970-2005) and a Scenario Period (2006-2100) with Limited GHG Emissions (green, RCP 4.5) and Uncontrolled GHG Emissions (red, RCP 8.5). The Spread of the Models are Depicted as Transparent Areas and the Means as Lines. Both Trends are Statistically Significant and Depicted as Dashed Line. The Magnitudes of the Trends are Plotted in the Relative Colors. Scenarios Climate change is included in the climate models via emission scenarios. The latest generations of scenarios, which are also used in the Fifth Assessment Report of the Intergovernmental Panel on Climate Change (IPCC) are the Representative Concentration Pathways (RCP). Differently from the projections described in the previous Special Report on Emission Scenarios (SRES), RCPs do not imply a unique framework for evaluating the impact of socio-economic assumptions such as population growth, economic development and technology. Instead, each RCP is the result of a different set of modelling assumptions. Each RCP is named after the level of additional radiative forcing achieved by 2100, with respect to the pre-industrial value. The RCP 4.5 adopted in this study corresponds to a low stabilization scenario, whereby in 2100 the radiative forcing is 4.5 W above the pre-industrial level. On the other hand, the RCP 8.5 corresponds to a high-end stabilization scenario, mainly driven by a sustained population growth, whereby in 2100 the radiative forcing is 8.5 W above the pre- industrial level. The RCP 4.5 corresponds likely to a warming between 1.1°C to 2.6°C increase of global temperature above the pre-industrial level until the end of this century and the RCP 8.5 to a likely increase of 2.6°C to 4.8°C.12
Figure 14: Projected Changes in Temperature in °C for Afghanistan as Mean of Seven Regional Climate
Models Between a Scenario Period (2021-2050) and a Base Period (1976-2005) Under Limited GHG
Emissions (left, RCP 4.5) and Uncontrolled GHG Emission (right, RCP 8.5)

                                                                                CHINA                                                                                        CHINA

                            UZBEK I STAN                       TAJ I KI STA N                                                                     TAJ I KI STA N

        TURK MENISTAN                                                                           TURK MENISTAN

                                           Kabul                                                                        Kabul
                                              )                                                                            )

                                                                                                                                                                    +3 °C

IR AN                                                                                   IR AN
                                                                                                                                                                    +2 °C

                                               PA K I S TA N                                                                PA K I S TA N
                                                                                                                                                                    +1 °C

                                                                                                                                     0      100       200          300
                                                                                                                                                                     Kilometers
                                                                                                                                      © 2015 UNEP ALL RIGHTS RESERVED.
                                                                                                                                                                                  ¯

Figure 15: Similar to Figure 14 but for the Climate Regions of Afghanistan (see Figure 1): Hindukush,
North, Central Highlands, East, and South

                           Hindukush                                                                            North

                        Central Highlands                                                                       East

                               South

                                                               AFGHANISTAN: CLIMATE CHANGE SCIENCE PERSPECTIVES                                                                   p19
3.2. PRECIPITATION 3.2.1 ANNUAL PRECIPITATION For annual precipitation, the pattern is similar to the pattern in the past. There is no significant trend but rather a slight decrease until 2100. The internal variability is high during the whole period. The maps of Figure 17 show a slight decrease in the near future period from 2021-2050 for most of the area which is slightly more distinct in the optimistic GHG emission scenario. For the different regions, as shown in Figure 18, there are only slight trends around in- or decreases of approximately 10% until 2100. Only for the South the projections of the optimistic scenario show an increase of 20%. This trend can, however, be explained by a decrease before 2050 and a subsequent increase. This pattern holds also for the relatively smaller increases in the East and Hindukush of around 10%. In the Central Highlands and the North, the annual precipitation is projected to decrease to a small extent. Uncertainty: Precipitation is generally connected with higher uncertainties than temperatures in climate modelling. As shown in the validation (see section 4.1.2, below) and by the study of Ghimire et al.,11 the general performance is satisfying but uncertainty is considerably high, since the models do not agree on the director of the trend. Only during spring, the models seem to underestimate the amount of precipitation as a general bias. Since the overall trends seem to be reflected by the models, and results are analyzed as changes from the base period of the same models, the relative changes of the model are still expected to be still satisfyingly reliable. However, for the interpretation it should be taken into account, that the results are considerably uncertain, especially when it comes to absolute magnitudes of precipitation. Figure 16: Annual Precipitation for Afghanistan for Seven Regional Climate Models for a Base Period (grey, 1970-2005) and a Scenario Period (2006-2100) with Limited GHG Emissions (green, RCP 4.5) and Uncontrolled GHG Emissions (red, RCP 8.5). The Spread of the Models are Depicted as Transparent Areas and the Means as Lines. The Statistically Significant Trend of RCP 4.5 is Depicted as Dashed Line and its Magnitude is Plotted in Green.
Figure 17: Projected Changes of Annual Precipitation in % for Afghanistan as Mean of Seven Regional
Climate Models Between a Scenario Period (2021-2050) and a Base Period (1976-2005) Under
Limited GHG Emissions (left, RCP 4.5) and Uncontrolled GHG Emission (right, RCP 8.5).
                                                                  CHINA                                                                        CHINA

                                                 TAJ I KI STA N                                                     TAJ I KI STA N

                             Kabul                                                        Kabul
                                )                                                            )

                                                                                                                                      +40%

 IR AN                                                                    IR AN

                                                                                                                                         0%

                                 PA K I S TA N                                                PA K I S TA N                            -30%

                                                                                                       0      100       200          300
                                                                                                                                       Kilometers
                                                                                                        © 2015 UNEP ALL RIGHTS RESERVED.
                                                                                                                                                    ¯
Figure 18: Similar to Figure 16 but for the Climate Regions of Afghanistan (see Figure 1): Hindukush,
North, Central Highlands, East, and South. Statistically Significant Trends are Depicted as Dashed line
and their Magnitude is Plotted in the Relative Color.
                       Hindukush                                                  North

                   Central Highlands                                              East

                        South

3.2.2. SPRING PRECIPITATION
In contrast to annual precipitation, there is a distinct and statistically significant decrease
of precipitation during the months from March to May (Figure 19), especially for the
“pessimistic” scenario. Figure 20, shows that in the near future period this decrease in
spring precipitation is most pronounced in the North, the Central Highlands and the eastern
part of the South regions. In the central East and the far South, the models project no trend
for the business as usual scenario and even an increase for the “optimistic” scenario. The
regional trends until 2100 (Figure 21) confirm these trends of decreases in the North, Central
Highlands, and East. These are also the regions with most of Afghanistan´s agricultural
production, for which the spring precipitation is very important. In combination with the
increasing temperatures and connected increase in evapotranspiration, this will challenge
the current rain-fed agriculture and enhance the need for irrigation.
Uncertainty: see annual precipitation.

                                                 AFGHANISTAN: CLIMATE CHANGE SCIENCE PERSPECTIVES                                                   p21
Figure 19: Similar to Figure 16 but for Spring Precipitation (March-May).
Afghanistan
Figure 20: Projected Changes of Spring Precipitation (March-May) in % for Afghanistan as mean of
Seven Regional Climate Models Between a Scenario Period (2021-2050) and a Base Period (1976-
2005) Under Limited GHG Emissions (left, RCP 4.5) and Uncontrolled GHG Emission (right, RCP 8.5).
CHINA CHINA
TAJ I KI STA N TAJ I KI STA N
Kabul Kabul
Change
)
in spring precipitation UZBEK I STAN
)
under limited GHG emissions +40%
TURK MENISTAN
IR AN IR AN
0%
PA K I S TA N PA K I S TA N -30%
0 100 200 300
Kilometers
© 2015 UNEP ALL RIGHTS RESERVED.
¯
Figure 21: Similar to Figure 18 but for Spring Precipitation (March-May).
Hindukush North
Central Highlands East
South3.2.3. WINTER PRECIPITATION
The precipitation in the winter months from November to January, which in large parts
of Afghanistan falls as snow, shows different trends for the scenarios, with a slight
increase under the “optimistic” GHG scenario (RCP 4.5) and a slight decrease under the
“pessimistic” GHG emission scenario (RCP 8.5) (Figure 22). However, the positive trend of
the RCP 4.5 is due a decrease in the first half of the century, which can be also seen in the
map of Figure 23. Until 2050, most of the country is projected to experience a decrease in
winter precipitation. This trend continues for the RCP 8.5 scenario but turns in the other
direction for the RCP 4.5. In the figure of the regional trend, this development can be seen
more distinct (Figure 23). Until 2010, especially in the Hindukush, there is a substantial
and significant increase under both scenarios. For the South, Central Highlands, and East,
the decrease of the “pessimistic” scenario is distinct and also statistically significant.
The partial increase in the Hindukush and the stable situation in the North in regard of
winter precipitation can partly equal out the decreases of the spring precipitation, which
consequently appears in sum over the whole year as no trend. This has to be taken into
account when interpreting annual precipitation (see section 3 .2.1, above).
Uncertainty: See annual precipitation.
Figure 22: Similar to Figure 16 but for Winter Precipitation (November-January)
Afghanistan
Figure 23: Projected Changes of Winter Precipitation (November-January) in % for Afghanistan as
Mean of Seven Regional Climate Models Between a Scenario Period (2021-2050) and a Base Period
(1976-2005) Under Limited GHG Emissions (left, RCP 4.5) and Uncontrolled GHG Emission (right, RCP
8.5).
CH I NA CH I NA
TAJ I KI STA N TAJ I KI STA N
Kabul Kabul
) )
+40%
IR AN IR AN
0%
PA K I S TA N PA K I S TA N -30%
0 100 200 300
Kilometers
© 2015 UNEP ALL RIGHTS RESERVED.
¯
AFGHANISTAN: CLIMATE CHANGE SCIENCE PERSPECTIVES p23Figure 24: Similar to Figure 18 but for Winter Precipitation (November-January). 3.2.4. HEAVY PRECIPITATION Heavy precipitation (95th percentile) increases slightly under the limited emission scenario (RCP 4.5), and decreases slightly under the unchecked emission scenario (RCP 8.5) (Figure 25). The regional pattern of the heavy precipitation trend is similar to annual precipitation until 2050 (Figure 26, compare to annual precipitation Figure 17). The further regional trends until 2100 show again a strong regional heterogeneity. Especially in the Hindukush and East, the projected increase might have negative implications for erosion and hazards like floods and landslides. However, an increase in heavy precipitation is just one possible reason that can lead to the aforementioned natural hazards. Uncertainty: See annual precipitation. Besides the general uncertainty of precipitation projections, heavy precipitation comes even with higher uncertainty. This additional uncertainty is due to the rare statistical character of these rainfall events and to the complex processes that can cause heavy precipitation. Models are limited to a certain time step and spatial grid, which often cannot reflect heavy precipitation events that lead to flash floods. Locally limited convective systems with strong rains or short downpours are therefore not detectable. Warmer air can hold more moisture than cold air. Therefore, it is possible that even under a stable or decreasing precipitation trends a warming can lead to more extreme rainfalls. This process might not be reflected in the modelling and this overall high uncertainty should be taken into account when interpreting the scenarios results for heavy precipitation.
Figure 25: Similar to Figure 16 but for Heavy Precipitation (95th percentile)

                                                           Afghanistan

Figure 26: Projected Changes of Heavy Precipitation (95th percentile) in % for Afghanistan as Mean
of seven Regional Climate Models Between a Scenario Period (2021-2050) and a Base Period (1976-
2005) Under Limited GHG Emissions (left, RCP 4.5) and Uncontrolled GHG emission (right, RCP 8.5).
                                                                   CHINA                                                                        CHINA

                                                  TAJ I KI STA N                                                     TAJ I KI STA N

                              Kabul                                                        Kabul
                                 )                                                            )

                                                                                                                                       +40%

IR AN                                                                      IR AN

                                                                                                                                          0%

                                  PA K I S TA N                                                PA K I S TA N                            -30%

                                                                                                        0      100       200          300
                                                                                                                                        Kilometers
                                                                                                         © 2015 UNEP ALL RIGHTS RESERVED.
                                                                                                                                                     ¯
Figure 27: Similar to Figure 18 but for Heavy Precipitation (95th percentile)
                        Hindukush                                                  North

                     Central Highlands                                             East

                          South

                                                   AFGHANISTAN: CLIMATE CHANGE SCIENCE PERSPECTIVES                                                  p25
4 VALIDATION
VALIDATION

Table 1: List of Global (GCM) and Regional (RCM) Climate Model Combinations of CORDEX South Asia
used in this Analysis

   General Circulation Models (GCM) / Institute                          Regional Climate Models (RCM) / Institute

                                                                            CCAM / Commonwealth Scientific and
  1     ACCESS / Bureau of Meteorology, Australia
                                                                          Industrial Research Organisation, Australia

           NorESM / Bjerknes Centre for climate
  2                                                                                                              CCAM
                    research, Norway
         CCSM / National Center for Atmospheric
  3                                                                                                              CCAM
              Research in Boulder, USA
         CNRM / Centre National de Recherches
  4                                                                                                              CCAM
              Météorologiques, France
              ECHAM / Max Planck Institute für
  5                                                                                                              CCAM
                  Meteorologie, Germany
            SMHI / Swedish Meteorological and                          ICHEC / Irish Centre for High-End Computing,
  6
              Hydrological Institute, Sweden                                              Ireland

                                                                        REMO / Max Planck Institut für Meteorologie,
  7                        ECHAM
                                                                                       Germany

Figure 28: Weather Stations of Afghanistan used for the Validation of the Re-analysis Data and the
Climate Projections. For Time Periods of Observations see Table 2.
                                                                                                                                      CHINA

 Water Station                                    UZBEK I STAN                                             TAJ I KI STA N

                     TURK MENISTAN
                                                                                               Faizabad
                                                                                           |
                                                             Mazar-i-Sharif
                                                         |

                                                                                  Kabul
                                                             Panja            |
                              Herat
                                                         |
                          |                                                       Gardez
                                                                              |

           IR AN

                                              Kandahar
                                          |                                   PA K I S TA N

                                                                                           0         100       200

                                                                                           © 2015 UNEP ALL RIGHTS RESERVED.
                                                                                                                            300
                                                                                                                              Kilometers   ¯

                                      AFGHANISTAN: CLIMATE CHANGE SCIENCE PERSPECTIVES                                                         p27
Table 2: Periods of Available Monthly Weather Data used for the Validation of Reanalysis and Regional
Climate Models.
Station Period
Faizabad 1963-1977
Mazar-i-Sharif 1958-1978
Kabul 1958-1977
Panjab 1965-1977
Herat 1958-1988
Gardez 1958-1978
Kandahar 1963-1977
4.1.1. REANALYSIS DATA
The reanalysis data from the Global Soil Wetness Project Phase 3 (GSWP3) (see textbox
Reanalysis Data) has been validated against observed data in Figure 29. The data is on
a 0.5° x 0.5° grid and in order to compare it with the point information of the different
weather station, the nine nearest tiles around the point have been averaged (9-point filter).
This is a standard procedure in order to avoid noise due to the minimum length wave of
the signal.13,14 The area of the compared data is therefore the mean of around 24,000km²
and the regional geographical setting of the weather station, including its altitude, is
therefore not reflected adequately. Still the general physical patterns should be reproduced
by the reanalysis but the magnitudes of temperature and precipitation might differ. For
example, Faizabad is located in the Kokcha valley (Figure 28), therefore its temperatures
are distinctly warmer then then mean of the surrounding mountainous surrounding
area. Thus, the temperature difference between the reanalysis and the measurements
differ strongly, but still show the same seasonal cycle. For stations of which the altitude
is similar to the mean of the surrounding gridboxes, like Kandahar, Herat and Gardez, the
validation shows a more adequate performance and observed and reanalyzed temperature
are almost equal. This means, that in regard of temperature, the reanalysis data is robust
and reliable. For all stations, it shows the correct seasonal cycle and for stations with an
altitude which is comparable with the mean of the surrounding grids, also the magnitude
of the monthly temperature is correct.
With regard to precipitation, regional differences are larger and results are heterogeneous
throughout the seasonal cycle. For all stations, the precipitation between April and
December is well reproduced by the reanalysis data with medium deviations mainly in
December and April. In contrast, the precipitation from January to March is overestimated
for the stations Faizabad, Gardez, Kabul, Mazar-e Sharif and Panjab. All these stations
are located in mountainous areas, where at the one hand, the described effect of the
9-point-filter is distinct. On the other hand, climate and weather models still have
difficulties with high altitudes, since the spatial resolution of the cells is often too course
to represent relevant processes that lead to rainfall. Still this bias holds for the whole
period and since in the analysis for precipitation mainly relative changes are used, the
data is also satisfying reliable and robust for these analyses. However, it should be kept
in mind during the interpretation, that the precipitation from the reanalysis comes with
uncertainty as mentioned in the chapter 2 .2.Figure 29: Climate Diagrams with Mean Monthly Temperature and Precipitation Used for the Validation of
Reanalysis data (GSWP3) and Regional Climate Models for Seven Weather Stations of Afghanistan (see Figure
28). The Time Periods for the Observations and the Re-analysis Data is Given in Table 2. For the Climate Models,
the Period from 1970-1999 has been Used.
Faizabad Gardez
Herat Kabul
Kandahar Mazar-i-Sharif
Panjab
Observed precipita�on
Reanalyzed precipita�on (GSWP3)
Spread of modeled precipita�on
Observed temperature
Reanalyzed temperature
Spread of modeled temperature
AFGHANISTAN: CLIMATE CHANGE SCIENCE PERSPECTIVES p294.1.2. CLIMATE MODEL PROJECTIONS The performance of the CORDEX data of the South Asian domain has been checked for the Himalayan area, including the Hindukush and the Karakorum, in Ghimire et al. 2015.11 They concluded that the data “facilitates precipitation evolution and structure over the Himalayan region with a certain degree of uncertainty.” However, the study area does not cover all of Afghanistan; therefore, in order to check their performance and suitability for the region, the historical runs of the CORDEX project were validated against reanalysis data (see text box Re-analysis Data). Single model runs have not been evaluated but the spread of the whole ensemble. This is due to the fact, that the study of Ghimire et al. has shown that the mean of the whole model ensemble outperformances the individual models. In addition, also in the analysis only the whole ensemble is evaluated and not individual models. For the validation, the annual cycle of monthly values of temperature and precipitation has been compared similar to the reanalysis data (Figure 29). The selected time period of the models is from 1970 until 1999 and the modelled data has been evaluated for the same locations that have been used as in the validation of the reanalysis data. With regard to temperature, the spread of the models for all stations, except Faizabad, include the curve for the reanalysis data. This means that the model ensemble is able to reproduce the general temperature patterns of the climate of Afghanistan. Around Faizabad, the models are still able to reproduce the annual cycle, but underestimate the magnitude by around 5°C. This deviation might be due to difficulties of the model in higher altitudes and pronounced topography. The performance of the models on precipitation is considerably lower. The models’ ability to reflect the seasonal cycle is satisfactory with deficits in the East, at the stations Kabul and Gardez, where the models hardly reflect the seasonal cycle. In terms of absolute values for most regions, especially the months from January to April, are largely underestimated by the models. In contrast to the temperature, the mountainous station of Faizabad, Mazar-e Sharif and Panjab show the best results during these months. From March to September, the spread of the models mostly covers the reanalysis data, but still the overall performance in regard of absolute is poor. In total, the performance in regard of precipitation is satisfactory. The principle climatological patterns seem to be reflected with deficits in the East. Absolute values, especially in spring should not be compared. These deficits might also be relevant for changes in the climatic system which is related to climate change. It can therefore not be excluded, that an important change in the climate system over Afghanistan is not reflected in the models. Therefore, the results should be interpreted carefully and the considerable large uncertainty should be taken into account.
AFGHANISTAN: CLIMATE CHANGE SCIENCE PERSPECTIVES p31
5

STATISTICAL METHODS
STATISTICAL METHODS

Heavy precipitation is analyzed as 95th percentile of days above 1mm precipitation. This
is a standard indicator for precipitation extremes and for example used by the European
Union.15
Monotonic linear trends in precipitation and temperature time series were identified using
the Mann-Kendall test.16 It is a robust nonparametric test in which each element is compared
with its successors and ranked as larger, equal or smaller. On this basis, it is possible to test
the statistical significance of rejecting the null hypothesis (for all tests α = 0.05).
Linear trends in the reanalysis data and the model projections have been quantified using
the Theil-Sen estimator.17,18 It is a method to estimate the slope of a trend without being
sensitive against outliers. Since serial independence is a requirement of the test, the
data was checked for autocorrelations using the Durbin-Watson statistic test.19,20 It tests
the null hypothesis that the residuals from an ordinary least-squares regression are not
autocorrelated. If an autocorrelation of the first order was found, trend-free pre-whitening
was applied according to the method proposed by Yue et al. (2002).21 This method was
applied using the “Kendall”22 and the “zyp”23 packages for the R statistical software.24

                                  AFGHANISTAN: CLIMATE CHANGE SCIENCE PERSPECTIVES           p33
LITERATURE AND REFERENCES
1. McSweeney, C., New, M., Lizcano, G. & Lu, X. (2010). ‘The UNDP Climate Change Country
Profiles. Improving the Accessibility of Observed and Projected Climate Information for
Studies of Climate Change in Developing Countries.’ Bulletin of the American Meteorological
Society, Vol. 91, 157-166. Available (December 2016) at: http://journals.ametsoc.org/doi/
pdf/10.1175/2009BAMS2826.1
2. McSweeney, C., New, M. & Lizcano, G. (2010). UNDP Climate Change Country Profiles:
Afghanistan. New York: United Nations Development Programme. Available (December 2016)
at: http://country-profiles.geog.ox.ac.uk/
3. Savage, M. Dougherty, B., Hamza, M. Butterfiled, R., & Bharwani, S. (2009). Socio-Economic
Impacts of Climate Change in Afghanistan. A Report to the Department for International
Development (2009). Available (December 2016) at: http://static.weadapt.org/placemarks/
files/1092/5345354491559sei-dfid-afghanistan-report-1-.pdf
4. Meehl, G.A., Covey, C., Delworth, T., Latif, M., McAvaney, B., Mitchell, J.F.B., Stouffer, R.J., &
Taylor, K.E. (2007). ‘The WCRP CMIP3 Multi-model Dataset: A New Era in Climate Change
Research.’ Bulletin of the American Meteorological Society, 88, 1383-1394. Available (December
2016) at: http://journals.ametsoc.org/doi/pdf/10.1175/BAMS-88-9-1383
5. Jones, C., Giorgi, F. & Asrar, G. (2011). ‘The Coordinated Regional Downscaling Experiment:
CORDEX–an international downscaling link to CMIP5.’ CLIVAR Exchanges, No. 56, 16 (2), 34-
40.
6. Kim, H. (2014). Global Soil Wetness Project Phase 3 (GSWP3), Surface Meteorology 1. Available
(December 2016) at: http://hydro.iis.u-tokyo.ac.jp/GSWP3/exp1.html
7. Afghanistan “Pastoral Engagement, Adaptation and Capacity Enhancement (PEACE)” Project.
Available (December 2016) at: http://afghanpeace.org/
8. DOC/NOAA/NESDIS/NCEI. (2015). Global Surface Summary of the Day - GSOD. National Centers
for Environmental Information, NESDIS, NOAA, US Department of Commerce. Available
(December 2016) at: http://gis.ncdc.noaa.gov/geoportal/catalog/search/resource/details.
jsp?id=gov.noaa.ncdc:C00516
9. Hansen, J., Ruedy, R., Sato, M. & Lo, K. (2010). ‘Global Surface Temperature Change.’ Review of
Geophysics, Vol 48, RG4004. Avialable (December 2016) at: http://onlinelibrary.wiley.com/
doi/10.1029/2010RG000345/epdf
10. GISTEMP Team. (2015). GISS Surface Temperature Analysis (GISTEMP). NASA Goddard Institute
for Space Studies. Available (December 2016) at: http://data.giss.nasa.gov/gistemp/
11. Ghimire, S., Choudhary, A. & Dimri, A. P. (2015). ‘Assessment of the Performance of CORDEX-
South Asia Experiments for Monsoonal Precipitation Over the Himalayan Region during
Present Climate: Part I.’ Climate Dynamics, 1-24. Available (December 2016) at: http://link.
springer.com/article/10.1007/s00382-015-2747-2
12. IPCC. (2013). ‘Summary for Policymakers.’ In Stocker, T.F., Qin, D., Plattner, G.K., Tignor, M.,
Allen, S.K., Boschung, J., Nauels, A., Xia, Y., Bex, V. & Midgley, P.M. (Eds.). (2013). Climate
Change 2013: The Physical Science Basis. Contribution of Working Group I to the Fifth Assessment
Report of the Intergovernmental Panel on Climate Change. Cambridge: Cambridge University
Press. Available (December 2016) at:13. Grasso, L. D. (2000). ‘The Differentiation Between Grid Spacing and Resolution and Their
Application to Numerical Modeling.’ Bulletin of the American Meteorological Society, Vol. 81,
579–580.
14. Jacob, D., Göttel, H., Kotlarski, S., Lorenz, P. & Sieck, K. (2008). ‘Klimaauswirkungen und
Anpassung in Deutschland–Phase 1: Erstellung regionaler Klimaszenarien für Deutschland.’
Climate Change, Vol. 11, 154. Available (December 2016) at: https://www.umweltbundesamt.
de/sites/default/files/medien/publikation/long/3513.pdf
15. EEA. (2014). Precipitation extremes, CLIM 004. European Environment Agency. Available
(December 2016) at http://www.eea.europa.eu/data-and-maps/indicators/precipitation-
extremes-in-europe-2/assessment
16. Mann, H. B. (1945). ‘Nonparametric Tests Against Trend.’ Econometrica, Vol. 13, 245–259.
17. Sen, P. (1968). ‘Estimates of the Regression Coefficient Based on Kendall’s Tau.’ Journal of the
American Statistical Association, Vol. 63, No. 324, 1379-1389. Available (December 2016) at:
https://www.pacificclimate.org/~wernera/zyp/Sen%201968%20JASA.pdf
18. Theil, H. (1950). ‘A Rank-invariant Method of Linear and Polynomial Regression Analysis.’
Royal Netherlands Academy of Sciences, 53, 386-392. Available (December 2016) at: http://www.
dwc.knaw.nl/DL/publications/PU00018803.pdf
19. Durbin, J. & Watson, G. (1950). ‘Testing for Serial Correlation in Least Squares Regression I.’
Biometrika, 37, 409-428.
20. Durbin, J. & Watson, G. (1951). Testing for Serial Correlation in Least Squares Regression II.
Biometrika, 38, 159-178.
21. Yue, S., Pilon, P., Phinney, B. & Cavadias, G. (2002). ‘The Influence of Autocorrelation on the
Ability to Detect Trend in Hydrological Series. Hydrological Processes, 16, 1807-1829. Available
(December 2016) at: http://www.climateaudit.info/pdf/others/Sheng.Yue.2002.pdf
22. McLeod, A. I. (2011). Kendall Rank Correlation and Mann-Kendall Trend Test. Available
(December 2016) at: https://cran.r-project.org/web/packages/Kendall/Kendall.pdf
23. Bronaugh, D. & Werner, A. (2013). Package ‘zyp’: Zhang+Yue-Pilon Trends Package. Available
(December 2016) at: https://cran.r-project.org/web/packages/zyp/zyp.pdf
24. R Core Team. (2013). R: A Language and Environment for Statistical Computing. Available
(December 2016) at: http://www.r-project.org/
AFGHANISTAN: CLIMATE CHANGE SCIENCE PERSPECTIVES p35ACRONYMS AMA Afghanistan Meteorological Authority CMIP Coupled-Model Intercomparison Project GCM General Circulation Model GHG Green House Gas GSOD Global Summary of the Day GSWP3 Global Soil Wetness Project Phase 3 INC Initial National Communication under the UNFCC IPCC Intergovernmental Panel on Climate Change M.A.S.L. Metres above sea level MAIL Ministry of Agriculture, Irrigation and Livestock MEW Ministry of Energy and Water MRRD Ministry of Rural Rehabilitation and Development NAPA National Adaptation Programme of Action NEPA National Environmental Protection Agency RCM Regional Climate Model RCP Representative Concentration Pathway SEI Stockholm Environment Institute SNC Second National Communication under the UNFCC SRES Special Report on Emission Scenarios UNEP UN Environment UNFCCC United Nations Framework Convention on Climate Change WMO World Meteorological Organization
Building Environmental Resilience تقویت انعطاف پذیری محیط زیستی
You can also read