INTEGRATED MOBILITY PLAYER - Investor Presentation September 2017 - FS Italiane
←
→
Page content transcription
If your browser does not render page correctly, please read the page content below
INTEGRATED MOBILITY PLAYER

Investor Presentation
September 2017

Disclaimer

IMPORTANT NOTICE – STRICTLY CONFIDENTIAL

By accessing this investor presentation, you agree to be bound by the following limitations.

This presentation has been prepared by Ferrovie dello Stato Italiane S.p.A, is the sole responsibility of Ferrovie dello Stato Italiane S.p.A.. The information set out
   herein may be subject to updating, revision, verification and amendment and such information may change materially. Ferrovie dello Stato Italiane S.p.A. is
   under no obligation to update or keep current the information contained in this presentation or in the presentation to which it relates and any opinions expressed
   in them is subject to change without notice. None of Ferrovie dello Stato Italiane S.p.A. or any of its respective affiliates, advisers or representatives shall have
   any liability whatsoever (in negligence or otherwise) for any loss whatsoever arising from any use of this presentation or its contents, or otherwise arising in
   connection with this presentation.

This presentation is being communicated in the United Kingdom only to persons who have professional experience in matters relating to investments falling within
   Article 19(5) of the Financial Services and Markets Act 2000 (Financial Promotion) Order 2005 and to persons to whom it may otherwise be lawful to
   communicate it to (all such persons being referred to as relevant persons). This presentation is only directed at relevant persons and any investment or
   investment activity to which the presentation relates is only available to relevant persons or will be engaged in only with relevant persons. Solicitations resulting
   from this presentation will only be responded to if the person concerned is a relevant person. Other persons should not rely or act upon this presentation or any
   of its contents.

The information in this presentation is confidential and this presentation is being made available to selected recipients only and solely for the information of such
   recipients. This presentation may not be reproduced, redistributed or passed on to any other persons, in whole or in part. This presentation is for information
   purposes only and does not constitute or form part of, and should not be construed as, any offer for sale or subscription of, or solicitation of any offer to buy or
   subscribe for, any securities of Ferrovie dello Stato Italiane S.p.A. nor should it or any part of it form the basis of, or be relied on in connection with, any contract
   or commitment whatsoever. This presentation does not constitute a recommendation regarding the securities of Ferrovie dello Stato Italiane S.p.A.

This presentation and the information contained herein are not an offer of securities for sale in the United States and are not for publication or distribution to persons
   in the United States (within the meaning of Regulation S under the United States Securities Act of 1933, as amended.

This presentation is for distribution in Italy only to "qualified investors" (investitori qualificati), as defined pursuant to Article 100 of Legislative Decree no. 58 of 24
   February 1998, as amended and restated from time to time (the Financial Services Act), and as defined in Article 34-ter, paragraph 1(b) of CONSOB
   Regulation no. 11971 of 14 May 1999, as amended and restated from time to time (the CONSOB Regulation), or in other circumstances provided under Article
   100 of the Financial Services Act and Article 34-ter, CONSOB Regulation, where exemptions from the requirement to publish a prospectus pursuant to Article 94
   of the Financial Services Act are provided.

This presentation may contain projections and forward-looking statements. Any such forward-looking statements involve known and unknown risks, uncertainties
   and other factors which may cause Ferrovie dello Stato Italiane S.p.A.’s actual results, performance or achievements to be materially different from any future
   results, performance or achievements expressed or implied by such forward-looking statements. Any such forward-looking statements will be based on
   numerous assumptions regarding Ferrovie dello Stato Italiane S.p.A.’s present and future business strategies and the environment in which Ferrovie dello Stato
   Italiane S.p.A. will operate in the future. Furthermore, any forward-looking statements will be based upon assumptions of future events which may not prove to
   be accurate. Any such forward-looking statements in this presentation will speak only as at the date of this presentation and Ferrovie dello Stato Italiane S.p.A.
   assumes no obligation to update or provide any additional information in relation to such forward-looking statements.

                                                                                                                                                                        2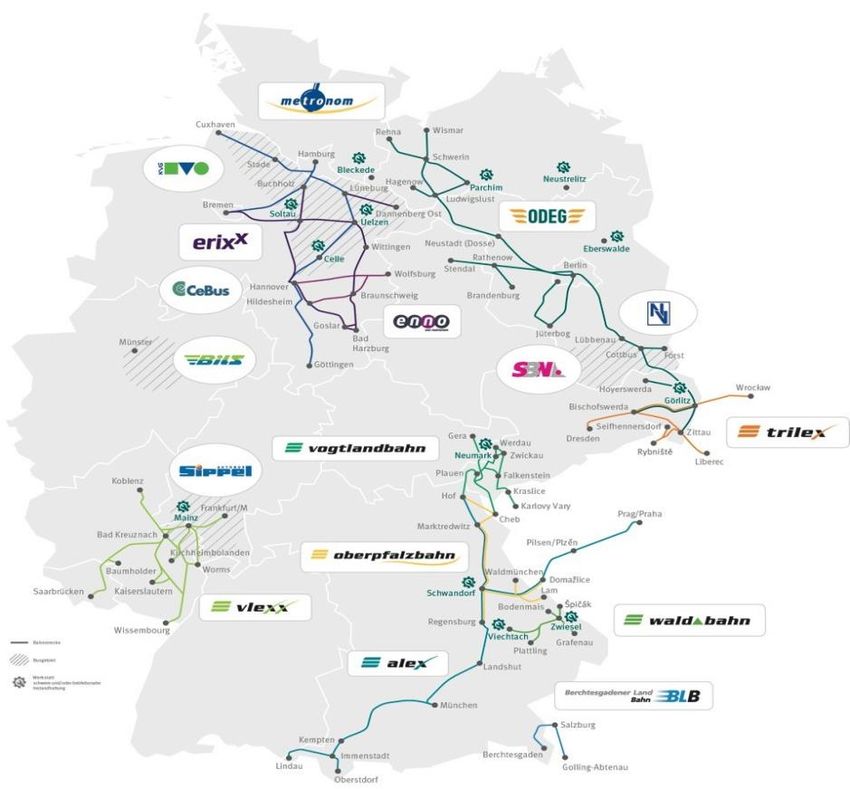
Contents

1      Introduction to Ferrovie dello Stato Italiane Group

2      Operations and Industry Overview

 2.1    Transport Services

 2.2    Infrastructure Services

3      FS Group Strategy Highlights

4      Financial Overview

                                                             3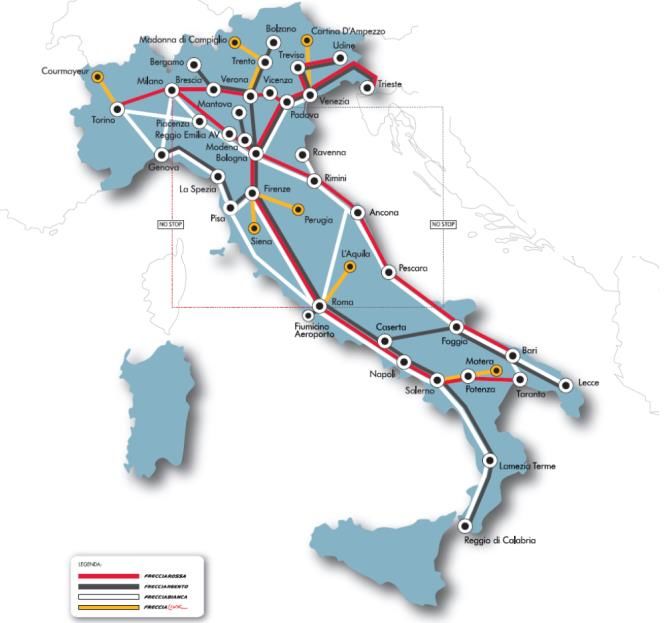
1

    Introduction to Ferrovie dello
    Stato Italiane Group
Introduction to FS Group
Ferrovie dello Stato Italiane SpA (“FS” or the “Issuer”) is the holding company of the Italian railway group (FS
Group), which is the main provider of transport services in Italy by rail and bus both passenger and freight.
FS is 100% owned by the Ministry of Economy and Finance (‘MEF’):
− The MEF, as shareholder, appoints the members of FS’s Board.
− The Government contributes to the funding of infrastructure development under master agreements ‘Contratto
di Programma’ and remunerates FS’s Public Service Contracts (‘PSCs’).
FS, inter alia, controls:
− Trenitalia SpA (“Trenitalia”) is the incumbent railway passenger transport operator for national and regional
services in Italy and provides services abroad mainly in UK and France.
− Rete Ferroviaria Italiana SpA (“RFI”) is the infrastructure manager and owner of the Italian national rail
network, 16,788Km connected with neighbouring countries, operating via a 60 years concession started in
2000 which business is partially regulated by Transport Regulation Authority.
− Busitalia Sita Nord ( “Busitalia”) provides bus transport, both urban and suburban, as well as long-distance
bus services in Italy and abroad.
− Mercitalia Hub which provides freight and logistics services to several industries and clients both in Italy and
abroad
− Other companies involved in infrastructure engineering, real estate and commercial activities.
Since 2011 FS has expanded its business abroad through the acquisition of foreign transport companies: Netinera in
Germany, c2c in UK, Qbuzz in Netherlands, Thello in France, Trainose in Greece. International development is
going on to make FS Group a leading international operator of integrated mobility.
5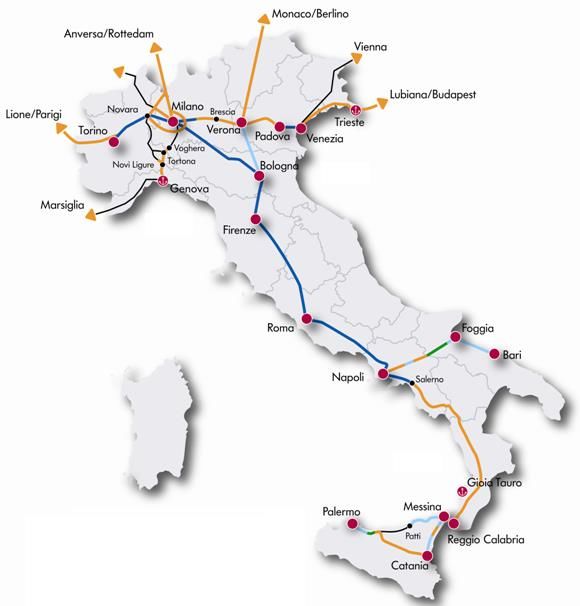
FS Group in a snapshot
                                                                FS Group main line and operating segment (a)

   100%        100%        55,66%             100%       100%         100%          100%        100%         51,00%        100%         60,00%        100%        100%        100%

                                                                                                          Netinera        Ferrovie     Grandi         Grandi                FS Sistemi
Fercredit   Ferservizi Italcertifer      Italferr       RFI       Mercitalia     Trenitalia   Busitalia                                                          Cento
                                                                                                            DL              Sud        Stazioni      Stazioni                 Urbani
                                                                                              Sita Nord                                                         stazioni
                                                                                                           GmbH              Est     Immobiliare       Rail

 OTHER SERVICES                      INFRATRUCTURE                                            TRANSPORT                                          COMMERCIAL REAL ESTATE

   (€m)      2016**                 (€m)             2016**                          (€m)                        2016**                             (€m)          2016**

Revenue          266      Revenue                       2,627        Revenue                                               6,937           Revenue                         702

EBITDA                8   EBITDA                          351        EBITDA                                                1,497           EBITDA                          423

                                  Group Revenue by segment (2016)*                                                    2016 Consolidated Highlights (€mn)
                                Commercial                                                                Revenue                                                 8,928*
                                Real Estate                                   Other
                                                                             services                     EBITDA                                                   2,293
                                   7%
                                                                               2%                         EBITDA Margin                                            25.7%
                                                                                                          EBIT                                                       892

               Infrastructure                                                                             EBIT Margin                                                10%
                    25%                                                Transport                          Net Income                                                 772
                                                                          66%
                                                                                                          Net Invested Capital                                     45,257
                                                                                                          Equity                                                   38,497
                                 * Net of (1,604)m of cons.adj.                                           Net Financial Debt                                        6,760
                                 ** Operating segment results gross of cons.adj.
                                 *** GS Retail sale in July 2016
                                 (a) see appendix for the whole Group’s structure                                                                                                6
                                 Source: FS 2016 Annual Report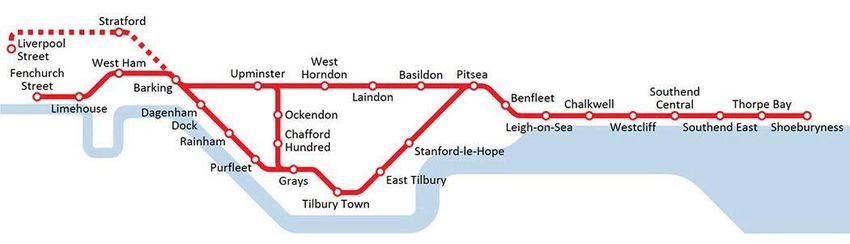
Integrated Mobility Player: Recent Steps

 The restructuring and asset enhancement activities completed in 2016 and first half of 2017 move towards the FS
 Group’s new vision to become an INTEGRATED MOBILITY PLAYER in line with the 2017-2026 industrial plan

                        June 2017
                        Acquisition of 36.7% stake from Astaldi in M5, the                                                    August 2017
                        concessionnaire of the new underground line 5 in Milan.                       Busitalia acquires Qbuzz: a public bus
                                                                                                              transport services company in
                                                                                                                                Netherlands

                April 2017
                Busitalia FAST: JV between Busitalia and SIMET for the
                long distance bus transportation in Italy and Germany
                                                                                                                               February 2017
                                                                                                            Trenitalia enters the UK rail market
                                 January 2017                                                              acquiring the franchisee C2C which
                                 Acquisition of Trainose, the leading                                   operates the London- South Essex line
                                 Greek railway transport company

                                                                                                        January 2017
      November 2016                                                                  Buy-back of Centostazioni 40%
      Ownership transfer from the Italian Ministry of                                                  stake by FS
      Infrastructure and Transport to FS of Ferrovie del
      Sud Est e Servizi Automobilistici, the local public                                   September 2016
      transport company operative in Puglia region.
                                                                                Buy-back of Thello 33% stake
                                                                                                by Trenitalia
 July 2016
 Closing of the sale of 100% of GS Retail                                             2° HY 2016
 after the demerger process of GS                                 Creation of the Mercitalia Hub to
 Group started in 2015.                                      restructure the freight transportation
                                                            and logistics business of the Groups.

                      Source: Company information
                                                                                                                                         7
Key Operating Data
 Long-haul transport                            Long-haul transport       Railway network
  market services -                                PSC services
  “Arrows”-“Frecce”

                                                                                Stations

 Regional transport                               Road transport           Cargo transport

                                                                           Tons Km abroad - million

                 Passengers - km million       Trains\Bus - km thousand    Tons Km total - million

               Source: FS 2016 Annual Report
                                                                                                      8
Benchmarking with European rail players
GRUPPO FS ITALIANE
160
Trend in passenger and cargo traffic
140 GRUPPO FS ITALIANE
160
120
(€b) 2016 2015 2014 Issuer Rating
140
100
Revenue 8.9 8.5 8.4 Fitch BBB 120
80
100
EBITDA margin % 25.7% 23% 25.2% S&P BBB- 60
80
40
EBIT margin % 10% 7.5% 7.9% GRUPPO FS ITALIANE
2011 2012 2013 2014 2015 2016 SNCF
60
160 160
40
140 2011 2012 2013 140
2014 2015 2016
DBAG
120 120
160
(€b) 2016 2015 2014 100
Issuer Rating 140
DBAG100
160
80 80
Revenue 43.3 43.2 39.7 120
140
60 60
100
EBITDA margin % 10.3% 10% 12.9% S&P 40 AA- 120
40
2011 2012 2013 80
2014 2015 2016 2011 2012 2013 2014
100
EBIT margin % 3.4% -0.4% 5.3% Moody’s Aa1 60
80
DBAG 40 DBAG
60
160 2011 2012 2013 2014
160 2015 2016
GRUPPO FS ITALIANE SNCF
40
160 140 160 2011 2012 2013 140
2014 2015 2016
(€b) 2016 2015140 2014 Issuer Rating
120 140 120
Revenue 32.3 31.4120 27.2 Fitch 100 AA 120
100
100 100
80 80
EBITDA margin % 12.8% 14% 8.7% S&P AA-
80 80
60 60
EBIT margin % 6.6% -0.3%60 2.5% Moody’s 40
Aa3 60
40
40 2011 2012 2013 2014 2015 2016 2011 2012 2013 2014
40
2011 2012 2013 2014 2015 2016 2011 2012 2013 2014 2015 2016
DBAG DBAG
160 160
140 140
Source: FS, DB, SNCF Annual Reports 120 120 9
100 100
2.1

      Operations and Industry
      Overview
      Transport services
Transport services in a snapshot
Transport Services
Ferrovie del Trainose is the
The Mercitalia hub Netinera was formed One of the leading BUSITALIA – SITA
Sud Est e leading Greek
born from the following FS’s European railway Nord provides local railway
reorganization of the acquisition of Arriva operators, Trenitalia bus transport, both Servizi
Automobilisti undertaking, it
cargo and logistic Deutschland in Feb transports around urban and
ci operates in provides
businesses of the Group 2011 600m passengers suburban, as well as
Puglia region passengers and
includes: long-distance bus
Netinera transports Passenger activities providing local freight transport
services, tourism and services both at
passengers and are split between passenger
rental national,
freight in the German regional/urban and and cargo
which provides regional and
local and urban medium-long The company transport
logistics services to international
transport market distance organises the services by
several industries level.
replacement of rail rail, bus, tram,
and clients both in Netinera also carries Trenitalia UK is the
Italy and abroad services by bus ones cable car. Acquired on 18
out activities on arm to operates into
international routes to the UK rail market With the January 2017,
the Czech Republic Decree dated the closing of
born from the spin 4 August the process is
off of Trenitalia’s expected in the
operates in France is the Dutch 2016, the
cargo unit which Italian Ministry next weeks,
subsidiary which following the
operates the freight operates public bus of
transportation Infrastructure green light from
Trenord is a 50:50 transport services in European Union.
JV between Trenitalia Netherlands and Transport
and Ferrovie Nord transferred The company
The freight transport Milano Group and the whole has not been
company mainly operates passengers company to yet
active in Germany, rail services in FS consolidated in
Austria, Switzerland Lombardy region the FS Group
and Denmark financial
statements
11Trenitalia Overview
Key highlights Financial highlights
€mn 2016 * 2015 (a)
Wholly owned by FS, Trenitalia is the company which handles rail
Revenues 5,078.7 5,114.3
passenger transport in Italy and abroad
EBITDA 1,394.5 1,480.4
Trenitalia is one of the leading railway operators in Europe
EBIT 332.5 511.9
Everyday manages about 9,000 trains and each year transports c. 600 million
Net Income 116 230
of passengers
EBITDA Margin 27.5% 28.9%
Organized in two* business segments:
EBIT Margin 6.5% 10%
medium/long distance passengers
regional passengers
Medium Long Regional revenues* (€mn)
revenues* (€mn)
distance
Commuter passenger 2016 2015 Change
High Speed services 2016 2015 Change services
International and Regional/Inter- 2,751 2,685 2,47%
2,295 2,398 -4,3%
domestic services regional services
* Note:
Trenitalia demerged its Cargo division allocating the related assets to Mercitalia Rail with effect as of 1 January 2017. This transaction is part of FS Group’s 2017-2026
business plan to relaunch the Cargo business via a specific dedicated company structure.
In accordance with IFRS 5 “Non-current assets held for sale and discontinued operations”, the revenue and costs of such division are recognised in the separate item
“Loss from discontinued operations” in the income statement, after the profit from continuing operations.
Therefore Trenitalia’s 2016 Revenues, EBITDA and EBIT items hereby shown does not include freight division results, which however contributed to the Net Income.
(a) Figures as at 31 December 2016 reflect the application of IFRS 5. For the purposes of a better comparison, figures as at 31 December 2015 were restated accordingly.
Source: Company information, Trenitalia 2016 Annual Report
12Trenitalia Medium/Long Distance Transport
Frecce International Public Service Contract with the State
Stockholm
Kopenhagen
London Amburgo
Amsterdam
Dusseldorf Berlin
Brüssel Warschau
Colonia
Paris
Munich
Berna
Wien
Lyon Milan
Venice
Bologna
Marseille Florence
Other
Lisbona Barcelona Rome connection in
Madrid cooperation
agreement
High Speed services Torino- In January 2017 has been agreed between
Trenitalia, in cooperation with the major
Milano-Brescia-Bologna-Firenze- Trenitalia and Minister of Infrastructure and
European rail undertakings, offers
Roma-Napoli-Salerno Transport the new National PSC with the
international connections from Italy to Austria,
Fast services connecting Roma to Germany and Switzerland state which will have a 10 years duration
Venezia, Verona, Bari and Reggio
Calabria Trenitalia UK is the arm to operates into the The new offer envisages 88 “Intercity Day”
UK rail market currently managing c2c and 20 “Intercity Night” daily plus 10 Intercity
Fast services connecting: Milano franchise for the weekend and revamping of rolling
to Lecce, Genova to Roma and stocks
Milano to Venezia Thello directly offers connections between
Italy and France
Source: Company information
13International transport services: Trenitalia UK
10 February 2017: acquisition by Trenitalia UK of 100% of the train operator C2C from National Express Group
The deal, formally approved by the Department for Transport, worth £72.6 million.
Franchise Agreement until November 2029.
c2c offers commuter passenger services between Fenchurch
Street (East London) and Shoeburyness (South Essex), 64 km
line in 1h.
400 rides for over 42 million passengers/year
Passengers traffic raised in 2015 by 5.3% overall and by 7.6% in
off-peak hours
Top place in the British franchises’ punctuality rank
TRENITALIA UK COMMITMENT IN OTHER FRANCHISES TENDERS:
24 January 2017 Expression of Interest in JV with FirstGorup for the East Midlands
franchise (the JV has been shortlisted)
24 April 2017 Expression of Interest in JV with FirstGorup for the West Coast
Partnership franchise (the JV has been shortlisted)
Source: Company information 14Trenitalia Regional Transport
Overview
Offers mobility service at urban, regional and inter-regional level
Providing customers with about 7,800 trains a day
The relations between Trenitalia and local administrations are regulated by different Public Service Contracts (‘PSCs’) in
which the required level of services are specified in terms of quantity and quality, tariff obligations, fees.
Contracts are subject to specific regulation in terms of eligible costs and adequate capital investments returns.
In 2016 revenues related to regional passenger services equal €2,751mn (+2.47% vs. 2015)
Trenitalia now operates in all 20 Italian Regions with 6/8 years contracts and negotiating for new 15 years contracts*
Service Enhancement
Fleet upgrading with 23 Jazz, 6 Swing, 3 Flirt new trains and 133 Vivalto new carriages, for a total investment of 455 million
Euro in 2016.
Customer satisfaction reached 81.2% in January 2017, with growth in all indicators (punctuality, information, cleaning,
comfort, safety)
Traffic trend
Passengers\km million Trains\km thousand
* See appendix for details
Source: Company information; Trenitalia 2016 Annual Report
15Road Passenger Transport: Busitalia Group
The key player for the growth in local public transportation of FS Group
2017
Busitalia acquires Qbuzz: a public bus
2016 transport services company in
Incorporation of Busitalia Netherlands
2017
Campania and acquisition of
Busitalia FAST: JV with SIMET for the
CSTP the local public transport
long distance bus transportation in
company of Salerno municipality
Italy and Germany
2014 2015
Tender awarded for 100% Incorporation of
Umbria Mobilità Esercizio Venezia City Sightseeing
(regional mobility)
Key Financial figures 2015
€mn 2016 2015 Incorporation of Busitalia Veneto with a
2014 55% controlling interest (Padova and
Revenues 354 330 Incorporation of Busitalia Rail Rovigo urban and extra-urban LPT)
Service (road transport
EBITDA 36 30.2
services to support the
EBITDA Margin 10% 9% railway service)
EBIT 13 10.5 2012 - 2013
EBIT Margin 4% 3% Acquisition of 70% of ATAF Gestioni
(Firenze LPT road transport) in
2012 partnership with Autoguidovie
Partnership with
330 354
292.7
BUSITALIA GROUP
203.1
2011
REVENUE Busitalia was established from the
110.5 +417% division of SITA (1912) into two
68.5 vs 2011 independent companies
2011 2012 2013 2014 2015 2016
Source: Company information; Busitalia Annual Reports
16Group’s transport in Germany: Netinera Deutschland
On Feb 2011 FS Italiane, in partnership with Cube Infrastructure, finalised the acquisition from Deutsche Bahn of Arriva
Deutschland, renamed Netinera Deutschland - FS Italiane owns 51% of the company and Cube Infrastructure the
remaining 49%.
Netinera is the second largest operator providing regional rail transport in Germany.
The Netinera Group consists of several operating companies active in passenger traffic, freight transportation, infra
management and rolling stock maintenance.
The Group is arranged into four areas that adopt a regional customer-oriented business approach.
Key figures Network Overview
€m 2016 2015
Operating revenues 603 573
EBITDA 78 70.5
EBITDA Margin % 13% 12%
EBIT 26 23
EBIT Margin % 4% 4%
Source: Company information; Netinera 2016 Annual Report
17Freight and Logistics services: Mercitalia Hub
Integrated governance for the freight services
The new Mercitalia Hub has been created with the aim of restructuring the cargo business and rationalize the freight
operators active in the Group to improve quality and efficiency of cargo services provided
Strengthen the presence in Intermodal transport segments with higher attraction/growth
Develop synergies in terms of revenues (gain/improve access to strategic hubs) and costs (scale economies)
Increase and strengthen the customer offer and service portfolio (i.e. offer E2E services by extending the current
offer and including last-mile transport)
HUB
OTHER MINOR
SUBSIDIARIES
182.2
Operations and industry
overview
Infrastructure servicesFS infrastructure services in a snapshot
Infrastructure
Services
RFI is the company of FS with the public role of Italferr, the FS’s engineering firm, offers its services
INFRASTRUCTURE MANAGER on the Italian and foreign markets in the field of
It is responsible for the whole national rail infrastructure (track, the transport engineering
stations and terminals) Designs and builds infrastructural and technological
As the sole concessionaire of the network, RFI operates according to projects included in investment and upgrade plans for
contracts with the Government the railways
RFI ensures to railway undertakings the access to the railway Italferr is already active in Italy and abroad (Europe,
network, guarantees the maintenance and the safe circulation on the the Middle East, Asia, Africa and Latin America)
whole network, manages the investments for the upgrading of railway
lines and develops the technology of systems and materials
According to the liberalization rules of the railway sector RFI is
required to allow transparent and non discriminatory access to the
infrastructure network
RFI is responsible for 2,200 stations
Within the FS Infrastructure segment, RFI is the main company for assets and revenues
Source: Company information; RFI 2016 Annual report
20RFI Overview
Key figures HS lines in Italy
€mn 2016 2015
Revenues 2,575 2,486
Track access
1,058 1,006
charges Draft
CdP-Service 975.5 975.5
Sale of electrical energy for Work In
200 159 progress
traction
Other income 341 345
Operating (HS)
EBITDA 357 279
EBITDA margin % 14% 11% Operating (HS
EBIT 215 160 up to 250 km\h)
EBIT margin % 8% 6%
Net Income 181 129
Network highlights (km)
Classification for: 2016
Type of track
Double track lines 7,647
Single track lines 9,141
Electrification
Double track electrified lines 7,570
Single track electrified lines 4,453 Travel time on ETR trains By the end of 2017
Not electrified lines 4,765
Linee TO-MI MI-BO BO-FI RM-NA RM-MI RM-MI
Total km of lines 16,788 Before
1: 22’ 1: 42’ 60’ 1: 27’ 4: 30’
Type of service HS
2:55’ no stop 2:30’ no stop
Conventional network 23,085
2:40’ 2:15’
HS lines HS 1: 00’ 1: 02’ 35’ 1: 08’
1,350 MI Rogoredo MI Rogoredo
Total tracks Length 24,435 RM Tiburtina RM Tiburtina
Source: Company information; RFI 2016 Annual report and RFI Website 21RFI Regulatory framework
Contracts with the State
As foreseen by the Concession Act and Legislative Decree188/2003, the relation between RFI and the Ministry of
Infrastructure and Transport (MIT) is governed by the Contratto di Programma (‘CdP’)
According to the current regulatory framework, the Contratto di Programma is organized in two main parts:
Contratto di Programma – Investment Part - CdP-I Contratto di Programma – Services Part - CdP-S
The contract regulates the relations between RFI and the This act regulates the relationship between RFI and the
MIT exclusively for the implementation of investment MIT concerning funds for ordinary and extraordinary
programs for the modernization and development of the maintenance of the rail network and other activities
infrastructure relating to safety, legal obligations and
technologies. (including safety, security and navigation)
The CdP-S for 2012-2014 was extended to 31 December
The new CdP-I for the 2017-2021 period as defined by the 2016 at the same terms and conditions to complete the
MIT provides resources for Euro 13 billion. Closing of the new 2016-2021 GPC-S formalisation and approval process
approval process by the competent authorities expected
within the year.
Regulation of access to infrastructure network - Transport Regulation Authority
The Transport Regulation Authority (ART) is the independent authority which regulates access to rail infrastructure
In November 2015 the ART released its decision N. 96 on the criteria for determining access charges for the use of national rail
infrastructure.
The decision defined: a) a five year regulatory period, b) perimeter of relevant costs, c) market segmentation based on the
main types of service, d) new classification of the network, e) «Caps» to the segment average kilometric charge for the
purpose of market sustainability, f) requirements for regulatory accounting.
ART defined a WACC of 4.52% as minimum return of part of the invested capital of RFI.
On 1st July 2016, the ART released its decision n. 75/2016 validating the 2016-2021 charging scheme provided by RFI for the
Minimum Access Package.
Source: Company information; RFI 2016 Annual report
223
FS Group Strategy
HighlightsTHE FS GROUP’S NEW VISION to grow in the new mobility context
2017 – 2026 Industrial Plan: 5 STRATEGIC PILLARS
Integrated mobility solutions mainly through:
Modal
Growth in the rail and road LPT sector
integration Entry into new market segments (e.g. Long Distance road transport)
for passengers Integration of rail and road transport services of the local railways
Development of integrated logistics services through
Integrated more efficient traction (cost optimisation/km) and service quality with the
logistics creation of the MERCITALIA hub
Entry into new segments to offer an end-to-end service
Creation of an integrated infrastructure hub to ensure better effectiveness in
Integrated planning and management transport infrastructures through:
infrastructure integration of railway and road infrastructures through the merger with ANAS*
consolidation of railway networks under concession
Participation in international infrastructural projects as a General
International Contractor and/or O&M services
Development Growth in international rail transport services
Growth in international LPT
Digital & Development of an Extended Customer Experience to integrate mobility and
Customer ancillary services
Centricity FS Group’s transformation into a Data Driven Company and Digital disruptor
* Azienda Nazionale Autonoma delle Strade is the concessionaire of part of Italian road and highway (100% MEF)
Source: 2017-2026 FS Industrial Plan; Company information
24Integrated Infrastructure: ANAS transaction
Integrated
infrastructure
On 24 April 2017 a Law Decree defined the merger of ANAS into FS Group through the transfer
of ANAS’ entire share capital - without any consideration to be paid by FS.
The decree provides two conditions precedent to be satisfied in favour of FS in order to complete the
transaction:
1. The assessment of the accounted provisions for litigations as adequate in respect of the potential
litigations worth;
2. The completion of the Contratto di Programma for the years 2016-2020 (Programme Contract) with
the Minister of Infrastructure and Transport (MIT) which regulates the relationship between ANAS
and MIT. It defines the annual grants the Minister will transfer to ANAS for maintenance services of
the road network and new infrastructure investments. The mechanism is similar to the Contratto di
Programma which RFI has with MIT. The annual grants will be accounted in the form both of
revenues (when related to ordinary maintenance) and as a deduction on the asset value (when
related to new infra investments).
The Contratto di programma has been approved by the CIPE on August 7th 2017 and closing of the
process by the competent authorities is expected within the year.
* Azienda Nazionale Autonoma delle Strade is the concessionaire of part of Italian road and highway (100% MEF)
Source: 2017-2026 FS Industrial Plan; Company information
254
Financial OverviewFS Group financial performance continues to improve
9,000 8,928 CAGR
8,585 Revenue +1.56%
8,500 8,329 8,390
8,264 8,228
Increase in revenue
8,000 over the period
€mn 2,293 EBITDA
1,975
7,500
1,782
2,030 2,114
1,918
7,000
CAGR
6,635 +0.47%
6,500 6,610
6,482 Operating Costs
6,310 6,296 6,276
6,000 …focus on expenses containment
2011 2012 2013 2014 2015 2016
Consistent profitability and margins
2,500 2,293 30%
2,114 25.2% 25.7%
1,975 25% 23.0%
2,000
20%
1,500
€mn 15%
1,000 892 10.0%
772
659 644 10% 7.9% 7.5%
464
500 303
5%
0 0%
2014 2015 2016 2014 2015 2016
EBITDA Margin EBIT Margin
EBITDA EBIT Net Income
Source: FS 2016 Annual Report 27Group revenues breakdown
In 2016 Revenues increased by €343 million (+4% vs 2015), as a result of the rise in revenue from sales and services (+€27
million) and other income (+€316 million).
Transport Services “Market”: strong performance of the short-haul passenger segment (+€56 million) - both domestic rail and
road and international rail - offset by the decrease in the long-haul passenger segment (-€99 million), mainly due to the
tightening in the average yield following the increased intermodal competitive pressure, in addition to the lack of the incremental
traffic originated by Expo 2015.
Transport Services “PSCs”: revenue from Public Service Contracts – with Regions and Government - increase by €62 million
Infrastructure: increase in toll revenues due to the greater production volumes requested by railway companies whereas
revenues from CdP-Services keep stable
Other income rose by €316 million, mainly as a result of the €365 million gain from the sale of Grandi Stazioni Retail’s
assets
Revenues breakdown
€mn 2016 2015 change %
Transport services 6,385 6,383 0.0%
Transport Revenues: Market vs. PSCs
Passenger traffic products 3,164 3,207 -1.3%
Cargo traffic products 860 878 -2.1% 37% 36%
Market revenues 4,024 4,084 -1.5%
PSCs and other contracts 248 247 0.4%
Fees from the Regions 2,113 2,052 3.0%
63% 64%
Public service contract fees 2,361 2,299 2.7%
Infrastructure services 1,282 1,256 2.1%
Other services revenues 241 242 -0.4%
Other income 1,020 704 44.9% 2016 2015
Market revenues Public service contract fees
Total Group Revenues 8,928 8,585 4%
Source: FS 2016 Annual Report
28Focus on operating costs
In 2016 operating costs amounted to €6,635 million, up by 0.4% only on 2015 (€6,610 million)
The rise in personnel expense mainly due to new national labour agreement for railway workers, was almost fully offset by the
workforce organisation efficiency project and the reduction in the annual average employee numbers.
Raw materials consumption rose following greater investments in infrastructure, offset by smaller costs for rolling stock.
The increase in “Electrical energy and fuel for traction” was mainly the result of the net effect of higher electrical energy costs, due
to the new regulatory provisions in the electricity market, and smaller fuel costs, caused by the generalised drop in fuel prices.
Services rose following the net effect of the increase in transport services, offset by savings in relation to maintenance services.
Transport services account for the majority of operating expenses given the higher proportion of labour and service costs
Breakdown of operating costs Total operating costs by division
5,000 6,000 5,396 5,440
3,934 3,951
4,000 Personnel 5,000
Transport
expense
4,000
3,000
2,386 2,421 Infrastructure
Raw materials 3,000
2,000 2,256 2,276
1,159 1,230 2,000 Commercial
1,000 Services Real Estate
1,000
295 220 279 258 Other services
€mn
0 €mn
0
2015 2016
Other costs 2015 2016
-1,000 incl. Cons. Adj.
-869 -1,000
-967 Capitalisation
-2,000 -2,000 -1,557 -1,619
Source: FS 2016 Annual Report
29First Half 2017 Performance highlights
Main results and financial data (€mn) First half 2017 First half 2016 Change %
Revenue 4,554 4,250 304 7.2
Operating costs (3,515) (3,245) 270 8.3
Gross operating profit (EBITDA) 1,039 1,005 34 3.4
Operating profit (EBIT) 339 344 (5) (1.5)
Profit for the period 273 286 (13) (4.5)
Investments of the period 1,849 2,198 (349) (15.9)
Total cash flows (1,242) 424 (1,666)FS Group’s CAPEX profile
FS Italiane Group confirms its position as the leading investor in the development of transport, infrastructure and logistics
FS’s investment expenditure in 2016 came to € 5,950 million (€1,649 million of which self-financed and €4,301 million through
government grants mainly earmarked to infrastructure) up by 8.2% on the already sizeable amount invested in 2015.
The majority of capex is related to the maintenance and development of the rail infrastructure network carried on by RFI, with a
focus on Traditional network (~ €4bn).
Trenitalia accounts for 26% (~ €1,5bn) up by 9% on the previous year and invested 63% of its capex to purchase new rolling
stock both for long haul and regional passenger transport:
€ 614 million was earmarked to additional “Frecciarossa 1000”
€ 455 million went to the new regional fleet
FS Capex in 2015 - 2016 2015 - 2016 capex breakdown
7,000
5,950
6,000 5,497 Change 4%
RFI - Traditional
+8.2% network
5,000
9%
26%
4,000 RFI - High Speed
network
3,000 26%
2,000 62% Trenitalia
3% 3%
1,000 67%
2015
Other capex
€mn 0
2015 2016 2016
Source: FS 2016 Annual Report
31FS’ debt profile
FS Group’s total gross financial debt (long term+short term) amounts to € 11,794mn* at 30 June 2017 vs. € 11,862mn* at YE 2016
The bulk of FS Group’s debt is held by FS Holding (€ 8,204mn)
Part of FS' debt is funded directly through guaranteed State transfers (€ 2.81 billion out of the total debt of € 11.79 billion at 30 June
2017). This debt is earmarked to infrastructure investments.
With € 3.05 bn outstanding, FS has significantly increased the use of senior unsecured bonds for its funding needs since
the establishment of the EUR 4.5bn EMTN Programme, which now account for 32% of financial sources. Supranational
entities such as EIB, Cdp, Eurofima, still act as important Group’s lenders whereas bank lending accounts for 14%.
Furthermore FS has a € 1.5bn committed revolving credit facility underwritten by the a pool of 10 banks in May 2015 having a 3-
year maturity and additional uncommitted credit lines granted by many primary banks.
Net Financial Debt amounts to € 8,063mn at 30 June 2017 up from € 6,742mn at YE 2016
Breakdown Financial sources (a) Split of debt by company as of 30 June 2017
Supranational Entities EMTN Bonds Bank Loans Gross financial debt
€mn
14% FS (Holding Company) 8,204
11%
12% Rete Ferroviaria Italiana 1,830
13%
Trenitalia 915
88%
32% 76% Other Group’s Companies 845
2012 54% Total Long Term Debt + Short Term
2013 Financing 11,794*
*Of which € 9,339mn long term debt and € 2,455mn short term debt and current
2017 portion of long term debt
EMTN bonds in CSPP since July 2016 (b)
(a) These percentages are calculated on the long term debt held by FS\RFI\TI which amounts to around 9 billion
(b) In PSCC from July 2015 to July 2016
Source: FS 2016 Annual Report and 2017 interim report highlights 32Balanced debt maturity profile
Effective management of financial expense
The Group has a balanced debt maturity profile extending over the next 15 years, with the majority of maturities falling due over
the next 5 years.
Historically low borrowing costs and an effective management of financial costs, including interest rate risk management
policies, has resulted in a containment of interest expense on debt generating value for the Group.
In 2016 interest expense on debt was a record low at 1.7%.
Group long term debt maturity profile * Interest on financial liabilities **
2,000
1,800
3.1%
1,600
2.8% 2.8%
2.7%
1,400
2.4%
1,200
1,000 1.7%
800
600
400
200
€mn
0
2011 2012 2013 2014 2015 2016
* Maturity profile calculated on the long term debt, included the current portion of the long term debt, held by FS\RFI\TI which amounts to around 9 billion
** The financial expense is net of government grants, therefore the ratio is calculated on the debt not funded through guaranteed government grants
Source: FS 2016 Annual Report
33Debt service capacity
Given improvement in profitability and conservative debt management, Net Debt / EBITDA has decreased to 2.9x
in 2016 from 4.7 in 2012.
Historically low borrowing costs and effective management of financial costs, including interest rate risk management
policies, resulted in EBITDA interest cover improved substantially in the last five years reaching 16x in 2016.
FS Italiane maintains a strong capitalisation.
Leverage evolution and EBITDA interest coverage Capitalisation
18 35%
16 31% 31%
16.0 31%
30% 30%
14
29%
12 10.8 10.8
9.9 25%
10 8.9 24%
8 23%
20% 18%
6.1 5.6 5.6
6 5.2 17% 18%
5.2
4 4.7 15%
4.2
2.9 3.4 2.9
2
x.x - 10%
2012 2013 2014 2015 2016 2012 2013 2014 2015 2016
Net Financial Debt\EBITDA Total Debt \ EBITDA Net Financial Debt\Equity Total Debt\EQUITY
EBITDA\Interest expense
Source: FS Annual Reports
34Rating Overview
RATING COMMENTS
FS' rating reflects the:
“very important” role for the Italian government as holding
group of the country’s national railway and the “integral” link
Corporate Outlook
Rating
BBB- STABLE
with its sole owner (Ministry of Economy and Finance)
“Strong” business profile
“Intermediate” financial risk profile
Stand
Alone Outlook
Credit bbb STABLE Stand Alone Credit Profile ONE NOTCH UPLIFT
Profile On September 16th 2014 the Stand Alone Credit Profile
(SACP) was revised upward to ‘bbb’ from ‘bbb-’, due to
the improvement of FS Italiane’s “financial risk profile”
(from “significant” to “intermediate”)
FS' rating reflects the:
Corporate Outlook Full ownership and high integration with the Italian
Rating BBB STABLE government and its key role in the national
infrastructural development
Stand
Outlook Standalone rating at BBB having good standalone
Alone BBB STABLE
Rating features underpinned by a dominant market share in
passenger transportation services
35Closing remarks: key credit strengths
Integrated Mobility Operator
Sole concessionaire of the rail network until 2060
Regulated Infrastructure business
Market leading positions in all passenger rail transport services in Italy
Business diversification (product\geographical)
Track record of resilient performance
High technical barriers to entry and capital requirements
Effective and disciplined financial management
36Appendix: 2016 Consolidated Financial Statements
Income Statement Reclassified Statement of Financial Position
€mn 2016 2015 Change % €mn 2016 2015 Change
Total Revenues 8,928 8,585 4.0% Net operating Working Capital 404 929 (525)
Of which:
Other Net Assets 591 (581) 1,172
Transport 6,385 6,383 +1.6%
Infrastructure 1,282 1,256 2.1% Working Capital 995 348 647
Others 1,261 946 33.3%
Operating Costs (6,635) (6,610) 0.4% Net non-current assets 47,330 47,357 (27)
Of which:
Other provisions (3,068) (3,010) (58)
Employee costs (3,951) (3,934) 0.4%
Net assets held for sale
Raw materials (1,230) (1,159) 6.1%
Service costs (2,421) (2,386) 1.5%
Other net operating costs 967 869 11.3% NET INVESTED CAPITAL 45,257 44,695 562
EBITDA 2,293 1,975 +16.1%
EBIT 892 644 38.5% Net current financial debt 353 884 (531)
Net non-current financial debt 6,407 5,858 549
Profit before Tax 798 537 48.6%
Net financial debt 6,760 6,742 18
Income taxes (26) (73) 64.4% Equity 38,497 37,953 544
Group Profit 772 464 66.4% COVERAGE 45,257 44,695 562
Statements of Cash Flows
€mn 2016 2015
Profit for the year 772 464
Net cash flows generated by operating activities 1,395 1,468
Net cash flows used in investing activities (1,177) (1,878)
Net cash flows generated by financing activities 815 407
Total cash flows 1,032 (3)
Opening cash and cash equivalents 1,305 1,308
Closing cash and cash equivalents 2,337 1,305
37Appendix: HY 2017 Consolidated Financial Statements
Income Statement Reclassified Statement of Financial Position
€mn First half 2017 First half 2016 Change % €mn 30-06-2017 31-12-2016 Change
Total Revenues 4,554 4,250 Net operating Working Capital 1,353 404 949
7.2%
Other Net Assets 651 591 60
Operating Costs (3,515) (3,245) 8.3%
Working Capital 2,004 995 1,009
Of which:
Employee costs (2,047) (1,984)
Net non-current assets 47,459 47,330 129
Raw materials (553) (449)
Other provisions (2,983) (3,068) 85
Service costs (1,243) (1,140) Net assets held for sale
Other net operating costs 328 328
NET INVESTED CAPITAL 46,480 45,257 1,223
EBITDA 1,039 1,005 3.4%
EBIT 339 344 -1.5% Net current financial debt 951 353 598
Net non-current financial debt 7,122 6,407 715
Profit before Tax 291 298 -2.3% Net financial debt 8,073 6,760 1,313
Equity 38,407 38,497 (90)
Income taxes (18) (12) 50%
Group Profit 273 286 -4.5% COVERAGE 46,480 45,257 1,223
Statements of Cash Flows
€mn First half 2017 First half 2016
Profit for the year 273 286
Net cash flows generated by operating activities (472) 750
Net cash flows used in investing activities (810) (853)
Net cash flows generated by financing activities 40 527
Total cash flows (1,242) 424
Opening cash and cash equivalents 2,337 1,305
Closing cash and cash equivalents 1,095 1,729
38Appendix: Trenitalia Regional Transport- Public Service Contracts
Regional PSCs Local Authority Agreement
Regions are competent for Regional Public Service Contracts Signed with Trenitalia for the period 2016-2018. For the
in which scheduling, pricing and planning of the services are Emilia Romagna period 2019-2041 the PSC has been assigned to
set Trenitalia+Tper by public tender.
Lombardia Signed for the period 2015-2020
Signed for the period 2015-2020 2020 which could be
Umbria
TICKET PRICING replaced by a 15 years PSC 2018 - 2032
Signed for the period 2015-2023 which could be
Veneto
Contracts are subject to specific regulation that defines eligible replaced by a 15 years PSC 2018 – 2032.
costs in terms of company operational expenses, depreciations P.A. Bolzano Signed for the period 2016-2024
and adequate capital investments returns. P.A. Trento Signed for the period 2016-2024
Extension for the period 2015-2017. Expected award ex
Friuli VG art. 5.5 Regulation 1370/2007 for the 2018-2019 period,
Local Authorities establish the share of the cost to be covered pending direct award to Trenitalia for a 15 years PSC.
by tariffs charged to the users while meeting the remaining Extension for the period 2015 – 2016, already signed a
Sardegna
part of those total costs with fees on their own charge which 9 years PSC for the period 2017 – 2025.
Signed for the period 2015 – 2016 which will be
are contracted in the PSCs. Sicilia
followed by a 10 years PSC 2017-2026
Signed for the period 2015 – 2023 which could be
CONTRACT DURATION Toscana
replaced by a 15 years PSC 2018 – 2032.
Signed for the period 2015 – 2020 which could be
Trenitalia renewed almost all of the contracts for 6/8 years Lazio
replaced by a 15 years PSC 2018 – 2032.
and is negotiating with most of the Regions to replace Signed for the period 2015 – 2023 which could be
Abruzzo
them with new contracts of 15 years. replaced by a 15 years PSC 2018 – 2032.
Signed for the period 2015-2023 which could be
Marche
replaced by a 15 years PSC 2018 – 2032.
Trenitalia mainly self-finances its own rolling stock. A put Will be signed for the period 2017-2019/202, pending
clause in favour of Trenitalia provides that all the rolling Piemonte direct award to Trenitalia of a new multi-annual PSCs
stocks accounted along the contract life by Trenitalia according for one/two areas of the Region
Signed for the period 2015-2023 2023 which could be
to the contractual terms have to be purchased by the Region Campania
replaced by a 15 years PSC 2018 – 2032.
should the services be assigned to another company Signed for the period 2015-2017 except Puglia for
Liguria – Calabria -
2016-2017 which will be followed by a 15 years PSC
Puglia 2018 – 2032
Molise Signed PSC for the period 2015-2023 which could be
Basilicata replaced by a 15 years PSC 2018 – 2032
Expected award ex art. 5.5 Regulation 1370/2007 for
Valle d'Aosta the 2017-2018 period, pending the direct award 39to
Trenitalia or a tender of a new multi-annual PSC.Please visit our internet site:
http://www.fsitaliane.it/
Investor Relations section:
http://www.fsitaliane.it/fsi-en/Investor-Relations
INVESTOR RELATIONS CONTACTS:
Stefano Pierini – Head of Finance
Tel.+39 06 44102348
Mail: s.pierini@fsitaliane.it
Vittoria Iezzi – Head of Investor Relations and Credit Rating
Tel. +39 06 44106655
Mail: v.iezzi@fsitaliane.it
Lorenza Di Cintio – Investor Relations and Credit Rating
Tel. +39 06 44103772
Mail: l.dicintio@fsitaliane.it
40You can also read