Using Application Programming Interfaces to Access Google Data for Health Research: Protocol for a Methodological Framework
←
→
Page content transcription
If your browser does not render page correctly, please read the page content below
JMIR RESEARCH PROTOCOLS                                                                                                                    Zepecki et al

     Protocol

     Using Application Programming Interfaces to Access Google Data
     for Health Research: Protocol for a Methodological Framework

     Anne Zepecki1*, BS; Sylvia Guendelman1*, PhD; John DeNero2, PhD; Ndola Prata1, MD, MSc
     1
      The Wallace Center for Maternal, Child, and Adolescent Health, School of Public Health, University of California, Berkeley, Berkeley, CA, United
     States
     2
      Department of Electrical Engineering and Computer Sciences, College of Engineering, University of California, Berkeley, Berkeley, CA, United States
     *
      these authors contributed equally

     Corresponding Author:
     Anne Zepecki, BS
     The Wallace Center for Maternal, Child, and Adolescent Health
     School of Public Health
     University of California, Berkeley
     2121 Berkeley Way #5302
     Berkeley, CA, 94720
     United States
     Phone: 1 408 335 5009
     Email: annezepecki@berkeley.edu

     Abstract
     Background: Individuals are increasingly turning to search engines like Google to obtain health information and access resources.
     Analysis of Google search queries offers a novel approach, which is part of the methodological toolkit for infodemiology or
     infoveillance researchers, to understanding population health concerns and needs in real time or near-real time. While searches
     predominantly have been examined with the Google Trends website tool, newer application programming interfaces (APIs) are
     now available to academics to draw a richer landscape of searches. These APIs allow users to write code in languages like Python
     to retrieve sample data directly from Google servers.
     Objective: The purpose of this paper is to describe a novel protocol to determine the top queries, volume of queries, and the
     top sites reached by a population searching on the web for a specific health term. The protocol retrieves Google search data
     obtained from three Google APIs: Google Trends, Google Health Trends (also referred to as Flu Trends), and Google Custom
     Search.
     Methods: Our protocol consisted of four steps: (1) developing a master list of top search queries for an initial search term using
     Google Trends, (2) gathering information on relative search volume using Google Health Trends, (3) determining the most popular
     sites using Google Custom Search, and (4) calculating estimated total search volume. We tested the protocol following key
     procedures at each step and verified its usefulness by examining search traffic on birth control in 2017 in the United States. Two
     separate programmers working independently achieved similar results with insignificant variation due to sample variability.
     Results: We successfully tested the methodology on the initial search term birth control. We identified top search queries for
     birth control, of which birth control pill was the most popular and obtained the relative and estimated total search volume for
     the top queries: relative search volume was 0.54 for the pill, corresponding to an estimated 9.3-10.7 million searches. We used
     the estimates of the proportion of search activity for the top queries to arrive at a generated list of the most popular websites: for
     the pill, the Planned Parenthood website was the top site.
     Conclusions: The proposed methodological framework demonstrates how to retrieve Google query data from multiple Google
     APIs and provides thorough documentation required to systematically identify search queries and websites, as well as estimate
     relative and total search volume of queries in real time or near-real time in specific locations and time periods. Although the
     protocol needs further testing, it allows researchers to replicate the steps and shows promise in advancing our understanding of
     population-level health concerns.
     International Registered Report Identifier (IRRID): RR1-10.2196/16543

     (JMIR Res Protoc 2020;9(7):e16543) doi: 10.2196/16543

     https://www.researchprotocols.org/2020/7/e16543                                                          JMIR Res Protoc 2020 | vol. 9 | iss. 7 | e16543 | p. 1
                                                                                                                        (page number not for citation purposes)
XSL• FO
RenderX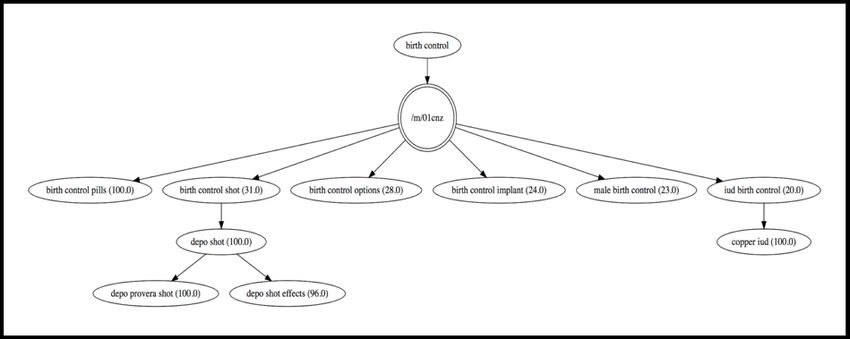
JMIR RESEARCH PROTOCOLS                                                                                                           Zepecki et al

     KEYWORDS
     Google; search data; infodemiology; infoveillance; infodemic; reproductive health; abortion; birth control; Google Trends; APIs

                                                                          questionable or invalid findings and problems with replicability
     Introduction                                                         and comparability across studies [34,35]. In response to these
     Individuals in the United States seeking health information          shortcomings, Mavragani and Ochoa [35] recently proposed a
     online turn to search engines first. According to a 2012 Pew         concise step-by-step methodological framework that describes
     Internet & American Life survey, 83% of users identified             how to select the appropriate keyword, region, time period, and
     Google as their main search engine [1]. Health questions and         category for analysis of search queries to ensure the validity of
     concerns are frequently of a sensitive nature, so queries people     health assessments with the web-based Google Trends tool.
     type privately into a search engine can provide insight about        This framework, if used appropriately by researchers, should
     their true health concerns, especially those that they may not       prove useful to ascertain more uniformity and comparability
     be comfortable sharing with their clinician or a research survey.    across studies and further our insight into human behavior.
     Stephens-Davidowitz has found that these types of searches           Less noted is that Google data is also available through Google
     often capture what people actually “do, think, or want” because      application programming interfaces (APIs). Multimedia
     people reveal “some very personal things” in constructing their      Appendix 1 compares the Google Trends website and the API
     Google queries [2].                                                  and illustrates their similarities and differences through an
     The most popular tool for analyzing and aggregating patterns         example. The Google Trends API can be used as a first step to
     of search data is Google Trends, a public website that has           identify top queries or search terms, and the API can be used
     provided real-time and archived data on Google queries by users      in combination with two other Google APIs—Google Health
     since 2004 [3]. It has been used to study online behavior on         Trends API and the Custom Search API—to extend the
     diverse health topics, such as early detection of influenza          researcher’s understanding of search behaviors. The reason to
     epidemics [4-6], pertussis outbreak monitoring [7], asthma           combine APIs is that although the Google Trends website gives
     monitoring [8], and cancer detection [9,10]. The tool has also       insight into search query volume, the additional APIs are needed
     been used to study public interest in cancer [11,12], suicide        to relate search intent to individual websites. All three APIs
     assessment [13,14], depression-related information seeking           allow users to write code in a programming language such as
     [15], lifestyle-disease surveillance [16], bariatric surgery [17],   Python to retrieve sample data directly from Google servers.
     herpes zoster vaccinations [18], searches for walk-in clinics and    However, access to the Google Trends API and Health Trends
     emergency departments [19], obesity-related behavior [20], and       API is restricted to researchers and requires an application to
     reproductive health [21-26]. Research using this tool has            Google.
     increased over 20-fold between 2009 and 2018 [27].                   This article aims at documenting and illustrating a novel protocol
     From a methodological standpoint, Google Trends has been             for the use of three Google APIs to determine search query
     used to measure web-based interest and variations of this interest   volume and individual websites reached by a given population
     over time [7,18,21,28], assess correlations between search           searching using a health-related search term. This protocol is
     queries with other data sources to inform public health and          not the only one enabled by these APIs but is appropriate for
     policy [9,26], and to forecast disease occurrence and outbreaks      the stated aim. We draw on examples from our study, which
     [4,6,29-31]. These applications fall within the emerging field       seeks to examine insights obtained from aggregated search
     of infodemiology. As first described by Eysenbach,                   queries related to the prevention of pregnancy. Analyses of
     infodemiology is “the science of distribution and determinants       queries related to birth control are relevant for policy and
     of information in an electronic medium, specifically the internet,   programmatic efforts because public funding and access to birth
     or in a population, with the ultimate aim to inform public health    control are increasingly under attack in the United States [36].
     and public policy” [32]. A related term, infoveillance, has been     As access becomes more restrictive, use of the web may become
     used where infodemiology methods are employed for                    more important in decision making about family planning.
     surveillance.                                                        Since there are no accepted methodological standards for the
     While infodemiology was first used to analyze the quality of         use of Google APIs in academic research, our paper contributes
     information on websites (ie, supply side), the scope has             to the systematization of an approach to combining APIs. The
     expanded to include what people need and their health-seeking        proposed methodology allows for a fuller picture of the volume
     behavior (ie, demand side). According to Eysenbach, analyses         and content of searches we are exploring through the
     of information supply and demand both require new methods            examination of top topics and queries, relative search volume
     to measure the epidemiology of information and to examine the        (RSV), top websites visited when searching for these top queries,
     relationships between information supply and/or demand and           and estimated volume of searches. The use of multiple APIs
     population health [33].                                              also provides multiple methods to estimate key values, ensuring
                                                                          the data obtained are accurate and reliable.
     Although Google Trends is an easily accessible tool for
     analyzing large population search queries, there is no consensus
     on how to retrieve, organize, and code queries. Researchers
     have applied inconsistent methodologies when using this tool
     and interpreting search data, which sometimes has led to
     https://www.researchprotocols.org/2020/7/e16543                                                 JMIR Res Protoc 2020 | vol. 9 | iss. 7 | e16543 | p. 2
                                                                                                               (page number not for citation purposes)
XSL• FO
RenderX
JMIR RESEARCH PROTOCOLS Zepecki et al
period of interest. This list of top sites is for the entire country.
Methods Evidence shows that the selection, sorting, and ranking criteria
Overview of search engines influence online health-information seeking
[37]. Custom Search data allow for analysis of content and
We obtain key pieces of Google search data by using three quality of information that people get online. Thus, while the
Google APIs. Google Trends provides the top search topics and Google Trends website can determine what information people
top search queries given an initial search term for a specified search for, it cannot determine what information they find.
time period and location. Google Health Trends generates the Hence, working with the three APIs enables a more
RSV for a list of top queries in a specific region and time period. comprehensive analysis than could be completed by using only
Finally, Google Custom Search provides the list of top websites the Google Trends website.
that people who search using a given initial search term are
shown when using the Google search engine. Custom Search We developed a simulation protocol that consisted of four steps:
gives results at the time of accessing the API, and these results identifying a list of search queries for the topics of interest,
can be specified at the national level. obtaining RSV, determining top sites for top search queries,
and calculating estimated total search volume. We describe
The Google Health Trends API, previously known as Google these fully in Tables 1-5. We tested the protocol to examine the
Flu Trends, gives normalized RSV across a set of search queries, top queries for birth control in the United States in 2017 and
allowing for more in-depth analysis of the relationships between created visualizations for each step. We used Python, version
queries. This RSV refers to the proportion of searches for a 2.7.13 (Python Software Foundation), for all of the API calls.
specific query as compared to the sum total of searches for a Examples of the Python commands used are shown in Figures
set of queries, and thus differs from the relative search index MA2-1 to MA2-7 in Multimedia Appendix 2. Multimedia
given by Google Trends, which gives search interest relative to Appendix 3 contains the documentation of the Python package
all searches during the specified period of time. Although this Graphviz [38] and the APIs used.
proprietary tool is not available via the Google Trends website,
it offers benefits to the researcher by providing a clearly defined Step 1: Developing a List of Search Queries
metric to understand and interpret RSV. In the first step, we used the getTopQueries function to get the
We show that the RSV provided by Google Health Trends can queries most associated with the initial topic of interest during
be combined with another trusted data source to estimate total a researcher-specified time period in a researcher-specified
search volume. RSV can also inform estimates of proportions geographic region. The getTopQueries function can also gather
of searches to a given site. To gather information on the top the queries most associated with the previously obtained top
websites displayed on the Google search engine for a specific queries, referred to as follow-up queries. Top queries are
search term or topic of interest, we can access data through the displayed in a graph that illustrates the relationship between
Custom Search API. Because Custom Search gives results at queries. More details of the step-by-step procedures carried out
the time of API access, researchers should plan accordingly and are shown in Table 1. Figures 1 and 2 show intermediary Steps
prepare to take regular samples of top sites during the time 1.3 and 1.5 of the protocol.
https://www.researchprotocols.org/2020/7/e16543 JMIR Res Protoc 2020 | vol. 9 | iss. 7 | e16543 | p. 3
(page number not for citation purposes)
XSL• FO
RenderXJMIR RESEARCH PROTOCOLS Zepecki et al
Table 1. Developing a list of top search queries.
Step Description
1.1 Begin with a list of regions to explore and a single, broad, initial search term, such as birth control.
1.2 For each region, make a request to Google Trends’ getTopTopics function to obtain the most searched-for topics for a specific initial search
term. The function will return a list of topics that term is most closely related to as well as a value from 0 to 100 that denotes how strongly
linked the topic is to the initial term: 100 is the most closely associated and 0 is the least. This list of top topics serves only to validate the
top queries by examining similarities between the top topics and top queries.
1.3 Next, make a call to Google Trends’ getTopQueries function to get a list of the search queries most related to the initial search term in Step
1.1 for a given region, such as the United States. Each response from the getTopQueries method contains a title, or query, and a value attribute,
which is a number from 0 to 100 and represents how related the query is to the provided initial search term in the United States: 100 is the
most associated and 0 is the least. The data are presented in the form of a JSON (JavaScript Object Notation)-encoded mapping (see Figure
MA2-1 in Multimedia Appendix 2), which can easily be converted into a graph via Python or exported to a CSV (Comma-Separated Values)
file. If there are other regions of interest (eg, US states), this step must be repeated for all other regions. Each region will have a final list
variable that stores all the top queries for that region. Once all final lists are generated for all regions of interest, they will be combined to
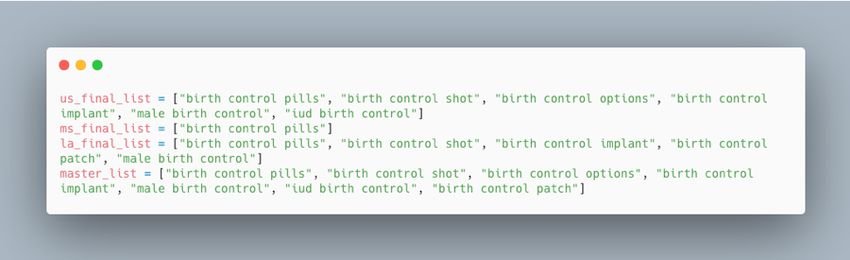
create a master list that includes the top queries for every region of interest (Figure 1 shows an example). Figure MA2-2 in Multimedia
Appendix 2 shows a snippet of the Python code.
1.4 For every query generated in Step 1.3, send a request to getTopQueries to obtain follow-up terms. Only queries with a value attribute greater
than or equal to 70, as this indicates a high level of correlation between the terms, is added to our follow-up queries list. Irrelevant searches
relating to pop culture should be manually filtered from results. Step 1.4 should be recursively executed—the follow-up queries become
the base set at each iteration—until no new queries can be added to the base set. During this step, how each query is related to each other
(ie, how a query ended up in our set of queries) should be recorded. This step is terminated when requests to getTopQueries do not return
unique queries that have not already been received in the simulation for this region.
1.5 Then, generate a graph using the Graphviz package for Python 2.7 [38] that illustrates how the search queries in the final list and the follow-
up queries list are related to one another. As shown in Figure 2, every node in the graph is a search query, and those in the first level will
be included in the final list of search queries for the simulation. If a node is encapsulated by a double circle, then this represents an overar-
ching topic coded for internal organizational purposes within the Google application programming interface (API) and is not included in
the final list or follow-up queries. Every direct edge (arrow) in the graph represents a relationship between two search queries (nodes) in
the graph. Note that with the current cutoff value of 70 in Step 1.4, there may be other intermediate terms in the graph not captured. Figure
MA2-3 in Multimedia Appendix 2 shows the Python function used.
Figure 1. Creation of a master list as visualized in Python for birth control in the United States, Mississippi, and Louisiana in 2017.
https://www.researchprotocols.org/2020/7/e16543 JMIR Res Protoc 2020 | vol. 9 | iss. 7 | e16543 | p. 4
(page number not for citation purposes)
XSL• FO
RenderXJMIR RESEARCH PROTOCOLS Zepecki et al
Figure 2. Top queries for birth control in the United States in 2017. Single circles in the graph represent search queries, whereas a double circle indicates
an overarching topic coded for internal organizational purposes within the Google application programming interface (API) and is not included in the
list of top queries. Numbers in parentheses indicate how relation of query to the provided initial search term. iud: intrauterine device.
relative: the API gives the relative frequency of a specific term
Step 2: Gathering Information on Search Volume as compared to the other terms in the master list for a specific
In the second step, the getTimelinesForHealth function in the region during a specified period of time. More step-by-step
Google Health Trends API gives the RSV for the top search details are shown in Table 2. Figure 3 illustrates the normalized
queries generated in the previous step. All values generated are RSV as described in the intermediary Step 2.3.
Table 2. Gathering information on search volume.
Step Description
2.1 For each region, for every term in the master list, send a request to the getTimelinesForHealth function from the Google Health Trends ap-
plication programming interface (API) to obtain relative search volume. Figure MA2-4 in Multimedia Appendix 2 shows an example of the
API call in Python.
2.2 The process in Step 2.1 should be repeated 30 times to minimize error. We take the average of the 30 samples of relative search volumes,
which represents the estimated search volume for a given term with the date and location restrictions provided. Figure MA2-5 in Multimedia
Appendix 2 shows a sample response of relative search volumes given by the getTimelinesForHealth function in the United States.
2.3 To compare across regions, normalize the values for each region by dividing each term’s value with the aggregate search volume for the
region. Before normalization, the value returned is skewed and does not take into account parameters such as geographical size differences.
The normalized value will range from 0 to 1. The total sum of all values of the set of queries is 1 after normalization. The value from 0 to
1 allows for understanding of the relative search frequency within search queries. These data can then be used to define search frequencies
for each term (see Figure 3). The normalization function used in this study is found in Figure MA2-6 in Multimedia Appendix 2.
https://www.researchprotocols.org/2020/7/e16543 JMIR Res Protoc 2020 | vol. 9 | iss. 7 | e16543 | p. 5
(page number not for citation purposes)
XSL• FO
RenderXJMIR RESEARCH PROTOCOLS Zepecki et al
Figure 3. Relative search volume for birth control in the United States in 2017. IUD: intrauterine device.
of someone clicking on the fourth and fifth sites are 0.08 and
Step 3: Determining the Most Popular Sites 0.07, respectively. The probabilities keep decreasing, such that
In the third step, we send a request to the Google Custom Search the probability of someone clicking on any site following the
API for each query in the master list to obtain a list of ranked ninth site is 0.01. The Chitika frequencies for site rankings, the
top websites as they appear on the Google search engine results Custom Search API rankings, and the RSV for the query can
(see Table 3). A study from Chitika [39] demonstrated that the be used to calculate the estimated proportion of site visits at the
first 10 sites in the search results receive about 95% of the traffic time of API access. The call to the Custom Search API is
or more, prompting us to only consider the first page of sites outlined in Figure MA2-7 in Multimedia Appendix 2. An
returned in the search results. According to the Chitika study, example of this step, involving the term birth control pills and
the probabilities of someone clicking on the first, second, and the top five sites visited [40-44], is illustrated in Table 4 in the
third sites are 0.35, 0.20, and 0.15, respectively; the probabilities Results section.
https://www.researchprotocols.org/2020/7/e16543 JMIR Res Protoc 2020 | vol. 9 | iss. 7 | e16543 | p. 6
(page number not for citation purposes)
XSL• FO
RenderXJMIR RESEARCH PROTOCOLS Zepecki et al
Table 3. Determining the most popular sites.
Step Description
3.1 Use the master list generated in Step 1: Developing a List of Search Queries and send a request to the Google Custom Search application
programming interface (API) for every term in the master list. This API returns a list of ranked top websites as they appear on the Google
search engine results.
3.2 Use the frequencies for site rankings, the Custom Search API rankings, and the relative search volume for the query to calculate the estimated
proportion of site visits. For example, as shown in Table 4, the top site for the term birth control pills in the United States is the birth control
pill webpage on the Planned Parenthood website [40]. The relative search volume for birth control pills in the United States in 2017 is 0.54,
and the probability of someone clicking on the first site returned on the Google search engine is 0.35. Thus, the estimated proportion of site
visits to Planned Parenthood is 0.19.
Table 4. Top five sites visited for birth control pill searches in the United States in August 2018.
Site ranking Website Webpage
1 Planned Parenthood [40] Birth control pill
2 WebMD [41] Birth control pills
3 Wikipedia [42] Combined oral contraceptive pill
4 BirthControl.com [43] Birth control pills
5 Healthline [44] Birth control pills: Are they right for you?
male birth control; and the intrauterine device (IUD). Queries
Step 4: Calculating Estimated Total Search Volume for the IUD were predominantly for the copper IUD.
Google does not provide total search volumes. We overcome
this limitation by using actual volume on searches to a concrete Step 2: Gathering Information on Search Volume
website as the baseline for calculating estimated total search We then use our findings in Step 1 to complete Step 2 of the
volume corresponding to the RSV for the top search queries protocol: determining the RSV of the top queries. Figure 3
obtained from the Health Trends API. We worked with Planned shows, for instance, that in the United States in 2017, the pill
Parenthood Federation of America (PPFA) to obtain the number (RSV=0.54) was searched for 4.5 times more than the implant
of searches that led to their website, as this is the most popular (RSV=0.12) and 5.4 times more than male birth control
website for reproductive health information that people access (RSV=0.04).
in the United States. PPFA works with Vector Media to collect
analytics on the number of visitors to their site. A search is
Step 3: Determining the Most Popular Sites
defined as a user typing in a query in a search engine and then We follow Step 3 of the protocol to obtain information on top
being directed to the search engine’s results [45]. All of the data sites. We chose one top query, birth control pills, as an example
on searches that we obtained are, thus, the result of a user to demonstrate; however, to gain a full picture of top sites
entering in a query regarding a particular initial search term in viewed, it is important to carry out this step for all top queries
the Google search engine, which then leads them to the Planned (see Table 4).
Parenthood website. Slightly different processes must be used
Step 4: Calculating the Estimated Total Search Volume
when the search query that directly relates to the site that the
search data comes from is not present in the list of top queries. We estimate that the total number of searches for birth control
Estimated total search volume should be presented as a range in 2017 fell within the following ranges for the United States:
that includes an upper bound determined by the lowest 17,171,784-19,747,552 searches. These values were calculated
association of the top queries obtained. This assumes that there using the formula outlined in Table 5. Planned Parenthood is
may be queries with lower associations that are not returned by not a top search query for the term birth control, but as we found
the API. We show an example in the Results section. out, it is a top search query for abortion. By obtaining the RSV
of birth control as compared to abortion, we were able to obtain
Results the estimated total search volume for birth control and then
applied the RSV weights to obtain estimated total search volume
Step 1: Developing a List of Search Queries for the top queries. Because the top queries do not account for
all queries searched for—evidenced by the association values
We follow Step 1 of our procedure to gain information on the
presented in Figure 3—we calculated an upper bound of 15%
top queries for birth control in the United States in 2017. As
that we include in our estimates. Figure 4 shows the estimated
shown in Figure 2, the most popular query was for birth control
total search volume for each of the top search queries for birth
pills, followed in order of popularity by the shot, often searched
control in the United States in 2017 based on the RSV weights
for by its medical term Depo Provera and its effects; the implant;
for the top birth control methods.
https://www.researchprotocols.org/2020/7/e16543 JMIR Res Protoc 2020 | vol. 9 | iss. 7 | e16543 | p. 7
(page number not for citation purposes)
XSL• FO
RenderXJMIR RESEARCH PROTOCOLS Zepecki et al
Table 5. Calculations for estimated total search volume for birth control in the United States.
Search item measure Value
Total number of searches for abortion from Planned Parenthood 12,393,960
RSVa for abortion 0.4192
RSV for birth control 0.5808
Estimated total number of searches overall 29,565,744b
Estimated total number of searches for birth control 17,171,784c
a
RSV: relative search volume.
b
0.4192 (RSV for abortion)x = 12,393,960 (total number of searches for abortion from Planned Parenthood); x = 29,565,744.
c
0.5808 (RSV for birth control) × 29,565,744 (estimated total number of searches overall) = 17,171,784.
Figure 4. Estimated total search volume (range) and relative search volume (within parentheses) for birth control in the United States in 2017. IUD:
intrauterine device.
interest. By following four distinct steps using three Google
Discussion APIs, we are able to identify top search queries and websites
Principal Findings as well as estimate relative and total search volume of queries
in real time or near-real time in specified locations and time
Google Trends has become a popular tool for analyzing search periods. The use of multiple APIs also provides multiple
traffic on health. It has been used by researchers to measure methods to obtain key values, ensuring the data obtained are
general web-based interest, examine policy-related issues, get accurate and reliable.
insights into health behavior, and to monitor and predict
health-related events [27,29]. However, it has been used Our methodology is robust insofar as it is well documented and
inconsistently due to a lack of consensus on how to document avoids inserting any personal bias into the process of
Google search engine queries in academic research. This leaves determining top search queries, since all top queries are given
room for methodological development. In this article, we show by the API. In addition, we are able to provide a novel solution
that Google Trends data, when retrieved from the Google Trends to the current limitation of Google data, which, for privacy
API, offers more versatile analytic capabilities than the data concerns, does not provide the absolute volume of searches.
from the Google Trends website and offers the benefit of Prior studies proposed an approach to calculating total estimated
incorporating other APIs to extend insight into search-traffic search volume [25], but this approach is no longer replicable
behavior. given the constant updates Google makes to its technologies.
The proposed protocol—empirically tested with birth control The thorough documentation provided to apply the proposed
as the key initial search term—is capable of addressing protocol will allow researchers to replicate the methods used
important questions about Google search traffic and search to further the understanding of population interest in health
issues. The protocol can be applied to compare state-level
https://www.researchprotocols.org/2020/7/e16543 JMIR Res Protoc 2020 | vol. 9 | iss. 7 | e16543 | p. 8
(page number not for citation purposes)
XSL• FO
RenderXJMIR RESEARCH PROTOCOLS Zepecki et al
searches to those at the national level and to explore changes reports on the top related and rising queries, as well as the top
in search traffic over time. It can easily be applied to other initial related and rising topics, but does not provide a list of all queries
search terms; in our own exploration, we found that in the searched for. Thus, although the list of top queries is a
United States, people who searched for family planning instead comprehensive list of the most popular queries that users search
of birth control were searching for traditional or natural family for, it does not include every single query searched for relating
planning methods based on fertility awareness. Additionally, to a particular initial search term. Similarly, the RSV is only
our protocol can be utilized at the zip code–based Nielsen relative to the other queries in our final list and does not include
Demographic Marketing Area (DMA) level, which is the other queries that were not a part of the list of top queries.
smallest geolocation level that Google reports on and is available Furthermore, we are not able to identify the number of unique
for each state. However, to protect user privacy, Google does users or their individual characteristics.
not report data below a certain unknown threshold, so data may
For most popular sites, we were unable to identify the key
be unavailable for some DMAs.
websites at the state level or request a specified time period. To
Google data can provide essential context to administrators, overcome this limitation, one could import another source of
health care professionals, and academics. Top queries show data, such as a Google Consumer Survey (GCS) run at the state
varying interest in health topics as well as products and services level. GCS is a tool that allows for online, customized market
by location, thus allowing health care providers to tailor services research and can be used to survey internet users about their
and information available at clinics and local practices to the preferred websites that they seek for specific queries [46]. The
questions people are asking. RSV provides context on how values obtained from these responses could additionally be used
search interest compares by location, thus allowing one to focus as anchor points for calculating total volume of searches.
on what resources are most desired or sought out. Top websites
Clearly, we require more studies to assess the value and validity
are crucial information for researchers, as they give a direct
of the proposed methodology. Temporal changes in the interface
picture of what searchers are finding when they seek
and capabilities of Google data pose challenges to the research
information. This data can provide insight as to why
community because researchers cannot build on nonspecific,
misinformation may spread or what organizations are having
nonreplicable, and discontinued methodologies. Hence, the
the greatest influence in sharing their beliefs, products, and
proposed methodology will necessarily evolve as Google
services with potential patients and/or consumers. Finally,
continues to make changes. In June 2019, Google made
estimated total search volume allows professionals to know the
additional changes to the Google Trends API that had an effect
amount of the population that may be seeking access to
on the getTopQueries function, resulting in a broader list of top
resources or information on the resources in question. More
queries than when our study data were retrieved. Future studies
broadly speaking, this data gives interested stakeholders
may integrate Google searches and other sources of online big
understanding of the changing health care landscape and
data with machine learning models to track health topics [47].
identifies key concerns of potential patients and clients. Trends
in search data over time may reveal the impact of administrative Conclusions
revisions and/or decisions made at the state or national level. The combination of Google APIs suggested in the proposed
Limitations methodological framework offers a novel approach to analysis
of Google health queries, expanding the tools available to gain
The results that our protocol can achieve must be tempered by
insight into health assessments.
the limitations of the data and the data sources. Google Trends
Acknowledgments
We wish to thank Prem Ramaswami, former Google employee, for his guidance and validation of the simulation protocol and
William Sumfest, who pioneered the initial simulation protocol. We also thank the William and Flora Packard Foundation for
their financial support of the case study and other members of the Wallace Center that contributed to the development and testing
of the protocol.
Conflicts of Interest
None declared.
Multimedia Appendix 1
Google Trends website and Google Trends application programming interface (API) comparison.
[DOCX File , 845 KB-Multimedia Appendix 1]
Multimedia Appendix 2
Python code appendix.
[DOCX File , 1764 KB-Multimedia Appendix 2]
https://www.researchprotocols.org/2020/7/e16543 JMIR Res Protoc 2020 | vol. 9 | iss. 7 | e16543 | p. 9
(page number not for citation purposes)
XSL• FO
RenderXJMIR RESEARCH PROTOCOLS Zepecki et al
Multimedia Appendix 3
Details of packages used within code and documentation for application programming interfaces (APIs).
[DOCX File , 13 KB-Multimedia Appendix 3]
References
1. Purcell K, Brenner J, Rainie L. Search Engine Use 2012. Washington, DC: Pew Internet & American Life Project; 2012
Mar 09. URL: https://www.pewinternet.org/wp-content/uploads/sites/9/media/Files/Reports/2012/
PIP_Search_Engine_Use_2012.pdf [accessed 2019-08-15]
2. Stephens-Davidowitz S. Everybody Lies: Big Data, New Data, and What the Internet Can Tell Us About Who We Really
Are. New York, NY: HarperCollins Publishers; 2017.
3. Google Trends. URL: https://trends.google.com/trends/ [accessed 2020-01-27]
4. Ginsberg J, Mohebbi MH, Patel RS, Brammer L, Smolinski MS, Brilliant L. Detecting influenza epidemics using search
engine query data. Nature 2009 Feb 19;457(7232):1012-1014. [doi: 10.1038/nature07634] [Medline: 19020500]
5. Klembczyk JJ, Jalalpour M, Levin S, Washington RE, Pines JM, Rothman RE, et al. Google Flu Trends spatial variability
validated against emergency department influenza-related visits. J Med Internet Res 2016 Jun 28;18(6):e175 [FREE Full
text] [doi: 10.2196/jmir.5585] [Medline: 27354313]
6. Kandula S, Hsu D, Shaman J. Subregional nowcasts of seasonal influenza using search trends. J Med Internet Res 2017
Nov 06;19(11):e370 [FREE Full text] [doi: 10.2196/jmir.7486] [Medline: 29109069]
7. Gianfredi V, Bragazzi N, Mahamid M, Bisharat B, Mahroum N, Amital H, et al. Monitoring public interest toward pertussis
outbreaks: An extensive Google Trends-based analysis. Public Health 2018 Dec;165:9-15. [doi: 10.1016/j.puhe.2018.09.001]
[Medline: 30342281]
8. Mavragani A, Sampri A, Sypsa K, Tsagarakis KP. Integrating smart health in the US health care system: Infodemiology
study of asthma monitoring in the Google era. JMIR Public Health Surveill 2018 Mar 12;4(1):e24 [FREE Full text] [doi:
10.2196/publichealth.8726] [Medline: 29530839]
9. Phillips CA, Barz Leahy A, Li Y, Schapira MM, Bailey LC, Merchant RM. Relationship between state-level Google online
search volume and cancer incidence in the United States: Retrospective study. J Med Internet Res 2018 Jan 08;20(1):e6
[FREE Full text] [doi: 10.2196/jmir.8870] [Medline: 29311051]
10. Xu C, Wang Y, Yang H, Hou J, Sun L, Zhang X, et al. Association between cancer incidence and mortality in web-based
data in China: Infodemiology study. J Med Internet Res 2019 Jan 29;21(1):e10677 [FREE Full text] [doi: 10.2196/10677]
[Medline: 30694203]
11. Mukhija D, Venkatraman A, Nagpal SJ. Effectivity of awareness months in increasing internet search activity for top
malignancies among women. JMIR Public Health Surveill 2017 Aug 21;3(3):e55 [FREE Full text] [doi:
10.2196/publichealth.7714] [Medline: 28827213]
12. Vasconcellos-Silva PR, Carvalho DB, Trajano V, de La Rocque LR, Sawada AC, Juvanhol LL. Using Google Trends data
to study public interest in breast cancer screening in Brazil: Why not a pink February? JMIR Public Health Surveill 2017
Apr 06;3(2):e17 [FREE Full text] [doi: 10.2196/publichealth.7015] [Medline: 28385679]
13. Arora V, Stuckler D, McKee M. Tracking search engine queries for suicide in the United Kingdom, 2004-2013. Public
Health 2016 Aug;137:147-153. [doi: 10.1016/j.puhe.2015.10.015] [Medline: 26976489]
14. Lee D, Lee H, Choi M. Examining the relationship between past orientation and US suicide rates: An analysis using big
data-driven Google search queries. J Med Internet Res 2016 Feb 11;18(2):e35 [FREE Full text] [doi: 10.2196/jmir.4981]
[Medline: 26868917]
15. Tana JC, Kettunen J, Eirola E, Paakkonen H. Diurnal variations of depression-related health information seeking: Case
study in Finland using Google Trends data. JMIR Ment Health 2018 May 23;5(2):e43 [FREE Full text] [doi:
10.2196/mental.9152] [Medline: 29792291]
16. Memon SA, Razak S, Weber I. Lifestyle disease surveillance using population search behavior: Feasibility study. J Med
Internet Res 2020 Jan 27;22(1):e13347 [FREE Full text] [doi: 10.2196/13347] [Medline: 32012050]
17. Rahiri J, Barazanchi A, Furukawa S, MacCormick AD, Harwood M, Hill AG. Using Google Trends to explore the New
Zealand public's interest in bariatric surgery. ANZ J Surg 2018 Dec;88(12):1274-1278. [doi: 10.1111/ans.14772] [Medline:
30173419]
18. Berlinberg EJ, Deiner MS, Porco TC, Acharya NR. Monitoring interest in herpes zoster vaccination: Analysis of Google
search data. JMIR Public Health Surveill 2018 May 02;4(2):e10180 [FREE Full text] [doi: 10.2196/10180] [Medline:
29720364]
19. Ssendikaddiwa J, Lavergne R. Access to primary care and internet searches for walk-in clinics and emergency departments
in Canada: Observational study using Google Trends and population health survey data. JMIR Public Health Surveill 2019
Nov 18;5(4):e13130 [FREE Full text] [doi: 10.2196/13130] [Medline: 31738175]
20. Wang H, Chen D. Economic recession and obesity-related internet search behavior in Taiwan: Analysis of Google Trends
data. JMIR Public Health Surveill 2018 Apr 06;4(2):e37 [FREE Full text] [doi: 10.2196/publichealth.7314] [Medline:
29625958]
https://www.researchprotocols.org/2020/7/e16543 JMIR Res Protoc 2020 | vol. 9 | iss. 7 | e16543 | p. 10
(page number not for citation purposes)
XSL• FO
RenderXJMIR RESEARCH PROTOCOLS Zepecki et al
21. Nobles AL, Dredze M, Ayers JW. "Repeal and replace": Increased demand for intrauterine devices following the 2016
presidential election. Contraception 2019 May;99(5):293-295. [doi: 10.1016/j.contraception.2018.10.012] [Medline:
30878137]
22. Wood LN, Jamnagerwalla J, Markowitz MA, Thum DJ, McCarty P, Medendorp AR, et al. Public awareness of uterine
power morcellation through US Food and Drug Administration communications: Analysis of Google Trends search term
patterns. JMIR Public Health Surveill 2018 Apr 26;4(2):e47 [FREE Full text] [doi: 10.2196/publichealth.9913] [Medline:
29699965]
23. Cartwright AF, Karunaratne M, Barr-Walker J, Johns NE, Upadhyay UD. Identifying national availability of abortion care
and distance from major US cities: Systematic online search. J Med Internet Res 2018 May 14;20(5):e186 [FREE Full text]
[doi: 10.2196/jmir.9717] [Medline: 29759954]
24. Reidpath DD, Allotey P. Predicting US state teenage birth rate using search engine query data on pregnancy termination
and prevention. J Glob Health Rep 2018 Mar 01;2:1-4 [FREE Full text] [doi: 10.29392//001c.11938]
25. Stephens-Davidowitz S. The New York Times. 2016 Mar 05. The return of the D.I.Y. abortion URL: https://www.
nytimes.com/2016/03/06/opinion/sunday/the-return-of-the-diy-abortion.html [accessed 2019-08-18]
26. Reis BY, Brownstein JS. Measuring the impact of health policies using internet search patterns: The case of abortion. BMC
Public Health 2010 Aug 25;10:514 [FREE Full text] [doi: 10.1186/1471-2458-10-514] [Medline: 20738850]
27. Arora V, McKee M, Stuckler D. Google Trends: Opportunities and limitations in health and health policy research. Health
Policy 2019 Mar;123(3):338-341. [doi: 10.1016/j.healthpol.2019.01.001] [Medline: 30660346]
28. Foroughi F, Lam AK, Lim MS, Saremi N, Ahmadvand A. "Googling" for Cancer: An infodemiological assessment of
online search interests in Australia, Canada, New Zealand, the United Kingdom, and the United States. JMIR Cancer 2016
May 04;2(1):e5 [FREE Full text] [doi: 10.2196/cancer.5212] [Medline: 28410185]
29. Mavragani A, Ochoa G. Forecasting AIDS prevalence in the United States using online search traffic data. J Big Data 2018
May 19;5(17):1-21 [FREE Full text] [doi: 10.1186/s40537-018-0126-7]
30. Parker J, Cuthbertson C, Loveridge S, Skidmore M, Dyar W. Forecasting state-level premature deaths from alcohol, drugs,
and suicides using Google Trends data. J Affect Disord 2017 Apr 15;213:9-15. [doi: 10.1016/j.jad.2016.10.038] [Medline:
28171770]
31. Young SD, Torrone EA, Urata J, Aral SO. Using search engine data as a tool to predict syphilis. Epidemiology
2018;29(4):574-578. [doi: 10.1097/ede.0000000000000836]
32. Eysenbach G. Infodemiology and infoveillance tracking online health information and cyberbehavior for public health.
Am J Prev Med 2011 May;40(5 Suppl 2):S154-S158. [doi: 10.1016/j.amepre.2011.02.006] [Medline: 21521589]
33. Eysenbach G. Infodemiology and infoveillance: Framework for an emerging set of public health informatics methods to
analyze search, communication and publication behavior on the internet. J Med Internet Res 2009 Mar 27;11(1):e11 [FREE
Full text] [doi: 10.2196/jmir.1157] [Medline: 19329408]
34. Nuti SV, Wayda B, Ranasinghe I, Wang S, Dreyer RP, Chen SI, et al. The use of Google Trends in health care research:
A systematic review. PLoS One 2014;9(10):e109583 [FREE Full text] [doi: 10.1371/journal.pone.0109583] [Medline:
25337815]
35. Mavragani A, Ochoa G. Google Trends in infodemiology and infoveillance: Methodology framework. JMIR Public Health
Surveill 2019 May 29;5(2):e13439 [FREE Full text] [doi: 10.2196/13439] [Medline: 31144671]
36. Public Policy Office, Guttmacher Institute. Guttmacher Institute. Washington, DC: Guttmacher Institute; 2020 May 01.
Insurance coverage of contraceptives URL: https://www.guttmacher.org/state-policy/explore/
insurance-coverage-contraceptives [accessed 2019-08-17]
37. Allam A, Schulz PJ, Nakamoto K. The impact of search engine selection and sorting criteria on vaccination beliefs and
attitudes: Two experiments manipulating Google output. J Med Internet Res 2014 Apr 02;16(4):e100 [FREE Full text]
[doi: 10.2196/jmir.2642] [Medline: 24694866]
38. Python Package Index (PyPI). Simple Python interface for Graphviz: Project description URL: https://pypi.org/project/
graphviz/ [accessed 2019-08-17]
39. Donnini G. Search Engine Journal. 2013 Jul 22. The value of Google result positioning URL: https://www.
searchenginejournal.com/the-value-of-google-result-positioning/65176/ [accessed 2019-08-17]
40. Planned Parenthood. Birth control pill URL: https://www.plannedparenthood.org/learn/birth-control/birth-control-pill
[accessed 2020-05-12]
41. WebMD. Birth control pills URL: https://www.webmd.com/sex/birth-control/birth-control-pills#1 [accessed 2020-05-12]
42. Wikipedia. Combined oral contraceptive pill URL: https://en.wikipedia.org/wiki/Combined_oral_contraceptive_pill [accessed
2020-05-12]
43. BirthControl.com. Birth control pills URL: https://birthcontrol.com/options/birth-control-pills/ [accessed 2020-05-12]
44. Healthline. Birth control pills: Are they right for you? URL: https://www.healthline.com/health/birth-control-pills [accessed
2020-05-12]
45. Google Analytics Help. 2019. How a web session is defined in Analytics URL: https://support.google.com/analytics/answer/
2731565?hl=en [accessed 2019-08-17]
https://www.researchprotocols.org/2020/7/e16543 JMIR Res Protoc 2020 | vol. 9 | iss. 7 | e16543 | p. 11
(page number not for citation purposes)
XSL• FO
RenderXJMIR RESEARCH PROTOCOLS Zepecki et al
46. Google Surveys Help. 2019. How it works URL: https://support.google.com/surveys/topic/
6194669?hl=en&ref_topic=7156628 [accessed 2019-08-17]
47. Sadilek A, Caty S, DiPrete L, Mansour R, Schenk T, Bergtholdt M, et al. Machine-learned epidemiology: Real-time detection
of foodborne illness at scale. NPJ Digit Med 2018 Nov;1:36 [FREE Full text] [doi: 10.1038/s41746-018-0045-1] [Medline:
31304318]
Abbreviations
API: application programming interface
CSV: Comma-Separated Values
DMA: Demographic Marketing Area
GCS: Google Consumer Survey
IUD: intrauterine device
JSON: JavaScript Object Notation
PPFA: Planned Parenthood Federation of America
RSV: relative search volume
Edited by G Eysenbach; submitted 08.10.19; peer-reviewed by A Mavragani, S Kardes; comments to author 11.11.19; revised version
received 04.02.20; accepted 24.03.20; published 06.07.20
Please cite as:
Zepecki A, Guendelman S, DeNero J, Prata N
Using Application Programming Interfaces to Access Google Data for Health Research: Protocol for a Methodological Framework
JMIR Res Protoc 2020;9(7):e16543
URL: https://www.researchprotocols.org/2020/7/e16543
doi: 10.2196/16543
PMID:
©Anne Zepecki, Sylvia Guendelman, John DeNero, Ndola Prata. Originally published in JMIR Research Protocols
(http://www.researchprotocols.org), 06.07.2020. This is an open-access article distributed under the terms of the Creative Commons
Attribution License (https://creativecommons.org/licenses/by/4.0/), which permits unrestricted use, distribution, and reproduction
in any medium, provided the original work, first published in JMIR Research Protocols, is properly cited. The complete bibliographic
information, a link to the original publication on http://www.researchprotocols.org, as well as this copyright and license information
must be included.
https://www.researchprotocols.org/2020/7/e16543 JMIR Res Protoc 2020 | vol. 9 | iss. 7 | e16543 | p. 12
(page number not for citation purposes)
XSL• FO
RenderXYou can also read