Quest for Sustainability: Life-Cycle Emissions Assessment of Electric Vehicles Considering Newer Li-Ion Batteries - MDPI
←
→
Page content transcription
If your browser does not render page correctly, please read the page content below
sustainability

Article
Quest for Sustainability: Life-Cycle Emissions
Assessment of Electric Vehicles Considering
Newer Li-Ion Batteries
Arminda Almeida 1,2 , Nuno Sousa 3,4                    and João Coutinho-Rodrigues 1,4, *
 1    Department of Civil Engineering, Faculty of Science and Technology, University of Coimbra,
      3030-788 Coimbra, Portugal; arminda@dec.uc.pt
 2    CITTA—Research Centre for Territory, Transports and Environment, 4200-465 Oporto, Portugal
 3    Department of Sciences and Technology, Universidade Aberta, 1269-001 Lisbon, Portugal; nsousa@uab.pt
 4    INESCC—Institute for Systems Engineering and Computers at Coimbra, 3030-290 Coimbra, Portugal
 *    Correspondence: coutinho@dec.uc.pt

 Received: 25 March 2019; Accepted: 16 April 2019; Published: 20 April 2019

 Abstract: The number of battery electric vehicle models available in the market has been increasing,
 as well as their battery capacity, and these trends are likely to continue in the future as sustainable
 transportation goals rise in importance, supported by advances in battery chemistry and technology.
 Given the rapid pace of these advances, the impact of new chemistries, e.g., lithium-manganese rich
 cathode materials and silicon/graphite anodes, has not yet been thoroughly considered in the literature.
 This research estimates life cycle greenhouse gas and other air pollutants emissions of battery electric
 vehicles with different battery chemistries, including the above advances. The analysis methodology,
 which uses the greenhouse gases, regulated emissions, and energy use in transportation (GREET)
 life-cycle assessment model, considers 8 battery types, 13 electricity generation mixes with different
 predominant primary energy sources, and 4 vehicle segments (small, medium, large, and sport utility
 vehicles), represented by prototype vehicles, with both battery replacement and non-replacement
 during the life cycle. Outputs are expressed as emissions ratios to the equivalent petrol internal
 combustion engine vehicle and two-way analysis of variance is used to test results for statistical
 significance. Results show that newer Li-ion battery technology can yield significant improvements
 over older battery chemistries, which can be as high as 60% emissions reduction, depending on
 pollutant type and electricity generation mix.

 Keywords: life-cycle assessment; electric vehicles; Li-ion battery chemistries; electricity mix;
 greenhouse gas; air pollutants

1. Introduction
     Economic growth and transport demand of the last decades have increased greenhouse gas
(GHG) emissions, overall. Currently, road transport represents a total of 72%–77% emissions of the
transport sector [1,2]. As passenger car registrations grow in the aftermath of the 2008 economic crisis
(3.1% in 2017, as compared to 2016 [3]), cleaner technologies, such as battery electric vehicles (BEV),
are a possible way to reduce the environmental impact of private transport [4]. The percentage of
BEV sales has been increasing in the EU-15 countries of the ACEA (2018) study [3], representing 1.5%
of sales as of 2017 (54% higher than 2016), surpassing the 3 million vehicles mark [2]. Worldwide
scenarios are more optimistic, as growing BEV and hybrid plug-in global market shares show [5].
Long-term planning scenarios aim towards global vehicle fleets to be almost entirely made up of
electric vehicles by 2050 [6]. Following this trend, several countries have committed to sustainable

Sustainability 2019, 11, 2366; doi:10.3390/su11082366                            www.mdpi.com/journal/sustainability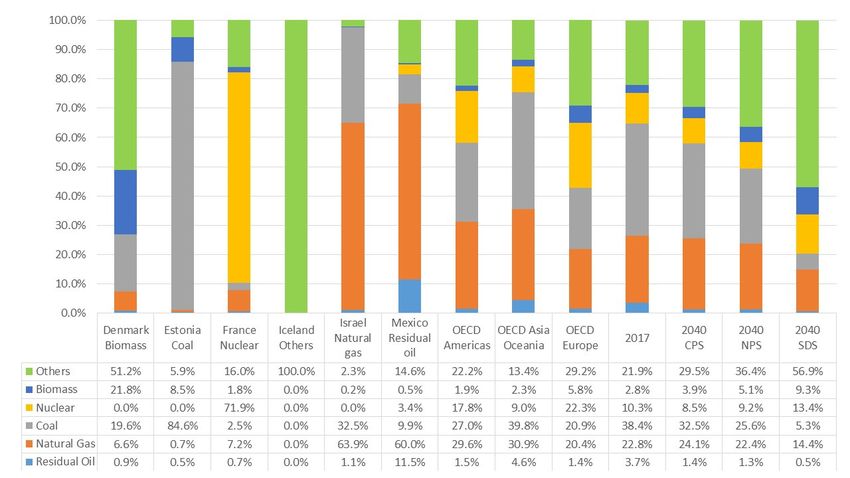
Sustainability 2019, 11, 2366                                                                         2 of 19

transportation goals by announcing plans to phase out internal combustion engines vehicle (ICEV)
circulation in the mid-term [7].
      Current BEV are almost exclusively equipped with Li-ion batteries (LIB) and this is expected to
remain the technology of choice for the next decade [8,9]. Other technologies have been under study,
such as lithium-sulfur and solid-state batteries [10–12]. However, market penetration forecasts of such
technologies as of 2030 are 4% and 2%, respectively, rising only to 8% and 12% in 2035 in the forecast of
Laslau [13].
      Most LIB share a similar design consisting of a graphite anode, a cathode formed by a lithium
metal oxide, and an electrolyte consisting of a solution of a lithium salt in a mixed organic solvent
imbedded in a separator felt (see e.g., Reference [14]). LIB manufacturers have been under pressure
to produce higher energy density battery packs, leading to LIB technology constantly evolving from
the current battery types to more advanced ones, mainly consisting of high-voltage cathodes and
high-performance anode materials and different designs [15]. As LIB technology evolves, it is important
to understand what the environmental impacts are of mass-producing the corresponding battery packs
and incorporating them in BEV, as it is by no means clear whether these new technologies actually
represent an improvement on the status-quo.
      Life-cycle assessment (LCA) is a broad methodology that can be used to account for the
environmental impacts of a vehicle throughout its life. LCA includes the vehicle cycle (raw material
acquisition, vehicle production, end-of-life treatment, recycling, and final disposal, i.e., cradle-to-grave)
and the fuel cycle (fuel production and distribution, and vehicle operation). A standardized LCA
methodology is defined in the ISO 14040 (2006) norm [16].
      Narrowing down to private vehicles, the greenhouse gases, regulated emissions, and energy use
in transportation (GREET) model is a methodology developed by the Argonne National Laboratory
which is often used for LCA analyses [17–19]. Despite being calibrated mostly for the USA context,
it is widely used in other regions as well. The GREET 2018 model includes LIB chemistry advances
and caters for different material compositions of LIB for transport applications and the state-of-the-art
of industrial production of LIB cathode materials [20]. It yields, as output, LCA emission estimates per
vehicle lifetime or km traveled.
      GREET provides GHG equivalent emissions, with carbon dioxide (CO2 ), nitrous oxide (N2 O),
and methane (CH4 ) emissions transformed into a CO2 -equivalent global warming potential (GWP)
(100-year time horizon GWP factors of the fifth assessment report were considered [21]), and other
air pollutants, such as carbon monoxide (CO), nitrogen oxides (NOx), sulfur oxides (SOx), volatile
organic compounds (VOC), particulate matter with diameters of 10 micrometers or less (PM10), and
particulate matter with diameters of 2.5 micrometers or less (PM2.5). The GREET 2018 model updated
vehicle emission factors from the EPA’s motor vehicle emission simulator version 2014a [20].
      Studies concerning life cycle aspects of BEV exist in the literature. Nordelöf et al. [22] carried out
a review article of contributions from 1998 to early 2013, following the review of Hawkins et al. [23].
Then, de Souza et al. [24] analyzed LCA studies from 2012 to 2018. They concluded that results depend
on both the researchers’ purposes and approaches used.
      Some articles focus on a regional context, such as in Brazil [24], China [19,25,26], UK [27], Poland
and the Czech Republic [28], and South Korea [29], highlighting the role of electricity generation mix,
which has been appointed as a determinant in emission estimations [22,29–31]. The potential reduction
in emission cost and human health, resulting from charging BEV through solar charging stations, can
be up to 45% and 35%, respectively [32]. Another important aspect is vehicle segment; usually, heavier
vehicles cause higher emissions [22,31,33]. Woo, Choi, and Ahn [31] considered four representative
vehicle categories: Subcompact, compact, full-size luxury, and sport utility vehicles (SUV). Karaaslan,
Zhao, and Tatari [33], in turn, considered only SUV with different fuel options. The well-to-wheel
analysis carried out by Woo, Choi, and Ahn [31], considering 70 mixes and 4 vehicle categories, shows
that the mix can increase the GHG emissions up to 121%, whatever the vehicle category, and that GHG
emissions tend to increase with vehicle size.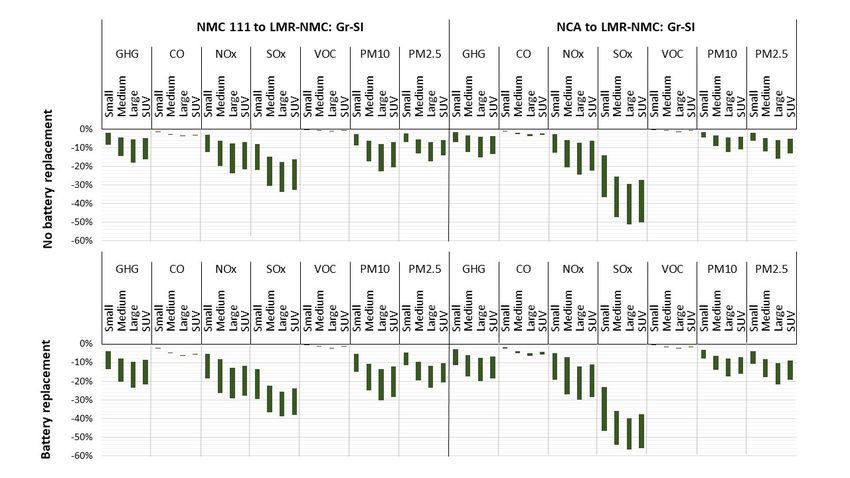
Sustainability 2019, 11, 2366                                                                      3 of 19

      Ambrose and Kendall [34] pointed out battery chemistry as also being an important factor in
emission estimations. They simulated life-cycle emissions for five commercial lithium chemistries
(NCA, NMC, LMO, LFP, and LMO/LTO), concluding that GHG emissions from battery production vary
in the range 197–494 kgCO2 e/kwh. Hao [35] carried out LCA analyses to study GHG emissions from
the production of three lithium chemistries (LFP, NMC, and LMO) in China, finding GHG emissions
differences in the order of 30%.
      Despite the many studies which have been conducted, they are not easily comparable, as the
results depends on key assumptions, such as the vehicles, the electricity mix, the analysis boundaries,
the functional unit, and the approaches and methods used. To overcome this, Peters and Weil [36]
developed a common base for LCA of LIB production with different oxides (LFP, LTO, LMO, NMC,
and NCA) and applied it in their review. They found significant differences regarding key assumptions.
In some situations, the higher differences between studies was due to different assumptions, and less
attributable to the particular battery chemistry.
      The majority of the LCA have mainly been focused on GHG emissions, notwithstanding the
impact of other air pollutants on the environment and human health [37–39].
      Delivering on the need to ascertain the impact of new LIB technology, the present research uses the
GREET 2018 model to conduct an LCA of the environmental impact of BEV of different segments and
LIB chemistries, in terms of GHG and six other types of air pollutant emissions, in a per km traveled
basis, considering several energy mixes. This research is innovative as it evaluates and statistically
compares emission estimates caused by BEV with several LIB chemistries (eight in total), including
future ones, using the same LCA assumptions. In addition, it considers present and future possible
electricity generation mixes, taking into account not only the carbon intensity but also the primary
energy source. It considers four vehicle segments, represented by prototype models, as well as both
one battery replacement and no battery replacement during the vehicle lifetime.
      The present study is an addition to the state-of-the-art because it presents a thorough life-cycle
assessment of vehicle environmental impact assuming new LIB technologies, focusing on multiple
pollutants, not just GHG, and presenting sizeable statistical results. In addition, this study considers
energy generation mixes with different main energy sources which, as will be seen, can influence
results considerably.

2. LCA Data and Methodology
     The GREET 2018 model was used to derive LCA emissions estimates for multiple pollutants.
This model distinguishes between regular and SUV-type vehicles, BEV, and ICEV vehicles, including
the most recent LIB technologies, and allows the user to choose the electricity mix composition. For the
purpose of this study, it requires, as input, vehicle weight, type, and powertrain; LIB chemistry
(when applicable); and a breakdown of the electricity mix. This study was carried out for 8 LIB
chemistries, 4 passenger vehicle segments (including large SUV), and 13 electricity mixes. In addition,
scenarios of one battery replacement and no battery replacement during the vehicle lifetime were
considered and emissions estimations were compared to the equivalent petrol-ICEV, also derived from
the GREET model. A total of 884 analyses was thus carried out. GREET model input variables other
than the ones explicitly mentioned below were kept at their baseline (default) values, as changing these
values had only very minor effects on the results. Information on data acquisition is now given.

2.1. Vehicle Characterization
      To take into account different passenger car segments, data needed for GREET model concerning
vehicle weight, battery capacity, and vehicle energy consumption were collected and average values
were derived, resulting in a prototype vehicle for each segment. Vehicle weight was used to define
its segment (except for SUV), as this is currently the only way to incorporate segmentation in the
GREET model. Segments considered were small city cars (EU A-B segment), medium-sized family cars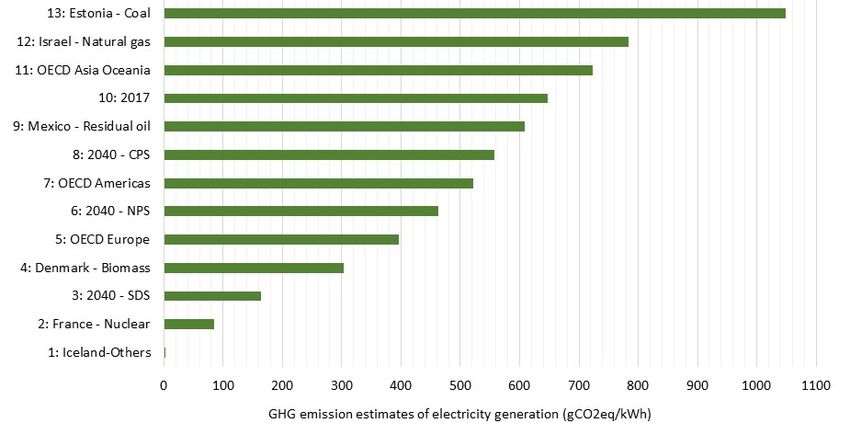
Sustainability 2019, 11, 2366                                                                                       4 of 19

(EU C-D segment), large full-size cars (EU E-F segment), and large SUV (EU J segment, large vehicles;
currently the only electric SUV available in the market).
     Vehicle weight, battery capacity, and energy consumption data were collected from brands’
technical specifications at the end of 2018 and used to construct an average model for each segment.
All BEV vehicles in the electric vehicle database were considered [40], for a total of 23 examined models.
Regarding the equivalent ICEV, whose environmental impact was also calculated for methodological
reasons (see Section 2.4), petrol-fueled cars were considered, as they are the most-sold ICEV type in the
EU-15 [3], and GREET conventional gasoline was assumed. A prototype average ICEV was considered
for each segment, over a representative sample.
     Concerning vehicle energy consumption, values from the worldwide harmonized light-duty
vehicles test procedure (WLTP) procedure for consumption and emissions tests are desirable [41].
However, given that WLTP data were not available for all the examined vehicles, new European
driving cycle (NEDC) data were used instead, with values adjusted for WLTP using ratios suggested
in the literature, for both BEV and ICEV [42,43].
     Table 1 presents a round-up of the profile of the prototype vehicles obtained, per segment. Note
that the GREET model requires separating BEV curb weight from battery weight.

      Table 1. Data for greenhouse gases, regulated emissions, and energy use in transportation (GREET) model.

                            Curb Weight of       Battery
             Vehicle                                           Consumption         Curb Weight        Consumption
                             BEV (without        Capacity
            Segment                                            (kwh/100 km)        of ICEV (kg)        (L/100 km)
                             Battery) (kg)        (kwh)
              Small              950                18               12                1000                5.0
             Medium              1250               50               14                1500                6.0
              Large              1600               90               20                2000                7.5
              SUV                1900               90               22                2300                10.0

2.2. Batteries
      Table 2 presents the LIB types that can be assessed by the GREET 2018 life cycle model.

                                  Table 2. Types available in the GREET 2018 model.

        1: LMO                  Lithium Manganese Oxide coupled with a graphite anode material LiMn2 O4
        2: LFP                  Lithium iron phosphate oxide coupled with a graphite anode material LiFePO4
                                Lithium-Nickel Manganese Cobalt oxide coupled with a graphite anode material
        3: NMC111
                                LiNi0.33 Mn0.33 Co0.33 O2
                                Lithium-Nickel Manganese Cobalt oxide coupled with a graphite anode material
        4: NMC622
                                LiNi0.6 Mn0.2 Co0.2 O2
                                Lithium-Nickel Manganese Cobalt oxide coupled with a graphite anode material
        5: NMC811
                                LiNi0.8 Mn0.1 Co0.1 O2
                                Lithium Manganese Rich-Nickel Manganese Cobalt oxide coupled with a graphite
        6: LMR-NMC: Gr
                                anode material 0.5Li2 MnO3 .0.5Li-Ni0.44 Co0.25 Mn0.31 O2
                                Lithium Manganese Rich-Nickel Manganese Cobalt oxide coupled with a
        7: LMR-NMC: Gr-SI
                                graphite-silicon blend anode material 0.5Li2 MnO3 .0.5Li-Ni0.44 Co0.25 Mn0.31 O2
                                Lithium- Nickel Cobalt Aluminium oxide coupled with a graphite anode material
        8: NCA
                                LiNiCoAlO2

     The LMR-NMC battery, coupled with a graphite or graphite-silicon blend anode material, is of
particular relevance, given its potential as a future chemistry for automotive battery packs [44]. According
to Zubi et al. [45], overall, in 2030, the cathode market share is very likely to be NMC in first place with
a 35% market share, followed by LFP and NCA with a 40% combined market share. In relation to the
NMC oxide, the NMC111 is the current one, the NMC622 is being deployed, and the NMC811 is for the
next-generation LIB [8]. The NMC811 chemistry, in which battery manufacturers have a growing interest,
enables significant reductions in cobalt content compared with other NMC chemistries [8].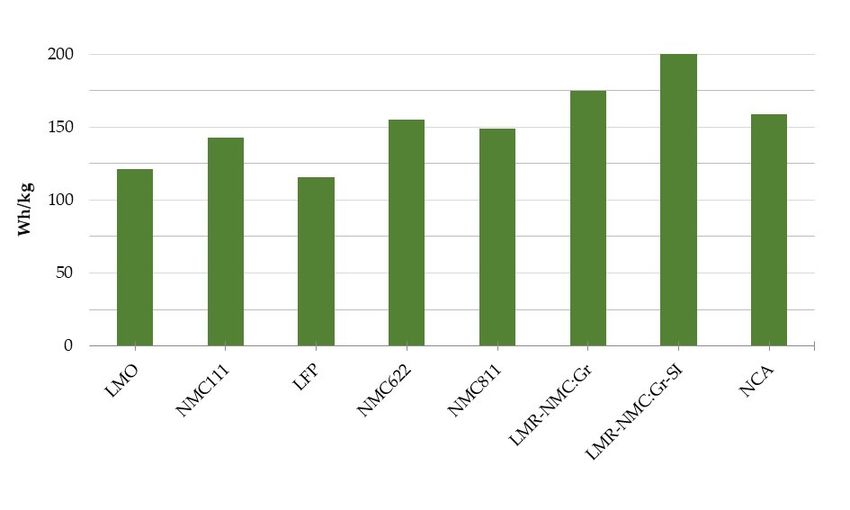
Sustainability 2019, 11, 2366 5 of 19
Table 3 provides a breakdown of the mass composition of each of these LIB chemistries for
comparison and Figure 1 presents their densities.
Sustainability 2019, 11, x FOR PEER REVIEW 5 of 20
Table 3. Mass composition (%).
Component LMO NMC111 Table 3.NMC622
LFP Mass composition
NMC811 (%). LMR-NMC: Gr LMR-NMC: Gr-SI NCA
Cathode active materialComponent
30.7 LMO
25.2 NMC111 23.8 LFP NMC622
23.1 NMC811
22.2 LMR-NMC:19.5 Gr LMR-NMC: Gr-SI 23.9
NCA 21.6
Wrought aluminum Cathode active material
22.7 30.7
23.9 25.223.1 23.8 23.1
24.6 22.2
24.5 19.5 22.4 23.9 25.021.6 24.9
Wrought aluminum 22.7 23.9 23.1 24.6 24.5 22.4 25.0 24.9
Graphite/Carbon Graphite/Carbon
12.7 15.7
12.7 15.7
13.8 13.8 16.516.5
15.9
15.9 20.2
20.2 5.6
5.617.1 17.1
Copper Copper11.6 11.7
11.6 11.710.4 10.4 11.8
11.8 11.5
11.5 14.8 14.8 19.8 19.812.1 12.1
Silicon 0.0
Silicon 0.0
0.0 0.0 0.0 0.0 0.0
0.0 0.0
0.0 0.0 0.0 1.7 1.70.0 0.0
Binder Binder2.3 2.2
2.3 2.2 2.0 2.0 2.1
2.1 2.5
2.5 2.1 2.1 2.0 2.02.0 2.0
Electrolyte Electrolyte
10.9 10.9
10.6 10.616.1 16.1 10.5
10.5 12.1
12.1 12.9 12.9 13.0 13.010.5 10.5
Plastic 1.66 1.67 1.50 1.67 1.64 3.8 4.5 1.7
Plastic 1.66 1.67 1.50 1.67 1.64 3.8 4.5 1.7
Steel 0.6 0.6 0.7 0.6 0.6 1.4 1.2 0.6
Steel 0.6
Thermal insulation 0.6
0.4 0.5 0.7 0.5 0.6
0.5 0.6
0.5 0.4 1.4 0.4 1.20.5 0.6
Thermal insulationCoolant (Glycol)
0.4 0.5
3.4 4.3 0.5 5.1 0.5
4.6 0.5
4.6 1.1 0.4 1.3 0.44.8 0.5
Coolant (Glycol) Electronic3.4parts 4.3
3.1 3.7 5.1 3.0 4.6
4.0 4.6
3.8 1.5 1.1 1.7 1.34.1 4.8
Electronic parts 3.1
Plastic = Polypropylene 3.7 + Polyethylene
3.0 + 4.0 3.8 Terephthalate;
Polyethylene 1.5 Electrolyte = Ethylene
1.7 4.1
Plastic = Polypropylene
Carbonate + + Dimethyl + Polyethylene
Carbonate
Polyethylene + LiPF6. Terephthalate; Electrolyte = Ethylene Carbonate + Dimethyl
Carbonate + LiPF6.
Figure 1. Battery energy density.
Figure 1. Battery energy density.
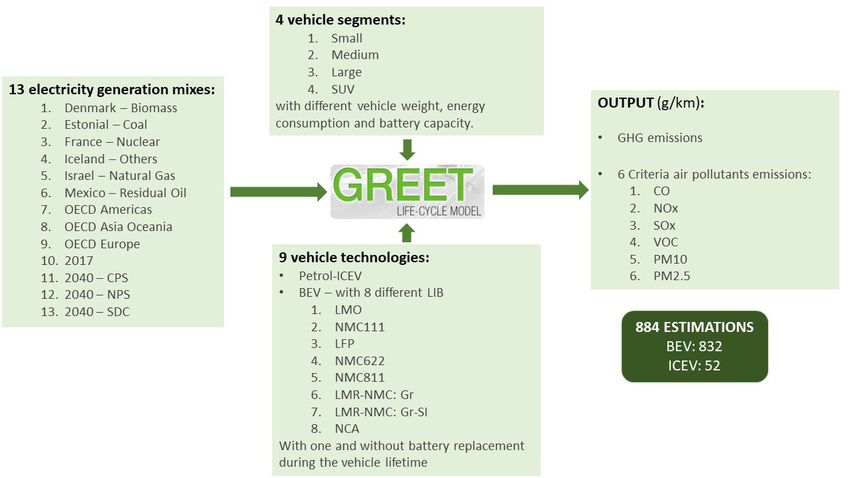
2.3. Electricity Generation Mix
2.3. Electricity Generation Mix
Concerning the electricity generation mix, provisional 2017 data available on the IEA electricity
information 2018 Concerning
[46] werethe electricity
used. This generation mix,considers
report provisional 2017
OECD datagross
available on the IEA production
electricity electricity from
information 2018 [46] were used. This report considers OECD gross electricity production from
combustible fuels (coal, oil, natural gas, biofuels, and waste), nuclear power, hydroelectric power,
combustible fuels (coal, oil, natural gas, biofuels, and waste), nuclear power, hydroelectric power,
geothermal,geothermal,
solar, wind, solar,ocean power,
wind, ocean andand
power, other
othersources for3535OECD
sources for OECD countries.
countries. The mixThe mix
data were data were
recategorized into GREET
recategorized modelmodel
into GREET primary energy
primary energysources—residual oil, natural
sources—residual oil, natural gas,
gas, coal, coal, nuclear,
nuclear,
biomass, andbiomass,
others and others (includes
(includes hydroelectric,
hydroelectric, geothermal, wind,
geothermal, wind,solar).
solar).
Out of the 35 electricity generation mixes available, only the most representative, i.e., highest
Out of the 35 electricity generation mixes available, only the most representative, i.e., highest
percentage, of a given energy source were considered in the analysis. In order to have a worldwide
percentage,perspective,
of a giventheenergy source were
OECD Americas, considered
Asia Oceania, in themixes
and Europe analysis. In order
were also to have
considered, a worldwide
as well as
perspective, theoutlook
three OECDscenarios
Americas, AsiabyOceania,
provided the Worldand EnergyEurope
Outlookmixes were also
[47], focusing considered,
on future higher as well
renewable
as three outlook percentages
scenarios mixes. The
provided bythree
thecore scenarios,
World Energy differentiated
Outlookprimarily by their underlying
[47], focusing on future higher
assumptions about the evolution of energy-related government policies, were defined in the report,
renewable percentages mixes. The three core scenarios, differentiated primarily by
namely the current policies scenario, which considers the impact of only those policies and measures
their underlying
assumptions thatabout theenshrined
are firmly evolution of energy-related
in legislation government
as of mid-2018; policies,
the new policies were
scenario, defined
aiming in the report,
at providing
namely theacurrent policies
sense of the scenario,
direction in whichwhich
the mostconsiders theambitions
recent policy impact could
of onlytakethose policies
the energy and
sector; andmeasures
the sustainable
that are firmly enshrineddevelopment
in legislation scenario, which startsthe
as of mid-2018; fromnewthe policies
objectivesscenario,
to be achieved
aiming andatthen
providing a
sense of the direction in which the most recent policy ambitions could take the energy sector; and the
sustainable development scenario, which starts from the objectives to be achieved and then assesses
what combination of actions would deliver them. This allows exploration of the impact of possible
future mixes. Figure 2 presents the GREET breakdown of the considered mixes, a total of 13.Sustainability 2019, 11, x FOR PEER REVIEW 6 of 20
assesses what2019,
Sustainability combination ofREVIEW
11, x FOR PEER actions would deliver them. This allows exploration of the6 impact
of 20 of
possible future mixes. Figure 2 presents the GREET breakdown of the considered mixes, a total of 13.
assesses
Sustainability what
2019, 11, combination
2366 of actions would deliver them. This allows exploration of the impact of 6 of 19
possible future mixes. Figure 2 presents the GREET breakdown of the considered mixes, a total of 13.
Figure
Figure
Figure 2. 2. Electricity
2. Electricity
Electricity generationmixes
generation
generation mixes considered
mixes considered
consideredinin
inthe
thelife-cycle
the assessment
life-cycle
life-cycle (LCA)
assessment
assessment analysis.
(LCA)
(LCA) analysis.
analysis.
Vehicle GHG
Vehicle emission estimates,in in gCO22eq/km traveled originating from electricity generation,
VehicleGHGGHGemission
emissionestimates,
estimates, in gCO
gCO2eq/kmeq/km traveled
traveled originating
originating from
from electricity generation,
electricity generation,
werewere carried
carried out out
in in the
the GREET
GREET model
model considering
considering only the
only fuel
the cycle,
fuel which
cycle, comprises
which all steps from
comprises all steps
wereprimary
carriedsource
out inextraction/production
the GREET model considering
to thetocharging
only the fuel cycle, awhich
station,station,
including
comprises
charging
allofsteps
efficiencyefficiency
85%
from
from primary
primary source extraction/production the charging including a charging of
[48–50]. These emissions are linearly proportional to the fuel consumption. Therefore, as different 85%
source extraction/production to the charging station, including a charging efficiency of
85% [48–50].
[48–50]. These These emissions
emissions are are linearly
linearly proportional
proportional to thefuel
fuelconsumption.
consumption.Therefore,
Therefore, as as different
different
vehicle segments were considered in the analysis, thetoestimations
the were obtained dividing by vehicle
vehicle
vehicle segments were
segments(kWh/km). considered
were considered in the analysis, the estimations were obtained dividing by
by vehicle
consumption Figure 3 in the analysis,
presents the GHG the estimations
emission were
estimates of obtained dividing
the electricity generation vehicle
consumption
part (fuel (kWh/km).
cycle) for all Figure
the mixes3 presents
considered the
in GHG
the emission
analysis, estimates
ordered by of the
decreasing
consumption (kWh/km). Figure 3 presents the GHG emission estimates of the electricity generation electricity
emissions. generation
part
part (fuel
(fuel cycle)
cycle)for
forall
allthe
themixes
mixesconsidered
consideredin
inthe
theanalysis,
analysis,ordered
orderedby
bydecreasing
decreasingemissions.
emissions.
Figure 3. Greenhouse gas (GHG) emission estimates of electricity generation for all the considered
mixes.
Note
Figure
Figure that the fuelgas
3. 3.Greenhouse
Greenhouse cycle
gas alsoemission
(GHG)
(GHG) produces
emission other pollutants
estimates
estimates besides
of electricity
of electricity GHG,for
and
generation
generation this
allfor isthe
theall accounted for
considered
considered mixes.
in the GREET model. mixes.
Note that the fuel cycle also produces other pollutants besides GHG, and this is accounted for in
2.4.
the GREET
NoteProcedure
model.
that andfuel
the Statistical
cycle Methods
also produces other pollutants besides GHG, and this is accounted for
in the GREET model.
2.4. Procedure and Statistical Methods
2.4. Procedure and Statistical
With key input Methods
data evaluated, the GREET 2018 life cycle model was used to obtain emissions estimates,
in grams per km, of seven pollutants as output. A total of 13 mixes × 8 LIB chemistries × 4 segments × 2
battery replacement options (yes/no) = 832 BEV estimations were carried out, plus 13 mixes × 4 segments
= 52 ICEV emissions estimations, for a grand total of 884 estimations. Note that the environmental impactSustainability 2019, 11, x FOR PEER REVIEW 7 of 20
With key input data evaluated, the GREET 2018 life cycle model was used to obtain emissions
Sustainability 2019, 11, 2366 7 of 19
estimates, in grams per km, of seven pollutants as output. A total of 13 mixes × 8 LIB chemistries × 4
segments × 2 battery replacement options (yes/no) = 832 BEV estimations were carried out, plus 13 mixes
of ICEV× 4also
segments
depends = 52
onICEV emissionsmix
the electricity estimations,
due to theforconstruction
a grand total andofdecommissioning
884 estimations. Note
phase,that the to a
albeit
environmental impact of ICEV also depends on the electricity mix due to the construction and
much lesser extent than BEV. It was assumed that the vehicle is produced, used, and dismantled under the
decommissioning phase, albeit to a much lesser extent than BEV. It was assumed that the vehicle is
electricity mix considered, as a closed system type of analysis was sought-after. More global analyses are
produced, used, and dismantled under the electricity mix considered, as a closed system type of analysis
possible,
wasbut that is outside
sought-after. More the scope
global of thisare
analyses article, since
possible, butitthat
would requirethe
is outside considering many
scope of this combinations
article, since it
of datasets, reaching out to the bottom of the supply chain of each vehicle component.
would require considering many combinations of datasets, reaching out to the bottom of the supplyFigure 4 presents
chain a
structure of the
of each inputs
vehicle and outputs
component. of4the
Figure model.
presents a structure of the inputs and outputs of the model.
Figure
Figure 4. Structure
4. Structure of the
of the inputsand
inputs andoutputs
outputs of
of the
theGREET
GREET2018
2018life cycle
life model.
cycle model.
Once Once all outputs
all outputs were obtained,
were obtained, their their respective
respective emission
emission estimates
estimates werewere subject
subject to a to a statistical
statistical analysis
to determine whether significant differences between the distributions of results could be detected.be
analysis to determine whether significant differences between the distributions of results could
detected.
In order to remove vehicle size bias from the analysis, the response variable considered in the
In order to remove vehicle size bias from the analysis, the response variable considered in the
statistical analysis was not the absolute value of the BEV emissions estimate but its quotient by the
statistical analysis was not the absolute value of the BEV emissions estimate but its quotient by the
emissions estimate
emissions of the
estimate ICEV
of the ICEVof of
thethesame
samesegment
segment (ratio-to-ICEV variable,
(ratio-to-ICEV variable, or or simply
simply ratioratio variable).
variable).
Considering absolute values instead would just yield the well-known fact that bigger
Considering absolute values instead would just yield the well-known fact that bigger vehicles pollute vehicles pollute
more,more,
and this unwanted effect would make it harder to find significant
and this unwanted effect would make it harder to find significant differences. differences.
The statistical analysis
The statistical was carried
analysis out by
was carried outperforming,
by performing,for each electricity
for each mix,mix,
electricity a two-way
a two-wayanalysis
analysis(ANOVA)
of variance of variancewithout
(ANOVA) without replication,
replication, with LIB with LIB chemistry
chemistry and and vehicle
vehicle segment
segment asasfactors
factors and
and emissions
emissions estimatesestimates (in ratio variables)
(in ratio variables) as the statistical
as the statistical variable.
variable. The ANOVAThe ANOVA test determines
test determines whether
the factors, as a whole, influence the emission estimates in a statistically significant way. Next,way.
whether the factors, as a whole, influence the emission estimates in a statistically significant in order
Next, in order to find out which particular levels of the factors, i.e., which chemistry types or segment
to find out which particular levels of the factors, i.e., which chemistry types or segment sizes, lead to
sizes, lead to statistically significant differences in the emission estimates, all chemistry and segment
statistically significant differences in the emission estimates, all chemistry and segment levels were
levels were compared in a pairwise manner by running Tukey honestly significant difference tests.
compared in a pairwise
A significance level manner
thresholdby ofrunning
10% wasTukeyused in honestly significant
all the testing, difference
i.e., statistical tests.
test A significance
p-values lower
level threshold of 10% was used in all the testing, i.e., statistical test p-values lower
than 10% suggest that the observed differences in emissions estimates are indicative of an underlying than 10% suggest
that the observed
trend, differences
rather than being justin random
emissions estimates are indicative of an underlying trend, rather than
noise.
being just random noise.
3. Results and Discussion
3. ResultsPreliminary
and Discussion
descriptive statistics of chemistry and segment effects are shown in Figures 5 and 6,
for GHG emissions,
Preliminary in statistics
descriptive ratio-to-ICEV. Figure 5and
of chemistry boxplots
segment represent GHG
effects are ratio invalues
shown Figuresacross
5 and 6,
chemistries. Similarly, Figure 6 boxplots represent values across segments. As can be seen,
for GHG emissions, in ratio-to-ICEV. Figure 5 boxplots represent GHG ratio values across chemistries. for GHG
there is a clear dependency on the electricity mix: The cleaner it is, the less environmental impact BEV
Similarly, Figure 6 boxplots represent values across segments. As can be seen, for GHG there is a clear
dependency on the electricity mix: The cleaner it is, the less environmental impact BEV have, regardless
of the chemistry and segment factors. This dependency is well known (see e.g., References [30,31]) and
is not the main focus of this research. Rather, the present research aims at checking, for each particular
mix, whether the differences in observed emissions estimates for the various chemistries and segments
(measured in ratio variables) are indicative of statistically significant trends or mere statistical fluctuations.Sustainability 2019, 11, x FOR PEER REVIEW 9 of 20
Sustainability 2019, 11, 2366 8 of 19
Figure 5. Impact of electricity generation mix and battery chemistry on GHG ratio.
Figure 5. Impact of electricity generation mix and battery chemistry on GHG ratio.Sustainability 2019, 11, 2366 9 of 19
Sustainability 2019, 11, x FOR PEER REVIEW 10 of 20
Figure 6. Impact of electricity generation mix and vehicle segment on GHG ratio.
Figure 6. Impact of electricity generation mix and vehicle segment on GHG ratio.Sustainability 2019, 11, 2366 10 of 19
The figures hint at some LIB chemistries having slightly less environmental impact with respect to
GHG. Regarding vehicle segment, an interesting ordering trend can be seen for all mixes: There is less
GHG impact for small, followed up by SUV and mid-sized, with large vehicles being more pollutant.
Recall that this trend is exhibited in the GHG ratio variable, not in the absolute emissions values.
Similar figures for the other pollutants can be found in the Supplementary Material. The main
conclusions are summarized here. For those pollutants, there is a dependency on the mix, but not on
its cleanness. Rather, it is the nature of the main source of electricity that is important. For instance, for
CO and particulate matter, mix 4 (Denmark) has the highest impact on the ratio emissions due to this
mix’s high biomass content. Mix 13 (Estonia, coal) also leads to high PM content. For NOx, mix 9 is the
most impactful (Mexico, residual oil) and for the other cases, the dependency on the mix are smaller,
albeit, as will be seen, statistically significant in most cases.
What does carry through from the GHG case is the fact that smaller vehicles generally have
smaller (ratio) emissions, with SUV emissions being slightly higher than mid-sized vehicles, except for
VOC where they are clearly worse off than all other segments. This is, again, a non-trivial fact because
it is derived from ratio variables.
3.1. Statistical Analysis
Proceeding to the statistical analysis, two-way ANOVA on chemistry and segment were carried
out for all 13 mixes × 2 battery replacements (yes/no) × 7 pollutants = 182 cases, all of them having
resulted in significant differences for both the chemistry and segment factors (highest p-values are
below 0.1% for both factors). A total of 26 × 7 = 162 two-tailed t-tests of all BEV emissions estimates
versus a ratio of 1 (ICEV) were also carried out, whose p-values are shown in Table 4 below (green
[red]: BEV significantly less [more] pollutant than ICEV, yellow: no significant differences). BEV yield
reduced environmental impacts for four pollutants (out of seven), including GHG, which is arguably
the most important one due to the large volumes emitted and their climate impact. BEV are more
pollutant than ICEV for SOx and PM. Both these differences come from the fuel and vehicle cycles; the
increase cannot be directly attributed to a single cycle. For the particular case of SOx, BEV fuel cycle
emissions can be smaller than ICEV for cleaner mixes, but once vehicle cycle is accounted for, SOx
emissions always become bigger for BEV due to fabrication of the battery, motor, and power electronics
(see e.g., Reference [51]).
Table 4. t-tests p-values battery electric vehicles (BEV) vs. internal combustion engines vehicle (ICEV)
(ratio variables).
No battery Replacement Battery Replacement
GHG CO NOx SOx VOC PM10 PM2.5 GHG CO NOx SOx VOC PM10 PM2.5
1: Iceland
0% 0% 0% 0% 0% 99% 0% 0% 0% 0% 0% 0% 0% 44%
Others
2: France
0% 0% 0% 0% 0% 0% 22% 0% 0% 0% 0% 0% 0% 0%
Nuclear
3: 2040 SDS 0% 0% 0% 0% 0% 0% 0% 0% 0% 0% 0% 0% 0% 0%
4: Denmark
0% 0% 0% 0% 0% 0% 0% 0% 0% 0% 0% 0% 0% 0%
Biomass
5: OECD
0% 0% 0% 0% 0% 0% 0% 0% 0% 0% 0% 0% 0% 0%
Europe
6: 2040 NPS 0% 0% 0% 0% 0% 0% 0% 0% 0% 0% 0% 0% 0% 0%
7: OECD
0% 0% 0% 0% 0% 0% 0% 0% 0% 0% 0% 0% 0% 0%
Americas
8: 2040 CPS 0% 0% 0% 0% 0% 0% 0% 0% 0% 0% 0% 0% 0% 0%
9: Mexico
0% 0% 0% 0% 0% 0% 0% 0% 0% 0% 0% 0% 0% 0%
Residual oil
10: 2017 0% 0% 0% 0% 0% 0% 0% 0% 0% 18% 0% 0% 0% 0%Sustainability
Sustainability 2019, 11,
Sustainability 2019,
2019, 11, 2366
11, xx FOR
FOR PEER
PEER REVIEW
REVIEW 11 of
12
12 of 20
of 19
20
9: Mexico
0% 0% 0% 0% 0% Table 4. Cont.
0% 0% 0% 0% 0% 0% 0% 0% 0%
Residual oil
No battery Replacement Battery Replacement
10: 2017 0% 0% 0% 0% 0% 0% 0% 0% 0% 18% 0% 0% 0% 0%
GHG CO NOx SOx VOC PM10 PM2.5 GHG CO NOx SOx VOC PM10 PM2.5
11: OECD
11: OECD 11: OECD
Asia Oceania 0% 0%0% 0%
0% 0%
0% 0%
0% 0% 0%0% 0%
0% 0%
0% 0% 27%
0% 27% 0% 0%0% 0%
0% 0%
0% 0%
Asia OceaniaAsia Oceania
12: Israel 12: Israel
0%
0% 0%0%
0% 0%
0%
0% 0%
0%
0% 0%
0%
0% 0%0%
0% 0% 0%
0%
0% 0%
0%
0% 0% 20%
0%
0% 20% 0% 0%
20% 0%0% 0%
0%
0% 0%
0%
0% 0%
0%
Natural gasNatural gas
13: Estonia13: Estonia
99%
Coal
99% 0%99% 0%
0%
0%
0% 0%
0%
0%
0%
0% 0% 0%
0% 0%0% 0%
0%
0%
0%
0%
0%
0%
0% 59%
0% 59% 0% 0%
59% 0%0% 0%
0%
0%
0%
0%
0% 0%
0%
Coal
Following up
Following up on
on the ANOVA, Tukey
the ANOVA, Tukey tests
tests for
tests for chemistry
for chemistry and
chemistry and segment
segment factors were thoroughly
factors were thoroughly
carried out for each electricity mix and pollutant type. Figures 7–13 summarize the
carried out for each electricity mix and pollutant type. Figures 7–13 summarize the results results of
of the
the
chemistry pairwise comparisons
comparisons for the GHG, CO, NOx, SOx, VOC, PM10, and
chemistry pairwise comparisons for the GHG, CO, NOx, SOx, VOC, PM10, and PM2.5 emission PM2.5 emission
respectively.
estimates, respectively.
estimates, Statistical p-values
respectively. Statistical p-values can
can be
be found
be found in
found in the
in the supplementary
the supplementary data.
supplementary data.
data.
Battery
Battery 1: LMO
1: LMO 2: NMC111
2: NMC111 3: LFP
3: LFP 4: NMC622
4: NMC622 5: NMC811
5: NMC811 6: LMR-NMC
6: LMR-NMC 7: LMR-NMC:Gr-SI
7: LMR-NMC:Gr-SI 8: NCA
8: NCA
Replacement
Replacement
No
No
1: LMO
1: LMO
Yes
Yes
No
No
2: NMC111
2: NMC111
Yes
Yes
No
No
3: LFP
3: LFP
Yes
Yes
No
No
4: NMC622
4: NMC622
Yes
Yes
No
No
5: NMC811
5: NMC811
Yes
Yes
No
No
6: LMR-NMC
6: LMR-NMC
Yes
Yes
No
No
7: LMR-NMC:Gr-SI
7: LMR-NMC:Gr-SI
Yes
Yes
No
No
8: NCA
8: NCA
Yes
Yes
Figure 7.
Figure 7. Chemistry
Chemistry pairwise
Chemistry pairwise comparisons for
pairwise comparisons for the
the GHG
GHG emission
emission estimates
estimates (ratio-to-ICEV).
(ratio-to-ICEV).
Battery
Battery 1: LMO
1: LMO 2: NMC111
2: NMC111 3: LFP
3: LFP 4: NMC622
4: NMC622 5: NMC811
5: NMC811 6: LMR-NMC
6: LMR-NMC 7: LMR-NMC:Gr-SI
7: LMR-NMC:Gr-SI 8: NCA
8: NCA
Replacement
Replacement
No
No
1: LMO
1: LMO
Yes
Yes
No
No
2: NMC111
2: NMC111
Yes
Yes
No
No
3: LFP
3: LFP
Yes
Yes
No
No
4: NMC622
4: NMC622
Yes
Yes
No
No
5: NMC811
5: NMC811
Yes
Yes
No
No
6: LMR-NMC
6: LMR-NMC
Yes
Yes
No
No
7: LMR-NMC:Gr-SI
7: LMR-NMC:Gr-SI
Yes
Yes
No
No
8: NCA
8: NCA
Yes
Yes
Figure 8.
Figure 8. Chemistry
Chemistry pairwise
Chemistry pairwise comparisons for
pairwise comparisons for the
the CO
CO emission
emission estimates
estimates (ratio-to-ICEV).
(ratio-to-ICEV).
Battery
Battery 1: LMO
1: LMO 2: NMC111
2: NMC111 3: LFP
3: LFP 4: NMC622
4: NMC622 5: NMC811
5: NMC811 6: LMR-NMC
6: LMR-NMC 7: LMR-NMC:Gr-SI
7: LMR-NMC:Gr-SI 8: NCA
8: NCA
Replacement
Replacement
No
No
1: LMO
1: LMO
Yes
Yes
No
No
2: NMC111
2: NMC111
Yes
Yes
No
No
3: LFP
3: LFP
Yes
Yes
No
No
4: NMC622
4: NMC622
Yes
Yes
No
No
5: NMC811
5: NMC811
Yes
Yes
No
No
6: LMR-NMC
6: LMR-NMC
Yes
Yes
No
No
7: LMR-NMC:Gr-SI
7: LMR-NMC:Gr-SI
Yes
Yes
No
No
8: NCA
8: NCA
Yes
Yes
Figure 9.
Figure 9. Chemistry
Chemistry pairwise comparisons
Chemistry pairwise comparisons for
for the
the NOx
NOx emission
emission estimates
estimates (ratio-to-ICEV).
(ratio-to-ICEV).Sustainability 2019, 11, 2366 12 of 19
Sustainability 2019, 11, x FOR PEER REVIEW 13 of 20
Sustainability 2019,
Sustainability 2019, 11,
11, xx FOR
FOR PEER
PEER REVIEW
REVIEW 13 of
13 of 20
20
Battery
Battery 1:
1: LMO
LMO 2:
2: NMC111
NMC111 3:
3: LFP
LFP 4:
4: NMC622
NMC622 5:
5: NMC811
NMC811 6:
6: LMR-NMC
LMR-NMC 7:
7: LMR-NMC:Gr-SI
LMR-NMC:Gr-SI 8:
8: NCA
NCA
Replacement
Replacement
Battery
Battery 1: LMO
LMO 2: NMC111
NMC111 3: LFP
LFP 4: NMC622
NMC622 5: NMC811
NMC811 6: LMR-NMC
LMR-NMC 7: LMR-NMC:Gr-SI
LMR-NMC:Gr-SI 8: NCA
NCA
No
No
Replacement 1: 2: 3: 4: 5: 6: 7: 8:
1: LMO
1: LMO Replacement
YesNo
Yes
1: LMO
LMO No
1: NoYes
No
2: NMC111
NMC111 Yes
2:
Yes
No
Yes
No
2: NMC111
2: NMC111
No
NoYes
Yes
3:
3: LFP
LFP
Yes
No
Yes
No
3: LFP
3: LFP No
NoYes
Yes
4: NMC622
4: NMC622
Yes
No
Yes
No
4: NMC622
4: NMC622
No
NoYes
Yes
5: NMC811
5: NMC811
No
Yes
Yes
No
5: NMC811
5: NMC811
No
NoYes
Yes
6: LMR-NMC
6: LMR-NMC
No
Yes
Yes
No
6: LMR-NMC
6: LMR-NMC
NoYes
Yes
No
7:
7: LMR-NMC:Gr-SI
LMR-NMC:Gr-SI No
Yes
No
Yes
7: LMR-NMC:Gr-SI
7: LMR-NMC:Gr-SI
NoYes
Yes
No
8: NCA
8: NCA
No
Yes
No
Yes
8: NCA
8: NCA
Yes
Yes
Figure 10. Chemistry pairwise comparisons for the SOx emission estimates (ratio-to-ICEV).
Figure 10.Chemistry
Chemistry pairwise
pairwise comparisons for the SOx emission estimates (ratio-to-ICEV).
Battery
Battery 1:
1: LMO
LMO 2:
2: NMC111
NMC111 3:
3: LFP
LFP 4:
4: NMC622
NMC622 5:
5: NMC811
NMC811 6:
6: LMR-NMC
LMR-NMC 7:
7: LMR-NMC:Gr-SI
LMR-NMC:Gr-SI 8:
8: NCA
NCA
Battery
Replacement
Battery
Replacement 1: LMO
1: LMO 2: NMC111
2: NMC111 3: LFP
3: LFP 4: NMC622
4: NMC622 5: NMC811
5: NMC811 6: LMR-NMC
6: LMR-NMC 7: LMR-NMC:Gr-SI
7: LMR-NMC:Gr-SI 8: NCA
8: NCA
Replacement
No
Replacement
No
1: LMO
1: LMO No
1: LMO
LMO No
Yes
Yes
1: Yes
Yes
No
No
2: NMC111
2: NMC111 No
2: NMC111
NMC111 No
Yes
Yes
2: Yes
Yes
No
No
3: LFP
3: LFP No
3: LFP
LFP No
Yes
3: Yes
Yes
Yes
No
No
4: NMC622
4: NMC622 No
No
4: NMC622
4: NMC622 Yes
Yes
Yes
Yes
No
No
5: NMC811
5: NMC811 No
No
5: NMC811
5: NMC811 Yes
Yes
Yes
Yes
No
No
6: LMR-NMC
6: LMR-NMC No
No
6: LMR-NMC
6: LMR-NMC Yes
Yes
Yes
Yes
No
NoNo
7: LMR-NMC:Gr-SI
7: LMR-NMC:Gr-SI No
7: LMR-NMC:Gr-SI
7: LMR-NMC:Gr-SI Yes
Yes
Yes
Yes
No
NoNo
8: NCA
8: NCA No
8: NCA
8: NCA Yes
Yes
Yes
Yes
Figure
Figure11.
Figure 11.Chemistry
11. Chemistrypairwise
Chemistry pairwisecomparisons
pairwise comparisons for
comparisons for the VOC emission
VOC emission
the VOC estimates
emission estimates (ratio-to-ICEV).
estimates (ratio-to-ICEV).
(ratio-to-ICEV).
Battery
Battery
Battery
Battery 1:1:LMO
1: LMO
LMO 2:2:NMC111
2: NMC111
NMC111 3:
3: LFP
3:LFP
LFP 4:
4: NMC622
4: NMC622
NMC622 5: NMC811
5:
5: NMC811
NMC811 6:LMR-NMC
6:
6: LMR-NMC
LMR-NMC 7:LMR-NMC:Gr-SI
7:7: LMR-NMC:Gr-SI
LMR-NMC:Gr-SI 8:NCA
8:8: NCA
NCA
Replacement
Replacement
Replacement 1: LMO 2: NMC111 3: LFP 4: NMC622 5: NMC811 6: LMR-NMC 7: LMR-NMC:Gr-SI 8: NCA
Replacement
No
NoNo
No
1: LMO
1: LMO
1: LMO
LMO
1: Yes
Yes
Yes
Yes
NoNo
No
2: NMC111
2: NMC111
2: NMC111
NMC111 No
2: Yes
Yes
Yes
Yes
NoNo
No
3: LFP
3: LFP
3: LFP
LFP No
3: Yes
Yes
Yes
Yes
NoNo
NoNo
4: NMC622
4: NMC622
4: NMC622
NMC622
4: Yes
Yes
Yes
Yes
NoNo
NoNo
5: NMC811
5: NMC811
5: 5: NMC811
NMC811
Yes
Yes
Yes
Yes
NoNo
NoNo
6: LMR-NMC
6: LMR-NMC
6: 6: LMR-NMC
LMR-NMC
Yes
Yes
Yes
Yes
NoNo
NoNo
7: 7:
7: LMR-NMC:Gr-SI
7: LMR-NMC:Gr-SI
LMR-NMC:Gr-SI
LMR-NMC:Gr-SI
Yes
Yes
Yes
Yes
No
NoNo
No
8: 8: NCA
8: 8:
NCA
NCANCA
Yes
Yes
Yes
Yes
Figure12.
Figure 12.Chemistry
Chemistrypairwise
Chemistry pairwisecomparisons
pairwise comparisons for
for the
the PM10
PM10 emission
emission estimates
estimates (ratio-to-ICEV).
(ratio-to-ICEV).
Battery
Battery
Battery
Battery 1:1:LMO
1:1: LMO
LMO
LMO 2:2:NMC111
2:2: NMC111
NMC111
NMC111 3:LFP
3:
3:
3: LFP
LFP
LFP 4: NMC622
4:
4: NMC622
NMC622 5:
5:
5: NMC811
NMC811
5:NMC811
NMC811 6:
6:
6: LMR-NMC
LMR-NMC
6:LMR-NMC
LMR-NMC 7:7:
7: LMR-NMC:Gr-SI
LMR-NMC:Gr-SI
7:LMR-NMC:Gr-SI
LMR-NMC:Gr-SI 8:8:
8: NCA
NCA
NCA
8: NCA
Replacement
Replacement
Replacement
Replacement
No
NoNo
1: LMO
LMO No
1: 1:
1: LMO
LMO Yes
Yes
Yes
Yes
No
NoNo
2: NMC111
NMC111 No
2: 2:
2: NMC111
NMC111 Yes
Yes
Yes
Yes
No
NoNo
3: LFP
LFP No
3: 3:
3: LFP
LFP Yes
Yes
Yes
Yes
No
4: NMC622
NMC622 NoNo
No
4: 4:
4: NMC622
NMC622 Yes
Yes
Yes
Yes
No
5: NMC811
NMC811 NoNo
No
5: 5:
5: NMC811
NMC811 Yes
Yes
Yes
Yes
No
6: LMR-NMC
LMR-NMC NoNo
No
6: 6:
6: LMR-NMC
LMR-NMC Yes
Yes
Yes
Yes
No
No
7: LMR-NMC:Gr-SI
LMR-NMC:Gr-SI No
No
7: 7:
7: LMR-NMC:Gr-SI
LMR-NMC:Gr-SI Yes
Yes
Yes
Yes
No
8: NCA
8: NCA NoNo
No
8: NCA
8: NCA Yes
Yes
Yes
Yes
Figure13.
Figure 13.Chemistry
Chemistrypairwise
Chemistry pairwisecomparisons
pairwise comparisons for
for the
the PM2.5
PM2.5 emission
emission estimates
estimates (ratio-to-ICEV).
(ratio-to-ICEV).
Eachpairwise
Each pairwise comparison
comparison isis displayed
displayed in
in the
the format
format “row
“row vs.
vs. column”,
column”, with
with green
greenmeaning
meaning
“row chemistry is significantly cleaner (less polluting) than column chemistry” (red
“row chemistry is significantly cleaner (less polluting) than column chemistry” (red meaning
meaning
dirtier/more polluting, and yellow not significantly different), and contains 13 cells as well, one for
dirtier/more polluting, and yellow not significantly different), and contains 13 cells as well, one forSustainability 2019, 11, 2366 13 of 19
Each pairwise comparison is displayed in the format “row vs. column”, with green meaning “row
chemistry is significantly cleaner (less polluting) than column chemistry” (red meaning dirtier/more
polluting, and yellow not significantly different), and contains 13 cells as well, one for each electricity
generation mix, ordered as in Figure 3 from the cleaner (1: Iceland) to the dirtier (13: Estonia). For
instance, the first row of the Figure 7 reads as follows: LIB chemistry 1 (LMO) produces lower GHG
emissions than chemistries 2, 4, 5, and 8, not significantly different for mix 3, and more GHG emissions
than LIB chemistry 7, but only for the first three electricity mixes.
The results are now analyzed per pollutant, with general trends commented upon in the end.
For GHG emissions (Figure 7), results indicate a general trend for chemistries 1, 3, 6, and 7 to be
statistically cleaner than chemistries 2, 4, 5, and 8 regardless of battery replacement. Cleaner/dirtier
electricity mixes slightly change this picture for particular cases but not overall.
A trend very similar to GHG arises for the CO (Figure 8), NOx (Figure 9), and SOx emissions
(Figure 10), but in these cases, the differences coming from the electricity mix and battery replacement
are even subtler. Again, cleaner/dirtier mixes introduce some variations but overall the conclusion that
LIB chemistries 1, 3, 6, and 7 are statistically cleaner than 2, 4, 5, and 8 is reinforced.
As to VOC emissions (Figure 11), the situation is slightly different. For this pollutant, the
LMR-NMC-type chemistries (6 and 7) outperform the rest.
The scenario for PM2.5 (Figure 13) is similar to the one for other pollutants. However, for PM10
(Figure 12), the situation differs slightly. While the trend still holds in general, mixes #4 (most biomass
content) and #13 (most coal) introduce a slight tendency towards equality of LIB chemistries. This is
actually not too unexpected, given the high PM10 amounts produced from burning coal and biomass.
General conclusions can now be derived with respect to the LIB chemistry factor:
• In general, results show a clear trend for LIB chemistries 1, 3, 6, and 7 to be cleaner than chemistries
2, 4, 5, and 8.
• That trend is mildly affected by the carbon content of the electricity mix and primary energy
source. High coal mixes tend to make all LIB chemistries more similar to each other for most
pollutants, whereas for PM10, the same also happens for high biomass mixes.
• The consideration of one battery replacement has only a marginal effect in the results, again,
biasing chemistries towards equality.
• LIB chemistries 6 and 7 (LMR-MNC and LMR-NMC: Gr-Si) are more resilient against effects
coming from either electricity mix or battery replacement factors and are cleaner when it comes
to VOC. These are, thus, the more promising LIB technologies for reaching cleaner automotive
transportation in the long run.
This conclusion, that new LIB chemistries, especially LMR-NMC and LMR-NMC: Gr-Si, are
statistically less pollutant than older ones is one of the main outcomes of this research. Not only that,
they also have the highest energy densities (recall Figure 1). Higher densities partly explain why these
chemistries are less pollutant, as it means less mass for the same capacity, hence less materials used.
But this is not the only reason: If NCA energy densities are given to the LMR chemistries, the latter
still remain statistically less pollutant. In fact, chemistries 1 and 3 are cleaner than current chemistries
despite having lower energy densities.
Turning now to the segment factor, Figure 14 summarizes the results for pairwise comparisons
across all LIB chemistries.Sustainability 2019, 11, 2366 14 of 19
Sustainability 2019, 11, x FOR PEER REVIEW 15 of 20
GHG CO
Vehicle Battery
Small Medium Large SUV Small Medium Large SUV
segment Replacement
No
Small
Yes
No
Medium
Yes
No
Large
Yes
No
SUV
Yes
NOx SOx
Vehicle Battery
Small Medium Large SUV Small Medium Large SUV
segment Replacement
No
Small
Yes
No
Medium
Yes
No
Large
Yes
No
SUV
Yes
VOC PM10
Vehicle Battery
Small Medium Large SUV Small Medium Large SUV
segment Replacement
No
Small
Yes
No
Medium
Yes
No
Large
Yes
No
SUV
Yes
PM2.5
Vehicle Battery
Small Medium Large SUV
segment Replacement
No
Small
Yes
No
Medium
Yes
No
Large
Yes
No
SUV
Yes
Figure
Figure 14.
14. Vehicle segment pairwise
Vehicle segment pairwise comparisons
comparisons for
for all
all pollutants
pollutants (ratio-to-ICEV).
(ratio-to-ICEV).
possible to conclude
From Figure 14, it is possible conclude that, except for VOC, the statistical results suggest an
ordering, from cleaner to to dirtier,
dirtier, of smallSustainability 2019, 11, 2366 15 of 19
3.2. How Much
Sustainability 2019,Cleaner Does
11, x FOR PEERItREVIEW
Get? 16 of 20
Having ascertained that LIB chemistry and segment do make a statistical difference in terms of
a consumer choice, made according to its personal needs and therefore not likely to change for
emissions estimates, it is interesting to check how far the difference can go. Since vehicle segment
environmental reasons in the near-future, the LIB chemistry factor is arguably more important to
is a consumer choice, made according to its personal needs and therefore not likely to change for
focus on.
environmental reasons in the near-future, the LIB chemistry factor is arguably more important
Figure 15 indicates, displayed across segments, the emissions reductions for all pollutants in
to focus on.
going from the conventional NMC111 and NCA chemistries to the newer, arguably cleaner, LMR-
Figure 15 indicates, displayed across segments, the emissions reductions for all pollutants in going
NMC: Gr-Si technology.
from the conventional NMC111 and NCA chemistries to the newer, arguably cleaner, LMR-NMC:
Gr-Si technology.
Figure 15. Reduction percentages in emission estimates from changing battery chemistry. Minimum
Figure 15. Reduction percentages in emission estimates from changing battery chemistry. Minimum
and maximum obtained across electricity mix.
and maximum obtained across electricity mix.
The emissions reductions range from marginal (below 10%) to considerable (50%–60%) depending
The emissions reductions range from marginal (below 10%) to considerable (50%–60%)
on pollutant type. For clarification, note that a maximum reduction percentage of, say, 50% in a certain
depending on pollutant type. For clarification, note that a maximum reduction percentage of, say,
pollutant and segment means that there is an electricity mix and segment for which the ratio-to-ICEV
50% in a certain pollutant and segment means that there is an electricity mix and segment for which
variable for that pollutant can drop by one-half. In fact, the same happens for the absolute (non-ratio)
the ratio-to-ICEV variable for that pollutant can drop by one-half. In fact, the same happens for the
emissions estimates values.
absolute (non-ratio) emissions estimates values.
Results of emissions reductions coming from the chemistry change exhibit some variability with
Results of emissions reductions coming from the chemistry change exhibit some variability with
the electricity mix. For GHG and SOx, it can be checked that the cleaner the mix, the greater the
the electricity mix. For GHG and SOx, it can be checked that the cleaner the mix, the greater the
reduction is. For NOx and PM, the fluctuations are mostly due to the mixes with more emissions in
reduction is. For NOx and PM, the fluctuations are mostly due to the mixes with more emissions in
the respective pollutant (mix 9, mix 4), in which case the reductions are smaller. For VOC and CO,
the respective pollutant (mix 9, mix 4), in which case the reductions are smaller. For VOC and CO,
the reductions are practically independent of the mix. Recall that the cleaner the mix is, the more
the reductions are practically independent of the mix. Recall that the cleaner the mix is, the more
important the vehicle cycle is.
important the vehicle cycle is.
Overall, the figure shows that a technological shift towards new chemistries has the potential to
Overall, the figure shows that a technological shift towards new chemistries has the potential to
reduce environmental impact of BEV for most pollutants. Note, though, that certain pollutants are not
reduce environmental impact of BEV for most pollutants. Note, though, that certain pollutants are
very much influenced by the LIB chemistry e.g., the VOC emissions, whose principal cause are the
not very much influenced by the LIB chemistry e.g., the VOC emissions, whose principal cause are
vehicle fluids, and the CO, which is mainly caused by the energy mix. Despite this weaker link, results
the vehicle fluids, and the CO, which is mainly caused by the energy mix. Despite this weaker link,
show that the dependency on LIB chemistry is statistically relevant. For the remaining pollutants,
results show that the dependency on LIB chemistry is statistically relevant. For the remaining
significant reductions can be achieved, particularly in SOx. Because BEV emit more SOx and PM than
pollutants, significant reductions can be achieved, particularly in SOx. Because BEV emit more SOx
ICEV in their life cycle, reductions in these pollutants are particularly important but, in practice, even
and PM than ICEV in their life cycle, reductions in these pollutants are particularly important but, in
with these reductions, BEV still remain the more pollutant vehicle type.
practice, even with these reductions, BEV still remain the more pollutant vehicle type.
Note that when battery replacement is considered during the vehicle lifetime, the reduction
percentages in general increase. This is because the comparison is between two battery types; the
more replacements there are, the wider the emissions gap between the two is.Sustainability 2019, 11, 2366 16 of 19
Note that when battery replacement is considered during the vehicle lifetime, the reduction
percentages in general increase. This is because the comparison is between two battery types; the more
replacements there are, the wider the emissions gap between the two is.
4. Conclusions
This article presented a statistical study of life cycle emissions assessment of several pollutants
for battery electric vehicles using the GREET 2018 life-cycle assessment model. The main objective
was to determine whether newer LIB chemistries could contribute to a reduction in the environmental
impact of those pollutants, and also if a dependency on vehicle segment exists. Because vehicle size
has a clear influence on absolute values emissions estimates, ratio variables, i.e., ratio of emissions
estimates to the corresponding petrol combustion engine estimate, were considered instead in the
analysis. Eight battery chemistries, 13 mixes and four vehicle segments were considered, as well as the
possibility of having one (or no) battery replacement during vehicle lifetime. A total of 884 emission
estimates for each pollutant and electricity mix were assessed and statistical analysis on the outcome
were performed on a per-mix basis using two-way ANOVA with Li-ion battery chemistry and vehicle
segment as factors and subsequent Tukey post-hoc tests for the same factors.
Results confirm the (expected) outcome that cleaner electricity mixes lead to lower emissions
estimates for all pollutants, but two other main conclusions, which are new, emerged from the statistical
analysis. First, newer Li-ion battery chemistries can lead to statistically significant improvements on
the environmental impact of all pollutants. Mostly, these improvements lie in the vicinity of a 10%–20%
emissions reduction but can go up to 60% for sulphur oxides in the cleaner electricity mixes. Second,
vehicle segment is also relevant, and a cleanness rank emerged of smaller < medium < SUV < large,
with “Sustainability 2019, 11, 2366 17 of 19
3. ACEA. The Automobile Industry Pocket Guide 2018/2019; European Automobile Manufacturers’ Association:
Brussels, Belgium, 2018; Available online: https://www.acea.be/uploads/publications/ACEA_Pocket_Guide_
2018-2019.pdf (accessed on 19 April 2019).
4. Lorenzi, G.; Baptista, P. Promotion of renewable energy sources in the Portuguese transport sector: A scenario
analysis. J. Clean. Prod. 2018, 186, 918–932. [CrossRef]
5. Irle, R. Global Plug-in Sales for the 1st Half of 2018. Available online: http://www.ev-volumes.com/country/
total-world-plug-in-vehicle-volumes/ (accessed on 10 March 2019).
6. ICCT. Electric Vehicles. Available online: https://www.theicct.org/electric-vehicles (accessed on 20 December 2018).
7. Burch, I.; Gilchrist, J. Survey of Global Activity to Phase Out Internal Combustion Engine Vehicles; Center of
Climate Protection: Santa Rosa, CA, USA, 2018.
8. OECD/IEA. Global EV Outlook 2018—Towards Cross-Modal Electrification; International Energy Agency: Paris,
France, 2018.
9. Ding, Y.; Cano, Z.P.; Yu, A.; Lu, J.; Chen, Z. Automotive Li-Ion Batteries: Current Status and Future
Perspectives. Electrochem. Energy Rev. 2019, 2, 1–28. [CrossRef]
10. Keshavarzmohammadian, A.; Cook, S.M.; Milford, J.B. Cradle-to-gate environmental impacts of sulfur-based
solid-state lithium batteries for electric vehicle applications. J. Clean. Prod. 2018, 202, 770–778. [CrossRef]
11. Wang, Y.; Sahadeo, E.; Rubloff, G.; Lin, C.-F.; Lee, S.B. High-capacity lithium sulfur battery and beyond:
A review of metal anode protection layers and perspective of solid-state electrolytes. J. Mater. Sci. 2019, 54,
3671–3693. [CrossRef]
12. Shoji, M.; Cheng, E.J.; Kimura, T.; Kanamura, K. Recent progress for all solid state battery using sulfide and
oxide solid electrolytes. J. Phys. D Appl. Phys. 2019, 52, 103001. [CrossRef]
13. Laslau, C.; Xie, L.; Robinson, C. The Next-Generation Battery Roadmap: Quantifying How Solid-State,
Lithium-Sulfur, and Other Batteries Will Emerge after 2020; Lux Research Inc.: Boston, MA, USA, 2015;
Available online: https://members.luxresearchinc.com/research/report/17977 (accessed on 19 April 2019).
14. Scrosati, B.; Garche, J. Lithium batteries: Status, prospects and future. J. Power Sour. 2010, 195, 2419–2430.
[CrossRef]
15. Feng, K.; Li, M.; Liu, W.; Kashkooli, A.G.; Xiao, X.; Cai, M.; Chen, Z. Silicon-Based Anodes for Lithium-Ion
Batteries: From Fundamentals to Practical Applications. Small 2018, 14, 1702737. [CrossRef]
16. ISO 14040. Environmental Management—Life Cycle Assessment—Principles and Framework; International
Organization for Standardization: Geneva, Switzerland, 2006.
17. Ke, W.; Zhang, S.; He, X.; Wu, Y.; Hao, J. Well-to-wheels energy consumption and emissions of electric
vehicles: Mid-term implications from real-world features and air pollution control progress. Appl. Energy
2017, 188, 367–377. [CrossRef]
18. Bicer, Y.; Dincer, I. Life cycle assessment of ammonia utilization in city transportation and power generation.
J. Clean. Prod. 2018, 170, 1594–1601. [CrossRef]
19. Wu, Z.; Wang, M.; Zheng, J.; Sun, X.; Zhao, M.; Wang, X. Life cycle greenhouse gas emission reduction
potential of battery electric vehicle. J. Clean. Prod. 2018, 190, 462–470. [CrossRef]
20. Wang, M.; Elgowainy, A.; Benavides, P.T.; Burnham, A.; Cai, H.; Dai, Q.; Hawkins, T.R.; Kelly, J.C.; Kwon, H.;
Lee, D.-Y.; et al. Summary of Expansions and Updates in GREET2018; Systems Assessment Group, Energy
Systems Division, Argonne National Laboratory. Available online: https://greet.es.anl.gov/files/greet-2018-
summary (accessed on 10 March 2019).
21. IPCC. Climate Change 2014: Synthesis Report. Contribution of Working Groups I, II and III to the Fifth Assessment
Report of the Intergovernmental Panel on Climate Change; Pachauri, R.K., Meyer, L.A., Eds.; IPCC: Geneva,
Switzerland, 2014.
22. Nordelöf, A.; Messagie, M.; Tillman, A.-M.; Ljunggren Söderman, M.; Van Mierlo, J. Environmental impacts
of hybrid, plug-in hybrid, and battery electric vehicles—What can we learn from life cycle assessment? Int. J.
Life Cycle Assess. 2014, 19, 1866–1890. [CrossRef]
23. Hawkins, T.R.; Singh, B.; Majeau-Bettez, G.; Strømman, A.H. Comparative Environmental Life Cycle
Assessment of Conventional and Electric Vehicles. J. Ind. Ecol. 2012, 17, 53–64. [CrossRef]
24. De Souza, L.L.P.; Lora, E.E.S.; Palacio, J.C.E.; Rocha, M.H.; Renó, M.L.G.; Venturini, O.J. Comparative
environmental life cycle assessment of conventional vehicles with different fuel options, plug-in hybrid
and electric vehicles for a sustainable transportation system in Brazil. J. Clean. Prod. 2018, 203, 444–468.
[CrossRef]You can also read