Singapore Carbon Taxes An Analysis of the Policy Context1
←
→
Page content transcription
If your browser does not render page correctly, please read the page content below
May 2019

Regional Project Energy Security and Climate Change Asia-Pacific
(RECAP)

Singapore Carbon Taxes
An Analysis of the Policy Context1

Dr Maria Francesch-Huidobro, Principal Consultant, KAS RECAP

1
  This is an update of the 13 November 2017 KAS-RECAP policy analysis by the same author
titled ‘Singapore’s Prospective Carbon Taxes, An Analysis of the Policy Context’. Updates
pertain to the commencement in 1 January 2019 of the Carbon Pricing Act 2018
https://sso.agc.gov.sg/Acts-Supp/23-2018/Published/20180601?DocDate=20180601
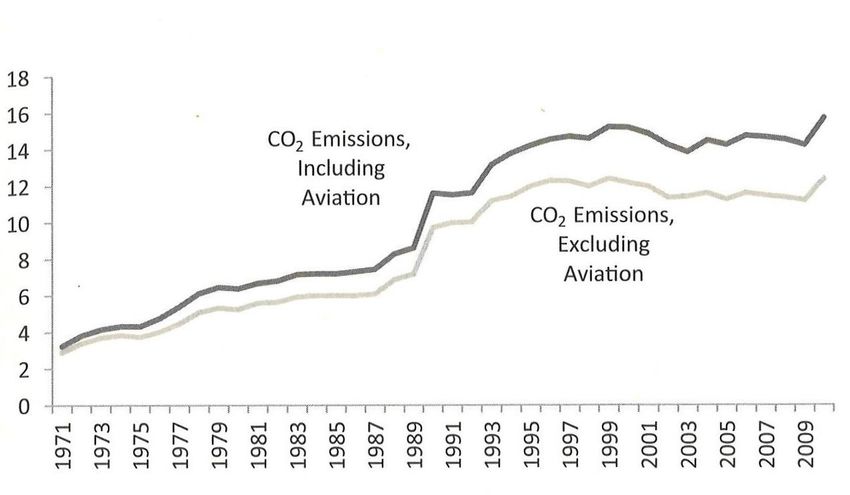
Table of Contents

Key Points

I. The Policy Context
1.1. Trends in economic and energy policy
1.2. Trends in energy demand and supply
1.3. Singapore’s nationally determined contributions (NDCs)
1.4. Singapore’s GHG emissions
1.5. Singapore’s carbon footprint

II. The Carbon Tax
2.1. The 2017 budget on carbon tax and the 2019 implementation
2.2. What are the advantages/disadvantages of market-based
instrument versus command and control tools?

III. Conclusion & Recommendations

References

Policy Documents

Agencies

Energy Efficiency Government Schemes
Konrad-Adenauer-Stiftung e. V.
Regional Project Energy Security and Climate Change Asia-Pacific (RECAP) May 2019 3
3
Key Points
› Singapore’s power mix is dominated by gas (95.5%). The establishment of an
LNG regasification plant in 2013 has expanded its access to global sources and,
thus, increased energy security. Total dependence on piped gas is to end by
2030.
› Given geographical and geological constraints, the deployment of renewables
and civil nuclear is limited. Currently, Photovoltaic (PV) SolarNova by the
Economic Development Board (EDB) and the Housing Development Board
(HDB); Floating Solar PV by the Public Utilities Board (PUB) and EDB, and Waste-
to-Energy (WtE) by National Environment Agency’s (NEA) Integrated Waste
Management Facility 2024, are the major sources of RE for electricity generation
amounting to about 4% (2016).
› Energy Efficiency (EE) in industry, buildings, transport, household, water and
waste (by EDB and NEA) is, thus, Singapore’s key strategy for reducing GHG
emissions. Yet, a government regulatory approach to EE may incur high costs
and unintended social consequences.
› The deployment of carbon taxes was announced in 2017 as ‘the most
economically efficient and fair way to reduce greenhouse gas emissions so that
emitters will take the necessary actions’ (2017 Budget). The tax was implemented in
2019 with the enactment of the 2018 Carbon Pricing Act (CPA).
› Pricing carbon through a carbon tax has thus been placed at the foundation of
the EE strategy. It is anticipated that taxes will encourage changes in
consumption, provide market incentives for the adoption of EE technologies,
and stimulate the growth of green industries.
› Carbon taxes will be applied upstream, that is, to direct emitters (power stations,
etc). Emitters can opt to improve energy efficiency and reduce emissions or pay
taxes. Consumers can opt to use less electricity and save energy (but taxes will
not apply downstream). Tax revenue will fund transitional costs as well as
measures taken by industries to reduce emissions.
› Thus, it is expected that energy efficiency, low-carbon technology, and reduced
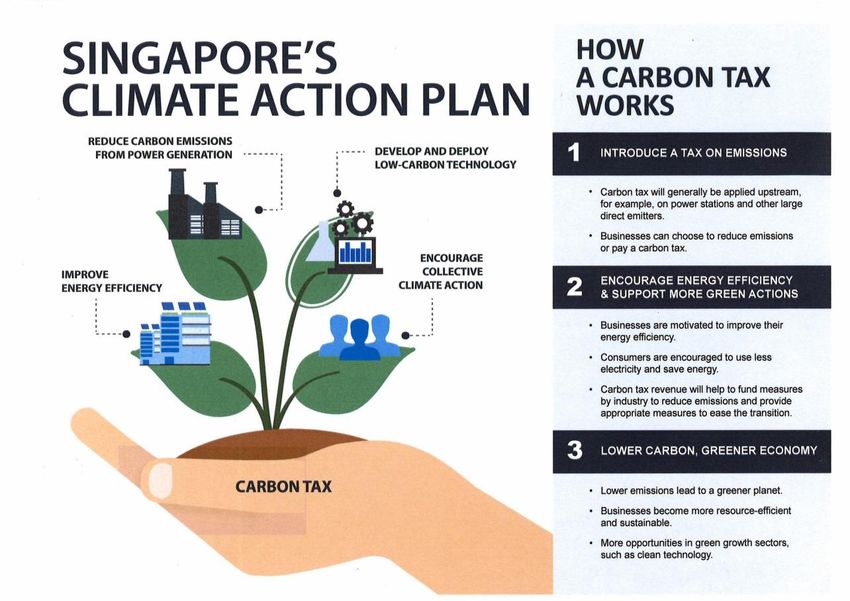
emissions will in future ‘grow’ out of carbon taxes (see Figure 4).
Konrad-Adenauer-Stiftung e. V.
Regional Project Energy Security and Climate Change Asia-Pacific (RECAP)                 May 2019   4
                                                                                               4

1. The Policy Context

Understanding the policy context within which policy instruments are deployed in
the delivery of public policy is essential in assessing the pros and cons a particular
instrument may encounter and its success in achieving its intended goal.

Singapore has decided to implement carbon taxes as a market-based instrument
to reduce GHG emissions. The policy context of this decision relates to: trends in
Singapore’s economic and energy policy; trends in energy demand (buildings,
industry, transport) and supply (primary oil & gas and power sector); the nationally
determined contributions (NDCs) Singapore has pledged for 2020 (in Copenhagen
2009) and for 2030 (in Paris 2015); Singapore’s GHG emissions; and Singapore’s
carbon footprint.

These are discussed.

1.1. Trends in economic and energy policy

Economic Overview

Given its robust services-oriented economy, Singapore’s gross domestic product
(GDP) is expected to increase from 405 US$ billion PPP2 in 2020 to 505 US$ billion
in 2040 (World Bank 2015; APERC 2016: 280). Due to its projected population
growth from 5.7 million in 2020 to 6.2 million in 2040, the total final energy
demand (TFED) (2013-2040) will increase by 15% (from 20Mtoe3 to 23Mtoe)
(Singapore Statistics 2017; APERC 2016).

The city-state is 100% dependent on imports of oil and gas for domestic
consumption, including power generation and supplies to its three oil refineries
that export refined products. High levels of renewables (including hydro, solar,
wind, geothermal, biomass and marine) are unsuitable to a compact, highly
urbanised, low wind, tropical locality. Nuclear energy has been excluded given its
safety risks.

The domestic TFED utilised in buildings, industry and transport (20Mtoe in 2013) is
significantly smaller than the total primary energy supply (TPES) (23Mtoe). This
substantial gap is due to the fact that a large proportion of the oil supplied
(imported) is refined and re-exported (52Mtoe in 2013) as well as utilised by the
international shipping and aviation industries that demand large quantities of
bunker and jet fuels (IEA 2016; APERC 2016).

Energy-related emissions were 47MtCO2e in 2013 and are projected to rise to
53MtCO2e in 2040 and stabilise thereafter (ibid.).

2
    PPP: purchasing power parity
3
    Mtoe: million tonnes oil equivalent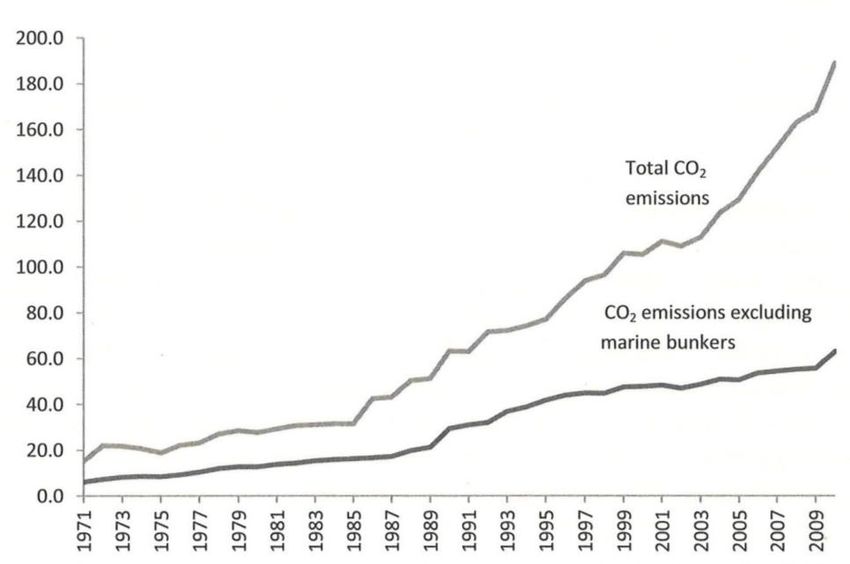
Konrad-Adenauer-Stiftung e. V.
Regional Project Energy Security and Climate Change Asia-Pacific (RECAP)             May 2019   5
                                                                                           5

While the refinery sector is a large source of revenue, it creates a situation of
embedded emissions in products that are processed by not consumed
domestically. This is a challenge in calculating the city’s GHG emissions and in
setting ‘effective’ reduction targets.

Energy Policy: The Energy Policy Group and the National Energy Report 2007

In 2007, Singapore took a ‘whole of government’ approach to energy policy with the
establishment of the Energy Policy Group (EPG). Ministries and agencies with
portfolios touching on energy were institutionally brought together to formulate,
coordinate and implement an energy policy framework and study a wide-range of
energy related issues in the power, transport sectors, energy efficiency, climate
change, energy industry, R&D, and regional and international cooperation.

Under the leadership of the Ministry of Trade and Industry (MTI), EPG includes the
ministries of Environment and Water Resources (MEWR), Foreign Affairs (MFA),
Transport (MOT), and Finance (MOF) and agencies such as the Energy Market
Authority (EMA), the Economic Development Board (EDB), National Environment
Agency (NEA), Land Transportation Authority (LTA), and Building and Construction
Authority (BCA).

In the same year, EPG published the Singapore National Energy Report: Energy for
Growth (NER 2007) with the objective of balancing energy security, economic
competitiveness, and environmental sustainability. To operationalise these
objectives, five strategies were devised:

›   Promoting competitive markets;
›   Diversifying the fuel mix;
›   Enhancing energy efficiency;
›   Developing the energy industry by investing in energy R&D, and;
›   Upscaling international cooperation.

These strategies are resulting, among others, in an end of total dependence on
piped-gas imports from Malaysia and Indonesia and, instead, reliance on global
imports of liquefied natural gas (LNG) that is regasified locally.

They have also resulted in: a) the deployment of photovoltaic (PV) under the
SolarNova and Floating PV programmes for government buildings, public spaces and
reservoirs that are used as test beds for the potential deployment in the private
sector; b) the intensification of energy efficiency to support Singapore’s
commitment to reducing carbon intensity by 36% from 2005 levels by 2030; and c)
investing in R&D by ‘building a clean energy ecosystem with a critical mass of
companies, skilled manpower, and R&D capabilities’ (MTI 2015).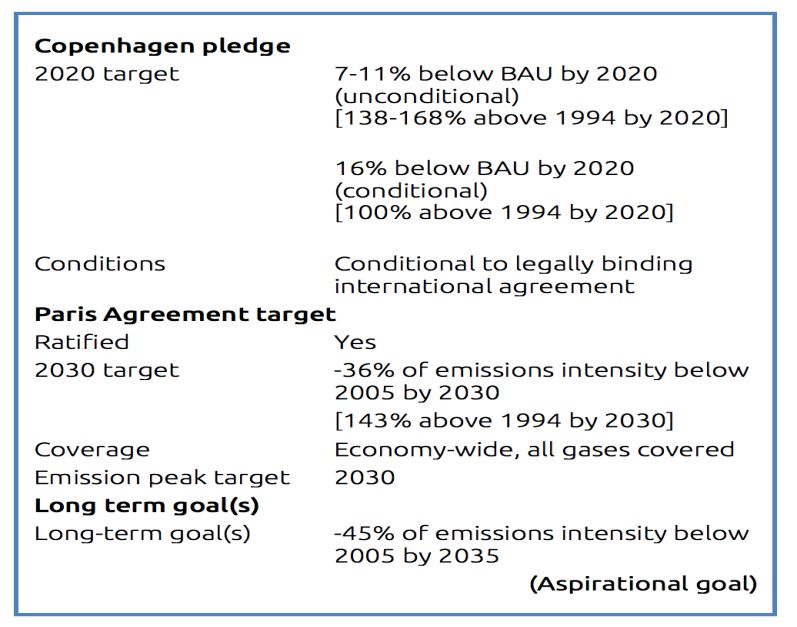
Konrad-Adenauer-Stiftung e. V.
Regional Project Energy Security and Climate Change Asia-Pacific (RECAP)                   May 2019   6
                                                                                                 6

It is under the promotion of competitive markets strategy that market-based
instruments (carbon taxes) have been considered with the decision to introduce
them made in the 2017 Budget (C6-C10) (see Section 2).

1.2. Trends in energy demand and supply

Following a business as usual scenario (BAU)4 with the purpose of outlining likely
energy futures, Singapore’s energy trends are as follows (APERC 2016, Vol. II: 282):

› In the buildings and industry sectors, a continued efficiency improvement due to
  programmes in place;
› In the domestic transport sector, a continued expansion of light rail (MRT) and
  discouraged growth of private vehicles;
› In the energy supply mix, a continued increase of oil and gas imports and
  increase in global LNG to end the 100% reliance on piped gas;
› In the power mix (electricity), a discontinuation of coal, deployment of limited PV,
  increasing trends in waste-to-energy (WtE), and no nuclear;
› In the overall access to renewable energy (RE), WtE (from incineration) will
  remain the main RE fuel together with a PV penetration of 600 megawatts peak
  demand (MWp);
› In ensuring energy security, the requirement of having 60 days-worth of fuel
  reserves to be held by generation companies (gencos) remains;
› Finally, with regards climate mitigation, policymakers’ thinking is that there is
  limited room for reducing CO2 emissions due to the city’s heavy dependence on
  imported fossil fuel energy because of the absence of local resources.

The limitation of the BAU is that it assumes a continuation of current energy
demand and supply trends, does not factor-in improved efficiency, high
renewables, or a diverse fuel mix (electricity generation) other than a high reliance
on gas.

Demand

According to APERC 2016, following the same BAU, the overall trend is that TFED is
set to increase by 15% (from 20Mtoe in 2013 to 23Mtoe in 2040) with the non-
energy sector (oil refineries) being the major contributor. The industry and
buildings share of TFED will also increase while in the transport sector it will
decrease due to a strong policy of discouraging private vehicular ownership.

In the building sector, energy demand will grow from 24Mtoe (2013) to 30Mtoe
(2040) due to factors such as population growth, rising living standards and
consequential use of more appliances and electronic devices, and GDP growth.
Commercial buildings take the bulk of the demand (74%) while the share of

4
 BAU is defined here as one where current policies and trends will continue (APECR 2016,
Vol. II: 1). The Singapore’s Government definition of BAU may be different.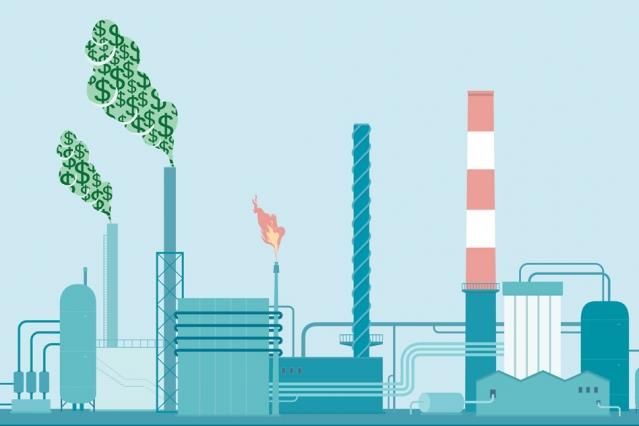
Konrad-Adenauer-Stiftung e. V.
Regional Project Energy Security and Climate Change Asia-Pacific (RECAP)                  May 2019   7
                                                                                                7

residential demand will decrease by about the same percentage. The fuel mix in
buildings will see a decrease in the share of electricity due to fuel efficiency and an
increase of gas that accounts to 95.5% of the power mix. Several legislative
instruments will continue to contribute to greater energy efficiency in buildings:
Building Control Regulation 2008; Building Control Act 2012; Building Control
Regulation 2013 (setting Green Mark Standards for new builds and retrofits with
regards energy efficiency, water efficiency; environmental protection; indoor
environmental quality; and others).

In the industrial manufacturing sector (chemical, petrochemical, shipbuilding,
biomedical, electronics), there will also be an increase in energy demand from
about 5.9Mtoe in 2013 to about 7.6Mtoe in 2040. This growth is attributed to an
improvement in the sector’s energy intensity from 17toe per USD million in 2013 to
15toe5 per USD million in 2040 (APERC 2016: 284). Energy efficiency in this sector is
currently supported by government policies such as: Energy Efficiency National
Partnership (EENP); Energy Efficiency Improvement Assistance Scheme (EASe), and
Grant for Energy Efficient Technologies (GREET) for SMEs. Since 2013, the
government has required all industrial companies consuming 54TJ6/yr of energy or
more to comply with the Mandatory Energy Management Requirements (MEMR).
The chemicals and petrochemicals industry are the single largest industrial
manufacturing consumers that will experience an increase in energy demand from
2.2Mtoe in 2013 to 3Mtoe in 2040. This is reflective of Singapore’s very stable
industry structure. Energy demand in all industrial manufacturing (pharma,
biotech, electronics, environment and water) will also see growth from 3.6Mtoe to
4.5Mtoe during the same period (ibid.).

In the domestic transport sector energy demand is projected to decline from
roughly 3Mtoe in 2013 to 2.6Mtoe in 2040. This is the result of several government
initiatives like decreasing the role of private vehicles and light-duty vehicles, and
increasing the millage of light rail (MRT). But energy sources stay steady with oil
seeing a slight decrease in the domestic transport demand (from 2.5Mtoe to
2.1Mtoe), electricity increasing slightly from 0.2Mtoe to 0.42Mtoe as the MRT
expands, and gas experiencing a small share taken mainly by a fuel switch (to
liquefied petroleum gas- LPG) in light-duty vehicles (ibid.).

Supply

Total energy imports are expected to increase from 73Mtoe in 2013 to 101Mtoe in
2040. Oil share (64Mtoe) is expected to remain steady till 2040. Gas shares are
expected to rise from 8.9Mtoe to 12Mtoe (APERC 2016).

5
    toe: tonnes of oil equivalent
6
    TJ: terajoules
Konrad-Adenauer-Stiftung e. V.
Regional Project Energy Security and Climate Change Asia-Pacific (RECAP) May 2019 8
8
Oil imports delivered via tankers navigating in protected sea lanes will be derived
from an increasingly large pool of countries to ensure energy security. These will
continue to be intended for the export market as refined products will remain a
significant source of revenue.
Gas imports, on the other hand, are intended for domestic consumption, mainly, in
the power generation sector where gas accounts for 95.5% of the power mix (EMA
2015a). These are projected to increase from 8.9Mtoe in 2013 to 12Mtoe in 2040
(APERC 2016).Konrad-Adenauer-Stiftung e. V.
Regional Project Energy Security and Climate Change Asia-Pacific (RECAP) May 2019 9
9
1.3. Singapore’s Nationally Determined Contributions (NDCs)
Providing the driving force to the EPG and the NER 2007 mentioned above are the
NDCs. In 2016, the city pledged to reduce energy emissions intensity by 36% from
2005 levels by 20307 and to stabilise its carbon emissions to 65MtCO2e8 at current
rates by 2030. Although Singapore is one of the least carbon-intensive economies
ranking 123 out of 140 countries (if embodied GHG of imported goods, shipping
and aviation are excluded), its per capita emissions ranks 26 out of 142. This means
an increase of 143% from 1994 emissions level (Climate Action Tracker: Singapore).
Climate Action Tracker rates Singapore’s 2020 (Copenhagen 2009) and 2030 (Paris
2015) pledged targets as ‘highly insufficient’. Saying: ‘The “Highly insufficient” rating
indicates that Singapore’s climate commitment in 2017 is not consistent with
holding warming below 2°C, let alone limiting it to 1.5°C as required under the
Paris Agreement, and is instead consistent with warming between 3°C and 4°C. If
all countries were to follow Singapore’s approach, warming could reach over 3°C
and up to 4°C. This means Singapore’s climate commitment is not in line with any
interpretation of a “fair” approach to the former 2°C goal, let alone the Paris
Agreement’s 1.5°C limit. If [we] were to rate Singapore’s projected emissions levels
in 2017 under current policies, Singapore would also be rated “Highly insufficient”’
(Climate Action Tracker: Singapore).
Table 1: Singapore’s Climate Commitments (Source: Climate Tracker 2016)
7
The St. Petersburg Declaration (2012) introduced an aggregate energy emissions intensity
aspirational goal for all APEC economies of -45% from 2005 levels by 2035.
8
MtCO2e million tonnes of carbon dioxide equivalentKonrad-Adenauer-Stiftung e. V.
Regional Project Energy Security and Climate Change Asia-Pacific (RECAP) May 2019 10
10
It is important to note too that, despite Singapore’s five-prone strategy approach to
emissions, reduction targets are mostly to be met by energy efficiency (EE)
measures in various sectors under the Energy Conservation Act implemented since
2013 (Chapter 92C, latest amendment 2014; See also KAS RECAP policy paper n. 2
Francesch-Huidobro 2017). The Act mandates energy management requirements
for large emitters: Part III domestic & industrial; Part IV transport sector (Singapore
Statues Online 2014).
1.4. Singapore’s GHG Emissions
Although it is difficult to access Singapore’s GHG emissions data (sources included
and methodologies greatly vary between International Energy Agency (IEA), US
National Energy Information Administration, Carbon Dioxide Information Analysis
Centre, official communications of Singapore to the UNFCCC, etc), the per capita
emissions in Singapore are about 8.5 tonnes CO2 (ranking 26th highest out of 142
countries) which accounts for 0.11% of global emissions (UNFCCC 2015; Climate
Action Plan p. 6, Singapore’s GHG Emissions Profile (primary & secondary
emissions).
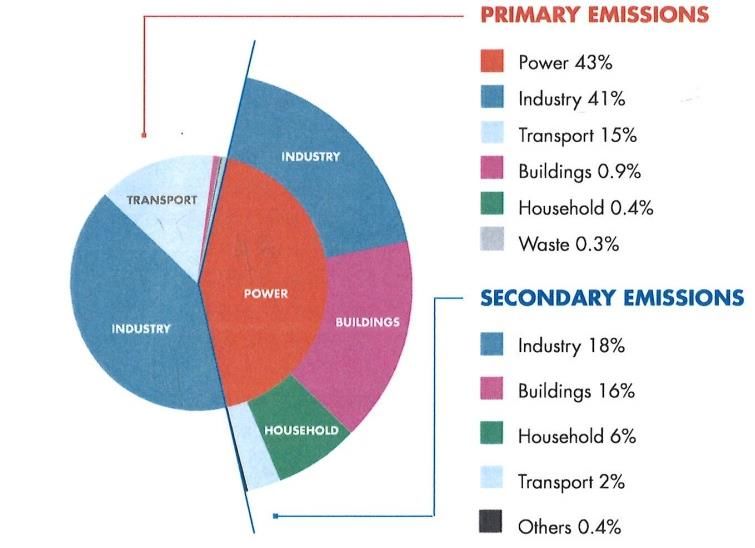
The share of direct emissions per sector and the indirect emissions for each
sector’s electricity usage is: (NCCS 2016: 6 (data of 2012)
Primary emissions:
Power 43%
Industry 41%
Transport 15%
Buildings 0.9%
Household 0.4%
Waste 0.3%
Secondary emissions (from electricity use):
Industry 18%
Buildings 16%
Household 6%
Transport 2%
Others 0.4%Konrad-Adenauer-Stiftung e. V.
Regional Project Energy Security and Climate Change Asia-Pacific (RECAP) May 2019 11
11
Figure 1: Singapore Emissions Profile 2012 (Source: NCCS 2016: 6)
When combined, they represent the total GHG emission by sector (i.e. industry
59%). Total emissions were 49MtCO2e (2012).
With limited possibility of increasing RE and the unsuitable development of civil
nuclear within its 719 Km2 land area Singapore is totally dependent on fossil fuels.
According to APERC’s Energy Outlook 2016 (p. 292), ‘total energy related CO2
emissions under the BAU will grow by 14% from 43MtCO2e (2013) to 53MtCO2e
(2040).9
1.5. Singapore’s carbon footprint (embodied carbon in imported goods)
As an economically open city-state, Singapore’s accounting of emissions and
calculation of its carbon footprint10 is challenging. Shall direct emissions from
activities on the territory be counted only? (i.e. domestic sales of locally-
manufactured products) or should emissions emanating from upstream activities
(indirect) be included (i.e. import of fuels for power generation) or even the export
of these indirect emissions? (i.e. import of refined oils)
9
Singapore government anticipates emissions will peak in 2035 to 65MtCO2-e
10
Carbon footprint is the total GHG emitted by individuals, events, and products expressed
in carbon dioxide equivalent.Konrad-Adenauer-Stiftung e. V.
Regional Project Energy Security and Climate Change Asia-Pacific (RECAP) May 2019 12
12
Figure 2: CO2 Emissions with and without Marine Bunkers (million tonnes)
(Source: Doshi 2015: 124)
Figure 3: CO2 Emissions with and without Jet Fuels (tonnes per capita) (Source:
Doshi 2015: 147).
In Schulz’ (2010) accounting, the volume of indirect emissions was high (80MtCO2e
to 130MtCO2e between 1995 and 2005), with Singapore reporting to the UNFCCC
26.5MtCO2e in 1994 (ibid. p. 4851). Indirect GHG emissions embodied in productsKonrad-Adenauer-Stiftung e. V.
Regional Project Energy Security and Climate Change Asia-Pacific (RECAP) May 2019 13
13
traded in Singapore, exceeded direct emissions by a factor of 4-5 (between 25Mt
and 325 MtGHGe11 (ibid. p. 4851). Exports of indirect emissions were generally
lower but in a similar order of magnitude between 3-4 times the direct emissions
(ibid. p. 4853).
These findings (summary Table 2 Schulz 2010: 4852) ‘are important in assessing the
usefulness of using an urban scale emissions account and its value in identifying
the most effective climate mitigation potential if only direct emissions are
accounted for’.
Singapore’s paradox is that its compact structure and well-planned and regulated
transport system, results in its per capita energy use and emissions being low (as
mentioned). But the actual direct emissions data varies greatly per source and is
quite high due to its international trade volume (shipping and aviation) and to the
international bunkers involved (shipping bunker and aviation fuel) although bunker
oils are a separate category according IMO and its accounting should not be
allocated to individual countries (email communication NEA to CCA).
2. The Carbon Tax
› Where do carbon taxes fit in the context of these economic and energy policy
trends, in trends in energy demand and supply, in Singapore’s NDCs, in GHG
emissions and in its carbon footprint?
› Why the choice of market-based instruments at this point? How do these differ
from traditional command and control regulation?
2.1. The 2017 Budget on Carbon Tax and the 2019 Implementation
In February, Budget 2017 announced:
‘Singapore has joined more than 130 countries, including China, Japan and
South Korea, in having ratified the Paris Agreement, re-affirming our
commitment to address climate change and reduce emissions. It is in our own
interest to support the international coordination required to deal with an
issue that affects all countries, and in particular, small-island states like ours
(C.6).
There are different ways to reduce emissions. One is to ensure consumers
understand the effects of their actions. So we have energy efficiency labels,
11
Million tonnes greenhouse gas equivalentKonrad-Adenauer-Stiftung e. V.
Regional Project Energy Security and Climate Change Asia-Pacific (RECAP) May 2019 14
14
like ticks on air-conditioners or refrigerators. Another is to regulate for higher
standards. Singapore has good environmental protection standards and
the Ministry of the Environment and Water Resources continues to ensure that
our regulations are up-to-date. But the most economically efficient and
fair way to reduce greenhouse gas emissions is to set a carbon tax, so
that emitters will take the necessary actions (C.7).
Singapore has studied this option for several years. We intend to implement
a carbon tax on the emission of greenhouse gases. We will consult widely
with stakeholders, and aim to implement the carbon tax from 2019. The tax
will generally be applied upstream, for example, on power stations and other
large direct emitters, rather than electricity users (C.8).
We are looking at a tax rate of between S$10 and S$20 per tonne of
greenhouse gas emissions.12 This is in the range of what other jurisdictions
have implemented. It will create a price signal to incentivize industries to
reduce their emissions, complementing the regulatory measures which we are
also introducing. It will help us to achieve our commitments to reduce
emissions under the Paris Agreement, do so efficiently and at as low a cost to
the economy as possible. This may also spur the creation of new opportunities
in green growth industries such as clean energy. Revenue from the carbon tax
will help to fund measures by industries to reduce emissions. The impact of
the carbon tax on most businesses and households should be modest (C.9).
The Government has started industry consultations and will continue to
reach out. Public consultations will begin in March. The final carbon tax and
exact implementation schedule will be decided after our consultations and
further studies. We will take into consideration the lessons from other
countries and prevailing economic conditions in Singapore in
implementation. We will also provide appropriate measures to ease the
transition’ (MOF Budget 2017: Moving Forward Together, C.10).
A carbon tax at a rate of between S$10-20 per tonne of GHG13 will be equivalent to
a rise in electricity price between 0.43-0.86 cents KWh or S$2.1-4.3 from an
average of S$72/month (per 4 bedroom household) to S$76/month. The
carbon tax is mainly targeting between 20-30 power stations that will be
required to begin paying taxes by 2019. It is linked to the Paris Agreement ratified
in 2016 as the ‘most economically efficient and fair way’ to mitigate emissions
(National Climate Change Secretariat (NCCS). The Singapore government
anticipates the co-benefit of carbon taxes to be in the form of promoting clean
energy growth as revenue collected will help fund measures by industries to
reduce emissions (NCCS).
12
As the Carbon Pricing Act 2018 (CPA) was enforced on 1 January 2019, the tax per tCO2e
was set as at the lower price of S$5 for the period 2019-2023. A review of the scheme is
intended in 2023 by when the tax will likely increase by 2030 to S$10 to S$15tCO2e (NEA
https://www.nea.gov.sg/our-services/climate-change-energy-efficiency/climate-
change/carbon-tax).
13
See footnote 11 above.Konrad-Adenauer-Stiftung e. V.
Regional Project Energy Security and Climate Change Asia-Pacific (RECAP) May 2019 15
15
Singapore's Climate Action Plan (2016) sets out four strategies to achieve its pledge:
› Improving energy efficiency;
› Reducing carbon emissions from power generation;
› Developing and deploying cutting-edge low-carbon technologies; and
› Encouraging collective action among government agencies, individuals,
businesses, and the community.
NCCS affirmed that with regards emissions reduction: ‘A carbon tax will enhance
Singapore's existing and planned mitigation efforts under our Climate Action Plan,
and stimulate clean technology and market innovation. A tax on greenhouse gas
(GHG) emissions will incentivize emitters to factor in the costs of their GHG
emissions in their business decisions. This would encourage companies to improve
their energy efficiency and innovate to reduce their GHG emissions’ (NCCS 2016:
25).
Who will be covered?
The carbon tax will be applied upstream, for example, on power stations and other
large direct emitters. For stationary emissions, the government is looking at a
proposed threshold of 25,000 tCO2e of greenhouse gas (GHG) emissions annually.14
This is equivalent to emissions produced by the annual electricity consumption of
12,500 Housing Development Board (HDB) 4-room households. Based on current
data, there are around 30-40 of such large direct emitters (NCCS FAQ online).
What GHG will be covered?
The six greenhouse gases that will be covered under the carbon tax are: carbon
dioxide (CO2), methane (CH4), nitrous oxide (N2O), hydrofluorocarbons (HFCs),
perfluorocarbons (PFCs), and sulphur hexafluoride (SF6) (ibid.).
What is the expected impact on business: economic efficiency and fairness?
The increase in operating cost from S$10-20/tCO2e15 carbon tax is equivalent to
US$3.5-7.0/barrels (bbl) increase in crude oil prices. This represents a 6.4% to
12.7% increase from current oil prices (2016), compared to historical quarterly oil
price fluctuations which have ranged from -29% to +35% from 2011 to 2016.
Companies will receive greater government support for industrial energy efficiency.
14
But any industrial facility that emits direct GHG equal to or above 2,000 tCO2e annually
will be required to be registered as a reportable facility and to submit an Emissions Report
annually.
15
See footnote 11 above.Konrad-Adenauer-Stiftung e. V.
Regional Project Energy Security and Climate Change Asia-Pacific (RECAP) May 2019 16
16
Possible forms of support include more information about energy efficiency
improvement opportunities, enhancing existing energy efficiency incentives, and
providing capability-building for companies to put in place better energy
management systems. The government is also studying different modes of
assistance to help businesses with the transition. Views from companies and the
public were sought via industry consultations and public consultations which began
in March and were completed in May 2017 (ibid.) (see also NCCS, Public
Consultations, Annex).
How will it be operationalised?
Given the fact that the National Environment Agency (NEA) is communicating with
industry regarding carbon taxes, these will be operationally linked to the
promotion of energy conservation and efficiency which are NEA’s core tasks via the
Energy Efficiency Programme Office (E2PO), a multi-agency committee lead by NEA
in collaboration with Energy Market Authority (EMA).
Two new tools will be supporting the deployment of carbon taxes:
› Energy Efficiency Opportunities Assessment (EEOA) by which any company using
more that 54TJ of energy will have to be assessed by 2021. Companies using
more that 500TJ will be assessed every 6 years, while those using between 54
and 500TJ will be assessed every 3 years. Companies are to appoint energy
assessors. EEOA Assessors’ role would be to identify energy efficiency
opportunities, recommend energy efficiency opportunities, and prepare
assessment reports at ISO50002 standards. Assessors will have to be certified
yearly according to a given criteria16.
› Measures Report Verification System (MRVS)17. MRVS applies to all industrial
sector firms with emissions of more than 25,000tCO2e per year. There are two
elements of MRVS:
a) Monitoring Plan (MP) that discloses how a firm calculates (computation)
its GHG emissions and the methodology it uses, and;
b) Emission Report (ER) that summarises the company’s emissions
including comments from third-party verification which should be audit
firms and/or certification companies with a lead auditor certified to
16
See assessors verification and accreditation guidelines here https://www.nea.gov.sg/our-
services/climate-change-energy-efficiency/climate-change/carbon-tax/verification-and-
accreditation-requirements
17
Measuring and Reporting requirements guidelines: https://www.nea.gov.sg/our-
services/climate-change-energy-efficiency/climate-change/carbon-tax/measurement-and-
reporting-requirements-for-greenhouse-gas-emissionsKonrad-Adenauer-Stiftung e. V.
Regional Project Energy Security and Climate Change Asia-Pacific (RECAP) May 2019 17
17
ISO14065 standards. ER will require each firm to appoint a GHG manager
that must be in-house.
The National Energy Policy 2007 and the Climate Action Plan make explicit
connections between the introduction of taxes, the encouragement of energy
efficiency, and the low carbon economy (cleaner production and consumption)
(Figure 4).Konrad-Adenauer-Stiftung e. V.
Regional Project Energy Security and Climate Change Asia-Pacific (RECAP) May 2019 18
18
Figure 4. Carbon Taxes and Singapore’s Climate Action Plan (Source: NCCS
2016).
2.2. What are the advantages/disadvantages of market-based
instrument versus command and control tools?
Carbon taxes use government regulation determining its deployment and market
signals linking the value of goods and services to their ‘true’ cost, including
externalities18. They have the following advantages (Doshi 2015: 173-178):
› Correct market failure leading to economic efficiency as GHG emissions are an
unpriced externality;
› Allow flexibility for firms to determine how to best achieve reduction targets
depending how much it will cost them;
› Raise revenue by definition;
› Establish a carbon price creating market incentives to reduce emissions by
developing and investing in cleaner technologies;
18
The cost or benefit that affects a party that did not choose to incur such cost or benefit.Konrad-Adenauer-Stiftung e. V.
Regional Project Energy Security and Climate Change Asia-Pacific (RECAP) May 2019 19
19
› Exemptions/surcharges can have the effect of further mitigating undesirable
social or economic behaviour in consumption and production patterns.
But taxes also have potential disadvantages:
› Taxes fix the price of carbon but allow emissions’ levels to vary. Reduction of
GHG emissions cannot be pre-determined as may be the case with cap-and-
trade which fixes emissions reduction and allows costs to be determined by
market;
› If fiscal regimes vary greatly with the government of the day, taxes become a
very unpredictable tool in curbing emissions. In the case of Singapore, given the
political continuity provided by its one-party-dominant system, taxes are ‘safe’;
› The compliance flexibility for firms is not very high: a firm needs to yearly budget
how much to mitigate and how much to pay in taxes;
› Tax law and tax administration can be slow in responding to rapid economic
conditions and may become obsolete, as such;
› Although taxes are relatively simple to administer there can be strong lobbies
calling for exemptions (but not the case in Singapore, as of now).
On the other hand, the advantage of using government regulation (i.e. permits,
prohibitions, standards, enforcements, etc) is that desired actions can be
prescribed to achieve a specific objective in case of serious environmental impact
(i.e. handling of radioactive waste). Regulation also has the advantage of being
simple to administer (i.e. by setting technical installation standards of abatement
that do not require regular measurement and monitoring).
The disadvantage of using regulation that applies across the board is that it
increases costs for firms with high mitigation costs that have to make the same
reduction as those with low mitigation costs. As information about such costs is
very difficult to obtain by governments, the result is the unfair application of rules
without differentiating their effects on those to whom they apply. This can have
unintended consequences like dissuading foreign investors and adding cost of
living to citizens.
3. Conclusion & Recommendations
Singapore’s strategic location between the Indian and Pacific Oceans has made it a
leading financial, transport, and oil trading centre. It now also aspires to be an LNG
hub. Trends suggest that its economy will continue to grow in the foreseeable
future. The city will continue to be dependent of imported fuels and room for more
RE penetration will remain limited. Nuclear is, for now, out of the question. Energy
demand will continue to be much lower than supply given that much of what is
supplied is exported as refined products. This poses questions about the city’sKonrad-Adenauer-Stiftung e. V.
Regional Project Energy Security and Climate Change Asia-Pacific (RECAP) May 2019 20
20
calculation of its GHG emissions and setting of reduction targets. GHG emissions
will continue to grow but eventually stabilised.
Energy policy has been institutionalised across government in the form of the
Energy Policy Group and the national strategy announced in 2007 (Energy for
Growth: National Energy Report – NER). The NER included the deployment of
market-based instruments and, thus, carbon taxes have been deployed from 2019.
Carbon taxes are being explicitly linked to the key reduction strategy of energy
efficiency which, up to now, has been driven by strong government regulation with
its potential high costs and unintended social consequences.
With no room to ‘improve’ the fuel mix in electricity generation, EE will remain the
main stay of any carbon reduction future but will be less reliant on government
regulation by pricing carbon through the deployment of carbon taxes. These are
intended to internalise environmental externalities. In a one-party political system,
the support from the industry in up-taking carbon taxes is almost guaranteed given
the predictability of the fiscal regime, tax laws and tax administration. Yet, high
emitters may find reductions too burdensome and economically difficult to bear.
This policy analysis is intended as a contribution to ongoing debates on energy
security and climate change mitigation in Asia-Pacific. Besides facilitating
collaboration between industry, governments and citizens, the analysis can help
raise awareness through dialogue and policy analysis to:
› Ensure that levels of carbon taxes are comparable to international experience
and that they drive companies to set up reduction targets;
› Make companies aware that their reduction targets are contributing to
Singapore’s NDCs;
› Continue to monitor the International Maritime Organization (IMO)19 and the
International Civil Aviation Organization (ICAO)20 emissions reduction
developments;
› Engage the Singapore government on the question of embedded emissions;
› Persuade publicly listed companies to share their Emissions Report (ER) via the
Singapore Exchange (SGEX) to encourage constructive benchmarking and public
scrutiny;
19
In 2011, IMO adopted mandatory technical and operational energy efficiency measures
which are expected to reduce the amount of CO2 emissions from international
shipping. These mandatory measures (EEDI/SEEMP) entered into force on 1 January 2013. In
2012, international shipping was estimated to have contributed about 2.2% to the global
emissions of carbon dioxide (CO2). Further improvement of its energy efficiency and
effective emission control is needed as sea transport will continue growing apace with world
trade
(http://www.imo.org/en/OurWork/Environment/PollutionPrevention/AirPollution/Pages/Defa
ult.aspx
20
ICAO adopted new emissions standards for aircraft
https://www.icao.int/Newsroom/Pages/ICAO-Council-adopts-new-CO2-emissions-standard-
for-aircraft.aspxKonrad-Adenauer-Stiftung e. V.
Regional Project Energy Security and Climate Change Asia-Pacific (RECAP) May 2019 21
21
› Consider how carbon taxes can be supplemented by other instruments such as
allowing high emitters for whom reductions will be too costly to offset their
emissions by purchasing internationally accredited carbon credits;
› Take account of results of the industry and public consultations 20 Mar to 20 Apr
207 regarding the proposed carbon taxes.Konrad-Adenauer-Stiftung e. V.
Regional Project Energy Security and Climate Change Asia-Pacific (RECAP) May 2019 22
22
References
› Asia Pacific Energy Research Centre (APERC). 2016. APEC Energy Demand and
Supply Outlook 6th Edition. Vol. II Economic Reviews: Singapore, pp. 279-292. Tokyo:
Asia Pacific Research Centre
› Climate Action Tracker. 2016. Singapore.
http://climateactiontracker.org/countries/singapore.html
› Doshi, T. 2015. Singapore in a Post-Kyoto World. Singapore: Institute of Southeast
Asian Studies
› Schulz, N. 2010. Delving into carbon footprints of Singapore- comparing direct
and indirect greenhouse gas emissions of a small and open economic system.
Energy Policy, 38, 4848-4855.
› Singapore Department of Statistics. 2017. http://www.singstat.gov.sg/
› World Bank Data.2015. Singapore.
https://data.worldbank.org/indicator/NY.GDP.MKTP.PP.CD?locations=SG
Policy Documents
› Sustainable Singapore Blueprint. 2015. (MEWR and MND). Secure, Competitive,
Sustainable Energy pp. 51-52. Building Resilience to Climate Change pp. 73-74.
› Climate Action Plan: Take Action Today For a Carbon Efficient Singapore. 2016.
(NCCS- PMO).
› Energy for Growth: National Energy Policy Report. 2007. Energy Policy Group
(MTI, MOF, MFA, MTransport, BCA, EDB, EMA, NEA, LTA).
› Budget 2017: Moving Forward Together, C.6-C10 (MOF)
http://www.mof.gov.sg/news-reader/articleid/1786/parentId/59/year/2017
› National Climate Change Secretariat, Strategy Group Prime Minister’s Office.
Frequently Asked Questions
http://www.ifaq.gov.sg/NCCS/apps/fcd_faqmain.aspx#TOPIC_11696
Agencies
› International Energy Agency (IEA) – Paris http://www.iea.org/
› Asia Pacific Energy Research Centre (APERC) – Tokyo http://aperc.ieej.or.jp/
› Building and Construction Authority (BCA) – statutory body- building standards
and regulations
› Economic Development Board (EDB) – statutory body- global operations and
corporate development
› Energy Market Authority (EMA) – statutory body- regulator
› Inter-ministerial Committee on Climate Change (IMCCC) (Resilience, International
Negotiations, Long Term Emissions and Mitigation Working Groups - develops
Singapore climate pledges
› Land Transport Authority (LTA) – statutory body- planning design, building and
maintenance of land transport
› Ministry of Environment and Water Resources (MEWR) – environmental
protection and water securityKonrad-Adenauer-Stiftung e. V.
Regional Project Energy Security and Climate Change Asia-Pacific (RECAP) May 2019 23
23
› Ministry of Finance (MOF) – fiscal policy
› Ministry of Foreign Affairs (MFA) – international relations/negotiations
› Ministry of Trade and Industry, Energy Division (MTI) – industry and trade
development
› Ministry of Transport (MOT) – mobility
› National Climate Change Secretariat- Prime Minister’s Office (NCCS-PMO)
› National Environment Agency (NEA) – statutory body - promotion of energy
efficiency (E2PO)
› Public Utilities Board (PUB)- gas & water policy
Energy Efficiency Government Schemes (Climate Action Plan 2016: 14)
Capacity Building
› Singapore Certified Energy Manager (SCEM)
› Energy Conservation Act (ECA) Chapter 92C
› Carbon Pricing Act 2018 (CPA)
› Energy Efficiency National Partnership Programme (EENP)
Financing
› EE Financing Pilot Programme
Incentives
› Resource-Efficient Design S$600,000 per project (cap)
› Energy Audits co-funded by NEA S$200,000 per project (cap)
› Retrofit Projects for energy efficient equipment and technologies, 20% co-
funded by EDB and NEA
› Grants and tax deductions under Accelerated Depreciation Allowance Scheme
(ADAS)
› Investment Allowance – Energy Efficiency Scheme (IA)Konrad-Adenauer-Stiftung e. V.
Regional Project Energy Security and Climate Change Asia-Pacific (RECAP) May 2019 24
24
Konrad-Adenauer-Stiftung e. V.
Dr. Peter Hefele
Director
Regional Project Energy Security and Climate Change Asia-Pacific (RECAP)
www.kas.de/recap
peter.hefele@kas.de
The text of this publication is published under a
Creative Commons license: “Creative Commons
Attribution- Share Alike 4.0 international” (CC BY-SA 4.0),
https://creativecommons.org/licenses/by-sa/4.0/legalcode www.kas.de/You can also read