Influence of Solar Wind on Secondary Cosmic Rays and Atmospheric Electricity - Frontiers
←
→
Page content transcription
If your browser does not render page correctly, please read the page content below
ORIGINAL RESEARCH
                                                                                                                                                   published: 16 July 2021
                                                                                                                                           doi: 10.3389/feart.2021.671801

                                            Influence of Solar Wind on Secondary
                                            Cosmic Rays and Atmospheric
                                            Electricity
                                            Jaroslav Chum 1*, Marek Kollárik 2, Ivana Kolmašová 1,3, Ronald Langer 2, Jan Rusz 1,
                                            Dana Saxonbergová 1 and Igor Strhárský 2
                                            1
                                              Institute of Atmospheric Physics of the Czech Academy of Sciences, Prague, Czech Republic, 2Institute of Experimental Physics,
                                            Slovak Academy of Sciences, Košice, Slovakia, 3Faculty of Mathematics and Physics, Charles University, Prague, Czech Republic

                                            A relationship between the heliospheric magnetic field, atmospheric electric field, lightning
                                            activity, and secondary cosmic rays measured on the high mount of Lomnický Štít
                                            (2,634 m a.s.l.), Slovakia, during the declining phase of the solar cycle 24 is
                                            investigated with a focus on variations related to solar rotation (about 27 days). The
                                            secondary cosmic rays are detected using a neutron monitor and the detector system
                                            SEVAN, which distinguishes between different particles and energies. Using spectral
                                            analysis, we found distinct ∼27-day periodicities in variations of Bx and By components of
                                            the heliospheric magnetic field and in pressure-corrected measurements of secondary
                           Edited by:
                                            cosmic rays. The 27-day variations of secondary cosmic rays, on average, advanced and
         Irina Alexandrovna Mironova,       lagged the variations of Bx and By components by about 40° and −140°, respectively.
    Saint Petersburg State University,      Distinct 27-day periodicities were found both in the neutron monitor and the SEVAN upper
                               Russia
                                            and middle detector measurements. A nondominant periodicity of ∼27 days was also
                      Reviewed by:
                Hripsime Mkrtchyan,         found for lightning activity. A cross-spectral analysis between fluctuation of the lightning
     Alikhanyan National Laboratory,        activity and fluctuation of the heliospheric magnetic field (HMF) showed that fluctuation of
                             Armenia
                   Mirela Voiculescu,
                                            the lightning activity was in phase and in antiphase with Bx and By components of the HMF,
 Dunarea de Jos University, Romania         respectively, which is in agreement with previous studies investigating the influence of solar
                  *Correspondence:          activity on lightning. On the other hand, the ∼27-day periodicity was not significant in the
                      Jaroslav Chum         atmospheric electric field measured in Slovakia and Czechia. Therefore, no substantial
                    jachu@ufa.cas.cz
                                            influence of Bx and By on the atmospheric electric field was observed at these middle-
                    Specialty section:      latitude stations.
         This article was submitted to
                Atmospheric Science,        Keywords: cosmic rays, heliospheric magnetic field, solar wind, atmospheric electric field, lightning
               a section of the journal
            Frontiers in Earth Science
                                            INTRODUCTION
        Received: 24 February 2021
          Accepted: 21 June 2021            It is well known that the heliospheric magnetic field (HMF) influences the intensity of cosmic rays
           Published: 16 July 2021
                                            (CRs) entering the Earth’s atmosphere (Usoskin et al., 1998; Owens and Forsyth, 2013). Primary
                             Citation:      (galactic) cosmic rays consist of high-energy particles, mainly protons with energies of ∼GeV and
    Chum J, Kollárik M, Kolmašová I,       higher that interact with the Earth’s atmosphere, creating a shower of different species of charged
  Langer R, Rusz J, Saxonbergová D
   and Strhárský I (2021) Influence of
   Solar Wind on Secondary Cosmic           Abbreviations: CR, cosmic rays; CSD, cross-spectral density; EFM, electric field mill; GSE, geocentric solar ecliptic (coordinate
    Rays and Atmospheric Electricity.       system); HCS, heliospheric current sheet; HMF, heliospheric magnetic field; LS, Lomnický Štít; NM, neutron monitor; PG,
          Front. Earth Sci. 9:671801.       potential gradient; PSD, power spectral density; SCR, secondary cosmic rays; SW, solar wind; WWLLN, World Wide Lightning
     doi: 10.3389/feart.2021.671801         Location Network; WT, wavelet transform.

Frontiers in Earth Science | www.frontiersin.org                                     1                                               July 2021 | Volume 9 | Article 671801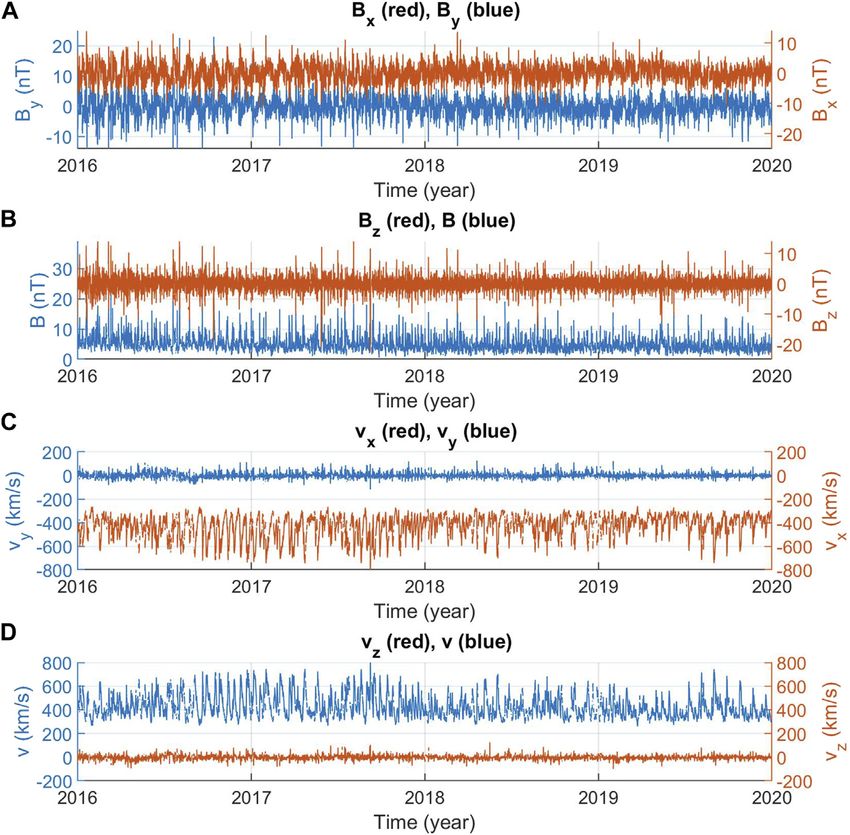
Chum et al.                                                                                                         Solar Wind and Earth’s Atmosphere

particles, neutrons, and gamma ray photons. These showers, also              dawn–dusk component By and the sunward component Bx of
called secondary cosmic rays (SCRs), are usually measured using              the HMF changes from away from the Sun (Bx < 0 and By > 0) to
neutron monitors (NMs). The count rates measured using NMs                   toward the Sun (Bx > 0 and By < 0), exhibiting one cycle during
depend not only on the intensity of CRs but also on the strength             one solar rotation; the geocentric solar ecliptic (GSE) coordinate
and orientation of the geomagnetic field and the altitude of the              system is considered here. Interestingly, a dependence of the
measuring site. Therefore, many NMs are located at high latitudes            atmospheric pressure and atmospheric electric field on the
or high altitudes where the so-called cutoff rigidity is lower, which        polarity of By was found in the polar regions, mainly in the
means that larger count rates are measured as particles with lower           winter Antarctic when the air was relatively isolated from the rest
momentum can reach such sites (Shea and Smart, 2000; López-                  of the world (Mansurov et al., 1974; Burns et al., 2008; Lam and
Comazzi and Blanco, 2020). It was found that the intensity of CRs            Tinsley, 2016). It is assumed that the pressure dependence on By
is anticorrelated with solar activity, exhibiting about 11-year cycle        results from an external electric field that is superposed at high
variations (Usoskin et al., 1998). The lower the solar activity, the         latitudes on the internal electric field, which is maintained by
higher the intensity of CRs that is observed because more galactic           thunderclouds in the atmospheric global electric circuit (Rycroft
CRs penetrate the heliosphere and reach the Earth. Voiculescu                et al., 2000). The external electric field occurs because of the
and Usoskin (2012) and Voiculescu et al. (2013) showed using                 relative motion and the interaction of the solar wind (SW) with
statistical studies that solar activity and the HMF might impact             the Earth’s magnetosphere, and its value in the SW sensed in the
cloud cover in specific regions on long timescales. Variations of             Earth frame (GSE coordinates) is given by the vector product E
CRs in the Earth’s atmosphere are important from many aspects                -v x B, where v is the speed of the SW and B is the HMF,
which are as follows: a possible link between climate and intensity          respectively. The component of the external electric field parallel
of CRs via potential influence of CRs on cloud condensation                   with the   Earth’s axis is then Ez  −(vx By − vy Bx ) ≈ − vx By as
nuclei (Kristjánsson et al., 2008; Kirkby 2008; Svensmark et al.,            |vx | >> vy . The relative fluctuations of By are much larger than
2009; Gray et al., 2010), the dominant role of CRs in the                    the relative fluctuations of vx; consequently, Ez is mainly
production rate of isotope 14C used for dating (e.g., Gosse and              controlled by By (Lam and Tinsley, 2016). The Ez component
Klein, 2015), modulation of doses received by humans and                     is directed along the Earth’s axis and does not change during the
electronics on board aircrafts (Yang and Sheu, 2020), and                    Earth’s rotation if By is constant (Lam and Tinsley, 2016). A
possible influence on seed electrons for lightning initiation                 dominant component of the external electric field perpendicular
(Dwyer and Uman, 2014).                                                      to the Earth’s axis is the dawn–dusk component Ey  −(vz Bx −
    Periodicities or quasiperiodicities shorter than the 11-year             vx Bz ) ≈ vx Bz which exhibits 1-day periodicity due to the Earth’s
period of the solar cycle were also identified in the CR                      rotation. The Ez component, controlled by By, dominates in the
intensity. For example, Kudela et al. (2002), Kudela et al.                  polar regions. It maps along the Earth’s magnetic field lines to the
(2010), and Chowdhury and Kudela (2018) focused on periods                   ionosphere and contributes to the total potential difference
longer than the solar rotation and studied Rieger-type                       between the ionosphere and the Earth at high latitudes (Burns
fluctuations around ∼154 days and quasiperiodicities around                   et al., 2008). The mechanism by which the atmospheric pressure
∼1.3, 1.7, and 2.25 years. The intensity of these periodicities              is influenced by this external electric field is, however, unknown.
usually varied during the solar cycle, and their origin is still             It is hypothesized that an increase in the atmospheric vertical
under debate (Bazilevskaya et al., 2014). The Rieger-type                    current that is associated with the increase in the potential
fluctuations (∼154 days) mainly occur around the solar                        difference between the ionosphere and the Earth’s surface
maximum and were first investigated by Rieger et al. (1984).                  influences the cloud microphysics, especially at cloud
On the other hand, Saad Farid (2019) and López-Comazzi and                   boundaries. This might result in different growths of
Blanco (2020) also analyzed shorter periods such as the period of            condensation nuclei and hence in different radiation
solar rotation (∼27 days) and its harmonics (mainly ∼13.5 days)              properties (opaqueness) of clouds or release of latent heat
besides the quasiperiodicities around 130 days and the Rieger-               (Nicoll and Harrison, 2009; Gray et al., 2010; Lam and
type fluctuations and quasiperiodicities in the range of                      Tinsley, 2016). No direct dependence of atmospheric pressure
250–470 days.                                                                and the electric field on By has been observed at middle or low
    The period of solar rotation (∼27 days), which is the main               latitudes. Variations of the electric field associated with global
focus of this study, arises from the tilt of the solar magnetic dipole       thunderstorm activity, local weather, cloud electrification, and
with respect to the rotation axis, coronal-hole high-speed streams,          changes of air conductivity owing to fluctuations of aerosol
and corotating interaction regions characterized by the                      concentration dominate here. However, several studies have
interaction of fast and slow solar wind (Gosling and Pizzo,                  discussed how lightning occurrence over Great Britain and
1999; Grieder, 2001; López-Comazzi and Blanco, 2020). The                    Japan likely depends on the By polarity and the solar rotation
much weaker fluctuations at the period of ∼13.5 days might be                 period (Owens et al., 2014; Owens et al., 2015; Miyahara et al.,
just the second harmonics; however, the presence of the                      2018).
heliospheric current sheet (HCS) that separates oppositely                       This study presents measurements of SCRs taken using an NM
oriented field lines of the HMF and occurs two times during                   and the Space Environment Viewing and Analysis Network
the solar rotation (Owens and Forsyth, 2013) might also                      (SEVAN) located at the mountain peak of Lomnický Štít (LS)
contribute to the observed fluctuations of SCRs at ∼13.5 days.                in the High Tatras, Slovakia, and their comparison with SW and
In an ideal Parker spiral (Parker, 1958), the polarity of the                HMF data and nearby measurements of the atmospheric electric

Frontiers in Earth Science | www.frontiersin.org                         2                                        July 2021 | Volume 9 | Article 671801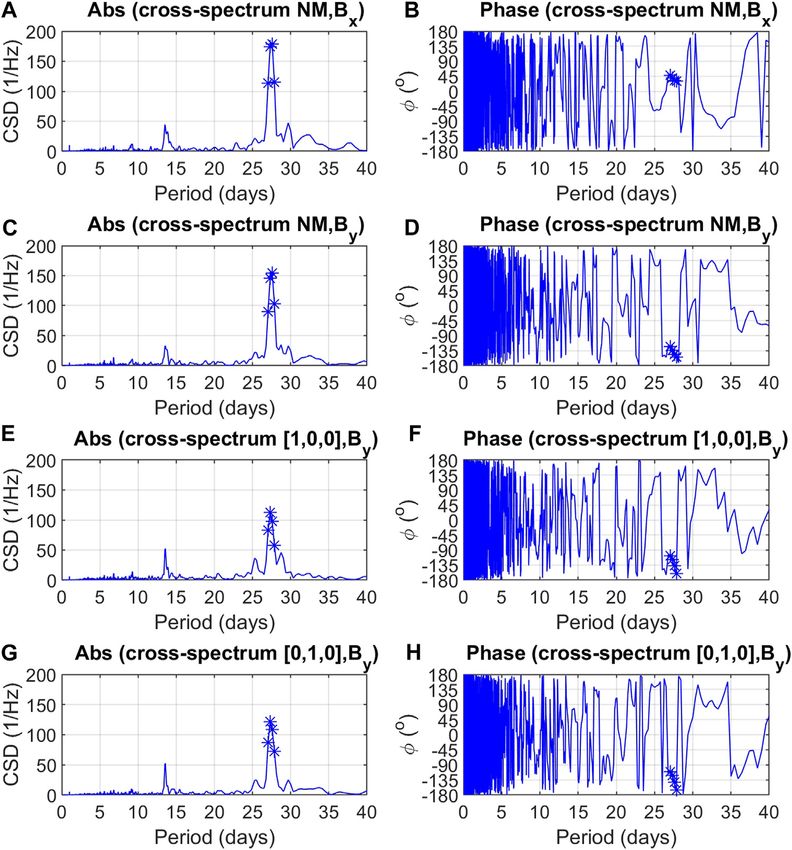
Chum et al.                                                                                                         Solar Wind and Earth’s Atmosphere

field. The aim is to search for similarities in these data series,             summer to prevent damage to its rotor due to the frequent ice
especially similarities related to the period of solar rotation, and to       coverage in winter. Therefore, the data of the electric field
discuss a potential influence of the HMF and SCRs on                           measured in Czechia at the stations of Panská Ves (50.527°N,
atmospheric electricity.                                                      14.568°E, altitude 318 m) and Studenec (50.258°N, 12.518°E,
                                                                              altitude 666 m) are also provided for completeness and
                                                                              comparison. These stations are the closest available stations
MEASUREMENT SETUP                                                             providing electric field data at a similar latitude and are part
                                                                              of a global atmospheric electricity monitoring network (Nicoll
The near-Earth components of the SW velocity (vx, vy, and vz)                 et al., 2019). More precisely, the electric field data are given as
and the Bx, By, and Bz components of the HMF used in this study               potential gradient (PG), which means that positive values
were downloaded from NASA/GSFC’s Space Physics Data                           correspond to the downward pointing electric field (electrons
Facility’s OMNIWeb service (https://omniweb.gsfc.nasa.gov/).                  are accelerated upward). All the EFM 100 sensors used are
   The SCRs are measured using two different types of detectors               installed in inverted positions to minimize precipitation noise.
located on the peak of LS (49.195°N, 20.213°E) at the altitude of                 To evaluate lightning activity, we used data provided by the
2,634 m. The first is an NM installed on the top of LS in 1981. It is          World Wide Lightning Location Network (WWLLN), which
of the NM-64 type and consists of eight SNM-15 counting tubes                 operates about 70 sensors in the frequency range from 3 to
with a length of 200 cm and a diameter of 15 cm, filled with BF3               30 kHz (Rodger at al., 2004). Localization of individual
(Kudela and Langer, 2009). The NM at LS is a part of the global               discharges is based on the detection of sferics, impulsive
neutron monitor, which means that the data are included in the                signals radiated by lightning and propagating in a waveguide
Neutron Monitor Database (NMDB). Cutoff rigidity of the NM at                 formed by the Earth’s surface and the bottom of the ionosphere.
LS is 3.84 GV. The second is the SEVAN system, which has three                The WWLLN provides the exact times and locations of the
separated plastic scintillators as detectors (Chilingarian et al.,            detected lightning together with their estimated energy, energy
2018). The upper and lower scintillators have the dimensions                  error, and number of the stations used for the estimation of the
100 × 100 × 5 cm and are separated from the middle scintillator               relevant locations and energies. In this study, we used lightning
by 4.5-cm-thick and 100 × 100 cm–wide lead absorbers. The                     detections which occurred between latitudes 48° and 51°N and
middle detector is composed of five plastic slabs and has the                  longitudes 11° and 23°E. This region roughly covers the area of
dimensions 50 × 50 × 25 cm. The upper detector—channel 1—is                   Czechia and Slovakia. The detection efficiency of the WWLLN
mainly sensitive to low-energy charged particles, mainly                      did not change during the analyzed period.
electrons, and partly also to gamma rays (Chilingarian et al.,
2018). The estimated energy threshold, considering the roof
above the detector, is 7–8 MeV (Kudela et al., 2017). The                     METHODS
middle scintillator—channel 2—mainly detects neutrons or
high-energy gamma photons. It might be partly sensitive to                    To investigate the influence of the SW and the HMF on SCRs and
electrons with energies of several tens of MeV. The lower                     the atmospheric electric field, we search for similar fluctuations in
detector—channel 3—registers high-energy charged particles,                   the HMF, SW, SCRs, and atmospheric electric field by performing
mainly muons with energies exceeding ∼250 MeV. Besides the                    spectral analysis, namely, Fourier transform and wavelet
count rates in individual channels, different combinations of all             transform (WT). Because various quantities have different
three channels are also evaluated. Specific combinations can be                absolute values and units, it is useful to work with normalized
used to identify the type of incident particles. For example,                 unitless quantities. All the quantities are therefore normalized by
combinations [1,0,0], [0,1,0], and [1,1,1] mean that a particle               applying Eq 1 before performing the spectral analysis as follows:
was registered only in channel 1, only in channel 2, and in all
channels simultaneously, respectively. The combination [1,0,0] is                                             a − mean(a)
                                                                                                    anorm                ,                        (1)
mainly used for detection of electrons or positrons (partly also                                                   σa
photons) with energies around ∼10 MeV. On the other hand, the
combination [0,1,0] provides information about detection of                   where a is the analyzed quantity (components of SW velocity,
neutrons, and the [1,1,1] combination provides information                    components of the HMF, counts measured by the NM and the
about the detection of high-energy (>250 MeV) charged                         SEVAN, and the PG), and σ a is the standard deviation of the
particles, mainly muons (Chilingarian and Reymers, 2008;                      distribution of the quantity a. The normalization allows for an
Chilingarian et al., 2021).                                                   easy comparison of fluctuations and the spectral content of
   The electric field is measured on LS using an electric field mill            various quantities.
EFM 100 sensor made by the Boltek company (Kudela et al.,                        All the data are available with 1-min resolution. It is necessary
2017). Relatively large values of the electric field are measured on           to consider that the data might contain outliers. For example,
the top of LS as it is a sharp, rocky mountain peak (Kudela et al.,           enhancements of SCRs related to the large atmospheric electric
2017; Chum et al., 2020). It should be noted that the mountain of             field were observed during thunderstorms (Kudela et al., 2017;
LS represents a relatively conductive material, relative to the               Chum et al., 2020). The extreme values are therefore first removed
ambient air, and therefore locally enhances the intensity of the              from the 1-min data before the application of Eq 1. The extreme
electric field. The EFM 100 at LS is in operation only during                  values or outliers were removed following the approach taken by

Frontiers in Earth Science | www.frontiersin.org                          3                                       July 2021 | Volume 9 | Article 671801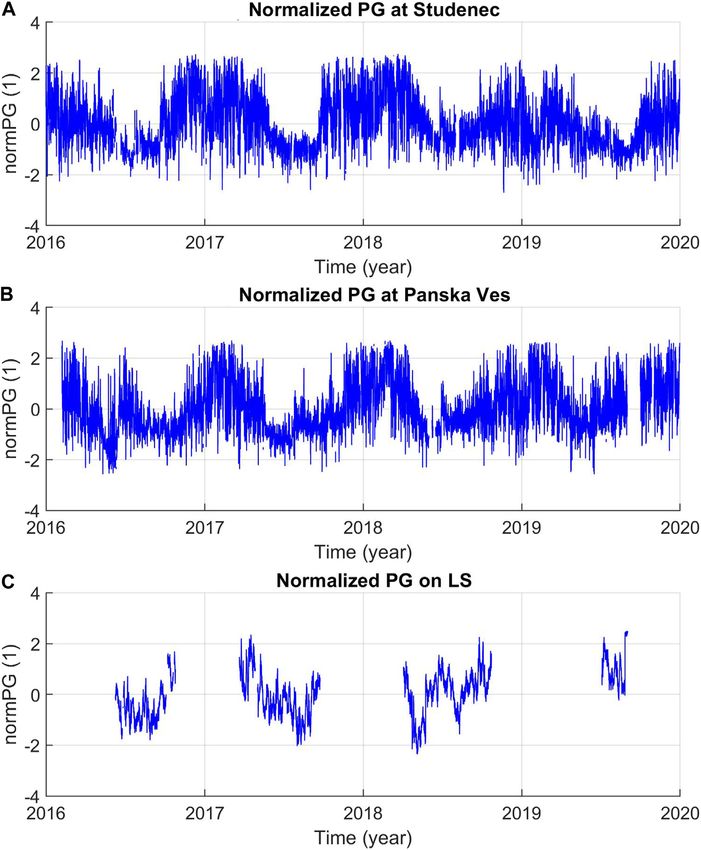
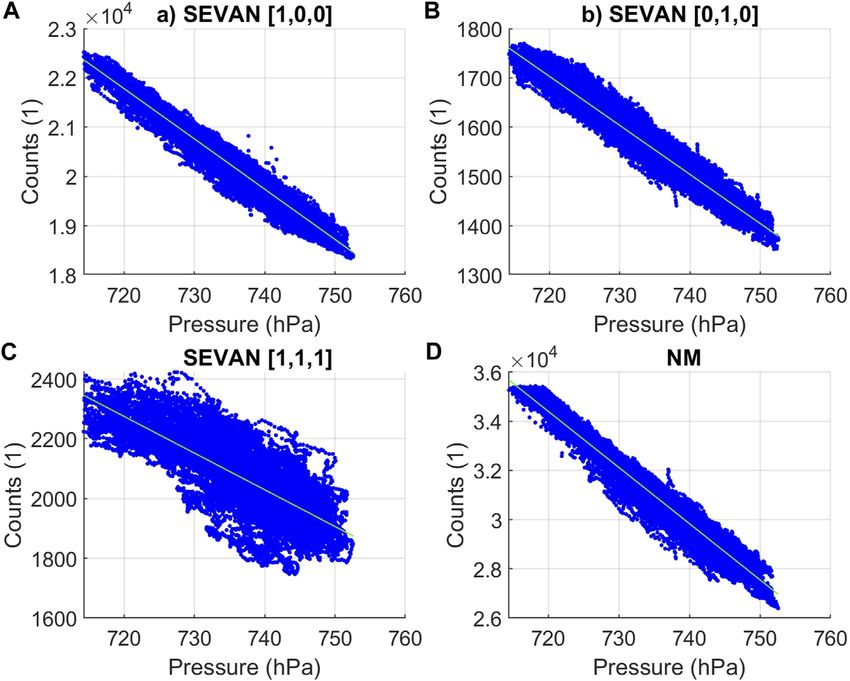
Chum et al.                                                                                                                        Solar Wind and Earth’s Atmosphere

  FIGURE 1 | Scatterplots between measured counts (2-h mean values of 1-min data) and atmospheric pressure on LS. Green lines indicate linear regressions. (A)
  SEVAN [1,0,0] combination, (B) SEVAN [0,1,0] combination, (C) SEVAN [1,1,1] combination, and (D) NM.

López-Comazzi and Blanco (2020). It means that all the values                         that periodicities of fog or aerosol concentrations would follow
lying outside the range [Q1-1.5(Q3-Q1), Q3+1.5(Q3-Q1)] were                           the periodicities of solar rotation. Moreover, we found that we
considered outliers, where Q1 and Q3 are the first quartile and                        obtained a similar Carnegie curve for the Panská Ves station to
the third quartile, respectively. The extreme values were removed                     that obtained in the study by Nicoll et al. (2019), who used
for all the data, except the lightning counts in the considered area                  another, stricter proxy for fair-weather data.
(48–51°N, 11–23°E). To reduce data volume and to speed up the                            We chose the period from 2016 to 2019 for the study as for this
data processing, we computed 2-h mean values from the original                        period, all the data of interest are available for most of the time.
1-min data. It should be noted that we are interested in                                 The measured values of SCRs depend on atmospheric
fluctuations in the order of days. As the 2-h mean values act                          pressure, as is documented in Figure 1A–D, which shows
as a low-pass filter with a cutoff period of 2 h, the 2-h mean values                  scatterplots between the counts recorded in SEVAN channel 1
were calculated with a 1-h step to fulfill the sampling theorem                        ([1,0,0] combination), channel 2 ([0,1,0] combination),
(sampling frequency should be at least twice the highest                              combination [1,1,1], and in the NM. To remove the pressure
frequency in the signal). The mean values were only calculated                        influence on the measured values of SCRs, the counts were first
if more than 50% of the data were available in the given 2-h                          corrected on pressure using the linear relationships displayed in
intervals. Otherwise, the values were substituted by linear                           the individual plots in Figure 1 by green lines. Actually, the
interpolation before the spectral analysis.                                           relationship between the counts and atmospheric pressure is
   It should also be noted that only a rough proxy for fair-weather                   expected to be exponential. However, the scatterplots indicate
electric field data is obtained by removing extreme values from                        that linear correction does not introduce a substantial error in the
PG data using the method mentioned in the previous paragraph.                         observed range of pressure variations. Obviously, the counts for
The PG data might be influenced by the presence of moderately                          combination [1,1,1] (Figure 1C) exhibit the most complicated
charged clouds, fog, or aerosols that significantly change the air                     fluctuations and pressure correction is the least effective. The
conductivity and hence the PG. However, this approach can be                          residual counts, obtained by subtracting the linear regression
justified as we are interested in the spectral content of the PG                       curves (green lines) from the measured counts, are used for
signal, rather than in absolute values. It is necessary to have as few                spectral analysis after their normalization using Eq 1.
data gaps as possible for spectral analysis. The main aim is to                          In addition to Fourier and wavelet transform, cross-spectral
search for periodicities related to solar rotation, and it is unlikely                analysis is performed for the quantities that exhibit similar

Frontiers in Earth Science | www.frontiersin.org                                  4                                              July 2021 | Volume 9 | Article 671801
Chum et al. Solar Wind and Earth’s Atmosphere
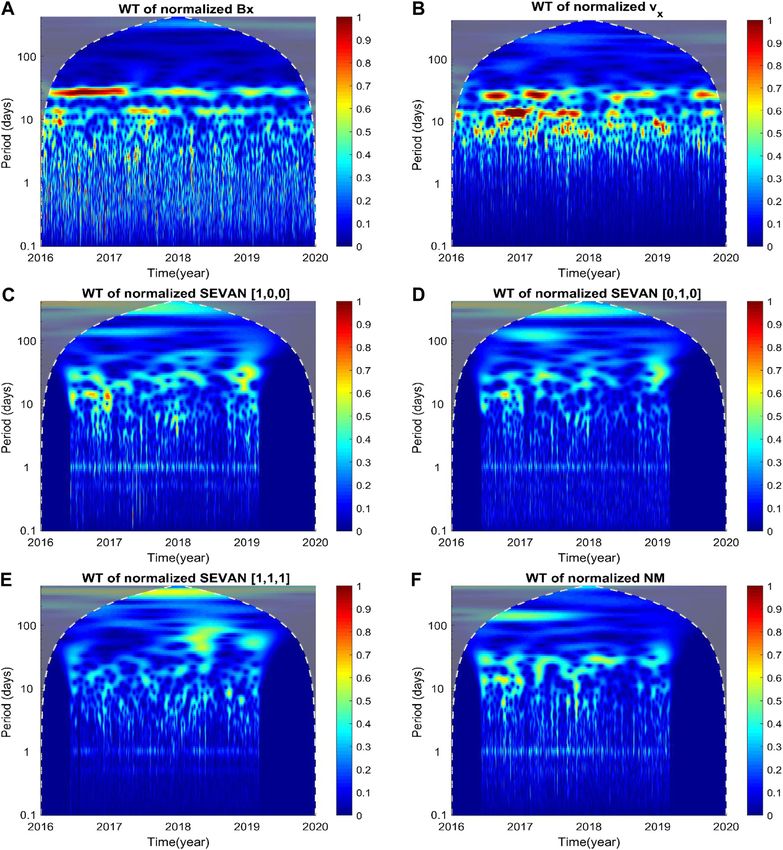
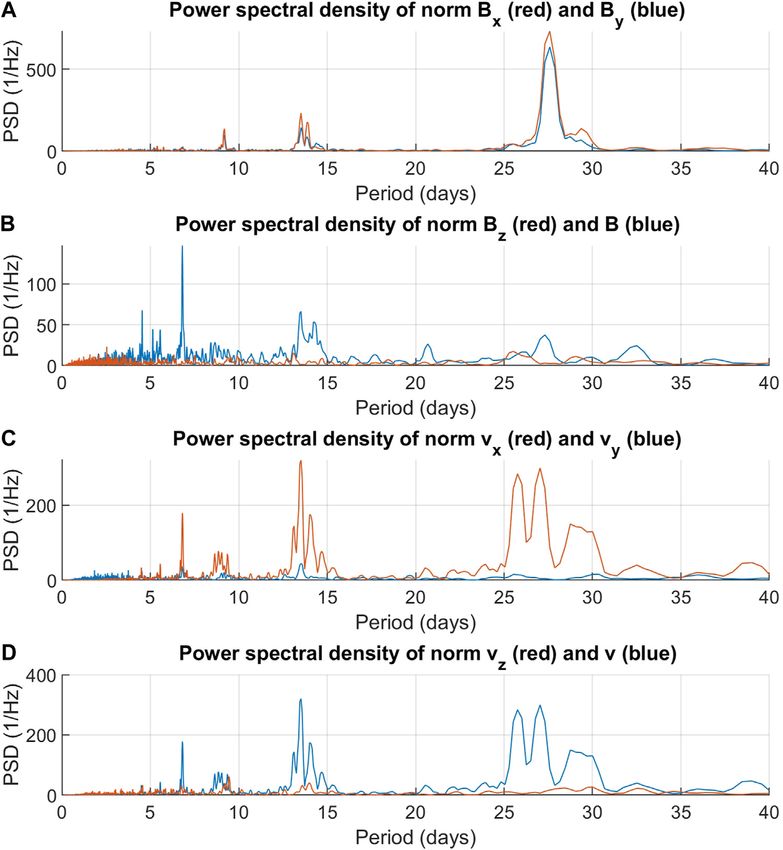
FIGURE 2 | Components of the HMF (A, B) and components of SW velocity (C, D) in GSE coordinates.
spectra, namely, a distinct peak around the period of solar RESULTS
rotation. The cross-spectra make it possible to investigate a
phase relation between quantities of interest. For example, Heliospheric Parameters and Cosmic Rays
cross-spectral densities (CSDs) for normalized pressure- Figure 2A,B shows the components of the HMF, together with its
corrected NM counts NNM and the normalized Bx component absolute value B, and the components of SW velocity
of the HMF are calculated using relation Eq. 2 as follows: (Figure 2C,D), including its absolute value v, for the years
2016–2019 in GSE coordinates. The Bx and By components
CSD(ω) NNM (ω) · Bpx (ω) have similar amplitudes and are mostly anticorrelated, which
is an expected situation for the Parker spiral (Owens and Forsyth,
NNM (ω) · Bx (ω) · ei[φNM (ω)−φBx (ω)] , (2)
2013). The dominant component of the SW velocity is the vx
component (Figures 2C, D). The mean value of vx in the GSE
where NNM (ω) is the Fourier transform of the normalized coordinates calculated over the displayed period of time is
residual NM counts, Bpx (ω) is the complex conjugate of the –425 km/s. The negative sign means that the SW velocity is
Fourier transform of the normalized Bx component of the directed from the Sun to the Earth. Figure 3 shows the power
HMF, and i2 -1. The phase shift ϕ(ω) between the two spectral densities (PSDs) of the normalized components of the
signals at a given frequency is then obtained as follows: HMF and SW velocity (normalized quantities of those displayed
in Figure 2). The PSDs are displayed as a function of the period,
ϕ(ω) φNM (ω) − φBx (ω). (3) rather than of the frequency. Only periods up to 40 days are
presented. Figure 3A shows that the PSDs of Bx and By have a
The NM counts advance the Bx variations for positive ϕ(ω) and distinct peak around the period of 27.5 days. Both peaks have
vice versa. similar values, and the peak for Bx (red) is only slightly larger than
Frontiers in Earth Science | www.frontiersin.org 5 July 2021 | Volume 9 | Article 671801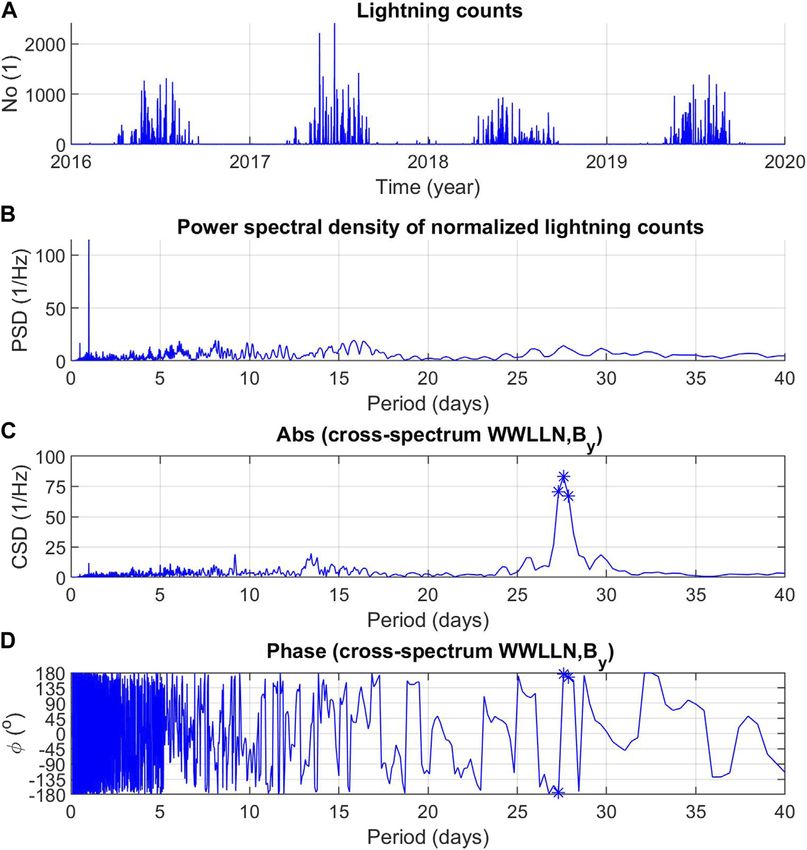
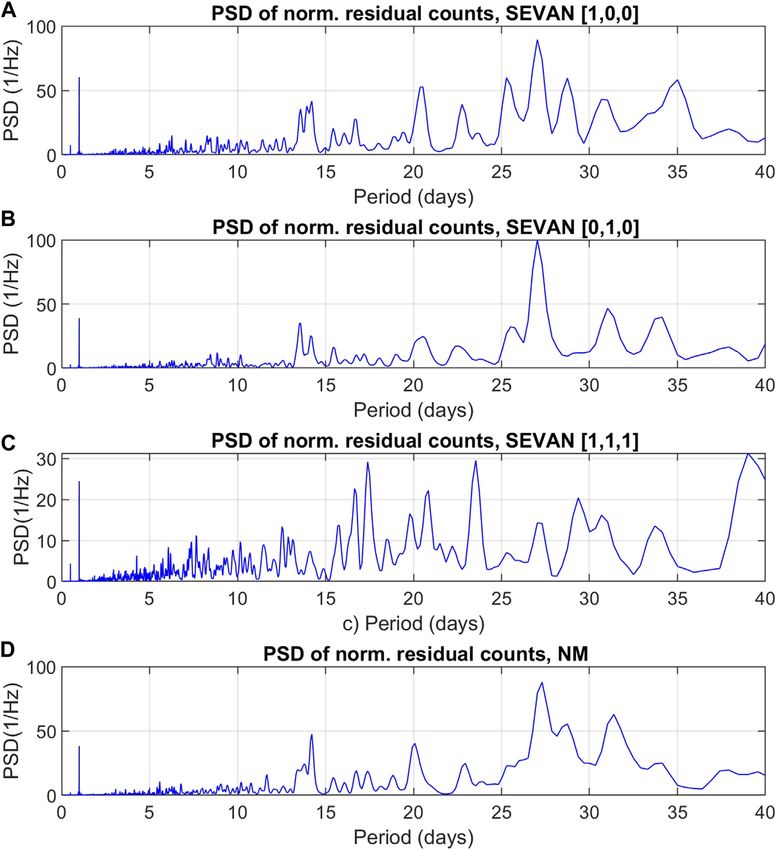
Chum et al.                                                                                                            Solar Wind and Earth’s Atmosphere

  FIGURE 3 | Power spectral densities (PSD) of normalized components of the HMF (A, B) and velocity of SW (C, D).

that for By (blue). Figure 3B demonstrates that no significant                      electronics of the SEVAN were made. After this interval, many
peak around the period of solar rotation (∼27 days) was observed                   data gaps and discontinuities in SEVAN data occurred. Figure 5
for the Bz component. Figure 3C shows that the PSD of the vx                       presents the PSD of the normalized counts that are displayed in
component of SW velocity has two distinct peaks associated with                    Figure 4. The PSD of SEVAN [1,0,0] and [0,1,0] combinations
solar rotation, namely, at the periods of 25.7 and 27 days. A likely               and the PSD of NM counts exhibit remarkable peaks at the period
explanation for these two peaks is a differential rotation of the                  of solar rotation, around 27 days. However, no such distinct peak
Sun (Owens and Forsyth, 2013). SW originating from coronal                         was observed for the SEVAN [1,1,1] combination (Figure 5C)
holes around the solar pole exhibits a period of around 25 days,                   that detects high-energy charged particles (muons). A likely
whereas SW arriving from the equatorial regions of the Sun is                      explanation for that is that the HMF and SW are not able to
characterized by a period of around 27 days. Obviously, the                        sufficiently modulate the CR particles of high energies that are
periodicity of vx propagates into the periodicity of the absolute                  responsible for muon production because of the large gyro-radii
value of SW velocity v (Figure 3D).                                                of high-energy particles. There is a relatively good similarity
   Figure 4 shows time fluctuations of the normalized pressure-                     between the spectra obtained for the Bx and By components of the
corrected counts recorded in SEVAN channel 1 ([1,0,0]                              HMF and the PSD obtained for the SEVAN [0,1,0] combination
combination), channel 2 ([0,1,0] combination), combination                         and NM counts. Both these detectors are mainly sensitive to
[1,1,1], and in the NM. To ensure homogeneity of the data,                         neutral particles, the SEVAN [0,1,0] combination being also
only counts from June 10, 2016 to April 15, 2019 are used for the                  partly sensitive to high-energy gamma rays. A partial
analysis. Before this selected interval, changes in the acquisition                similarity with the PSD of Bx and By is also observed for the

Frontiers in Earth Science | www.frontiersin.org                               6                                     July 2021 | Volume 9 | Article 671801
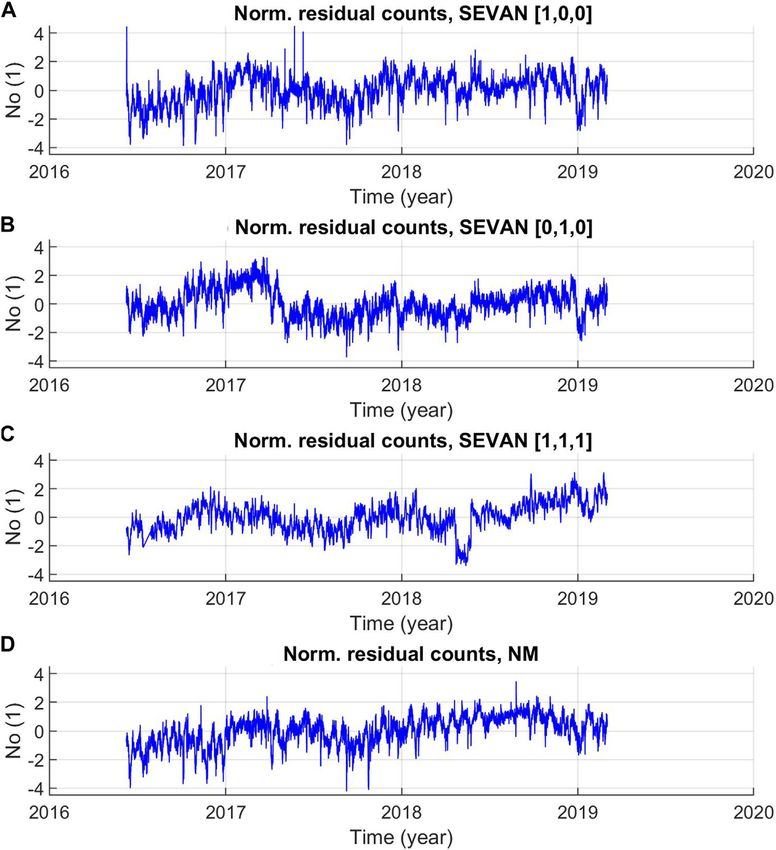
Chum et al.                                                                                                          Solar Wind and Earth’s Atmosphere

  FIGURE 4 | Normalized pressure-corrected counts observed using the SEVAN (A, B, C) and an NM (D) on LS.

SEVAN [1,0,0] combination, sensitive to low-energy charged                      resolution of the WT is not sufficient to distinguish the periods of
particles (approximately above 7 MeV), electrons and                            25.7 and ∼27 days observed in Figure 3C. Figures 6C, D, F show
positrons. A partial detection of gamma rays cannot be excluded.                that the fluctuations of SCRs measured using the SEVAN [1,0,0]
   It is useful to investigate the time evolution of the spectra.               and [0,1,0] combinations and the NM exhibit relatively broad
Figure 6A–F presents the wavelet transform of the normalized                    peaks around the period of ∼27 days. These peaks are more or less
Bx, vx, and normalized counts recorded using the SEVAN [1,0,0],                 randomly distributed during the analyzed period of time.
[0,1,0], and [1,1,1] combinations and the NM, respectively. The                 Intervals with relatively high intensities (distinct peaks) are
peak around the period of ∼27 days in the WT of Bx is most                      followed by intervals with lower intensities. Therefore, it is
distinct in 2016 and in the beginning of 2017, which corresponds                likely that the fluctuations of SCRs are also modulated by
to the declining phase of the solar cycle 24. A second harmonic,                other mechanisms besides the HMF and SW velocity. The
∼13.5 days, is also clearly visible in the WT of Bx. The time                   exact origin of these mechanisms is unknown. We note that
evolution of the second harmonic, however, does not follow the                  the counts were corrected to the local ambient pressure. However,
intensity observed at the period of ∼27 days. An almost identical               we cannot exclude that a pressure or temperature profile in the
result was obtained for the WT of By (not shown). Periods of ∼27                atmosphere above the SEVAN and the NM could modulate the
and ∼13.5 days can also be clearly identified in the WT of                       recorded counts (Riádigos et al., 2020). A potential influence of
normalized vx. Intensities observed at the periods of ∼27 and                   some other, unconsidered parameters of the solar and
∼13.5 days are comparable, which can also be seen in the PSD                    geomagnetic activity and of the atmospheric state can also not
displayed in Figure 3C. It should be noted that a frequency                     be excluded.

Frontiers in Earth Science | www.frontiersin.org                            7                                      July 2021 | Volume 9 | Article 671801
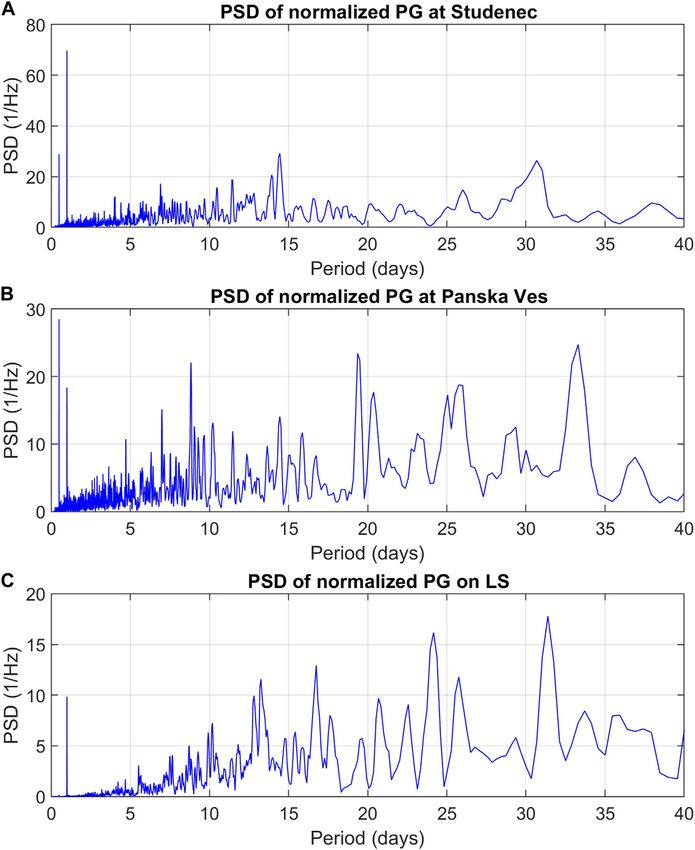
Chum et al.                                                                                                                Solar Wind and Earth’s Atmosphere

  FIGURE 5 | Power spectral densities (PSD) of normalized pressure-corrected counts measured using the SEVAN (A, B, C) and an NM (D) on LS.

Atmospheric Electric Field                                                       considered middle-latitude stations. However, a local,
Figure 7 presents the normalized PG recorded at Studenec,                        nondominant peak at the period of around ∼25.7 days
Panská Ves, and LS. As mentioned in the Introduction,                            corresponding to solar rotation at high solar latitudes was
measurements on LS were not performed in winter to prevent                       found in the PSD for all three stations. It should be
damage from icing on the rotor of the EFM 100 sensor. It can                     remembered that a peak at this period was also observed in
be noticed that a higher PG was usually observed in winter than                  the PSD of vx. However, the spectra of vx and the PG do not
in summer. Large concentrations of aerosols and/or fogs                          exhibit similarities at other periods.
during winter inversions is a likely reason for the relatively                      The PSD of PG data measured in Panská Ves and Studenec
large PG in winter. A seasonal dependence of the PG also                         also exhibits sharp peaks at the periods of ∼0.5 and 1 day. It
makes it difficult to analyze a potential influence of the By                      means that the Carnegie curve has two peaks (Nicoll et al., 2019).
polarity on the PG using anything other than spectral                            Interestingly, the PSD of PG data recorded in Panská Ves (partly
methods. Figure 8 shows the PSD of the normalized PG that                        also in Studenec) has a peak at the period of 7 days. It could
is displayed in Figure 7. Figure 8 demonstrates that no significant               possibly indicate a weekend reduction of industrial aerosol
peak around the period of solar equatorial rotation (∼27 days)                   concentrations (Silva et al., 2014) as Panská Ves lies the
was observed in the PG data. Therefore, unlike the studies in                    closest to urban areas of all these three stations. A detailed
polar regions (Burns et al., 2008; Lam and Tinsley, 2016), no                    analysis of this phenomenon is outside the scope of the
influence of the By polarity on the PG was observed at the                        present study.

Frontiers in Earth Science | www.frontiersin.org                             8                                           July 2021 | Volume 9 | Article 671801
Chum et al.                                                                                                                  Solar Wind and Earth’s Atmosphere

  FIGURE 6 | Wavelet transform of (A) Bx component of the HMF, (B) vx component of SW velocity, and (C–F) normalized pressure-corrected counts measured
  using SEVAN combinations [1,0,0], [0,1,0], and [1,1,1] and the NM, respectively, on LS.

Phase Relations and Lightning Activity                                             Figures 9A, B show the absolute value and the phase of the CSD,
As we have found a relatively good correspondence between the                      respectively. The phase difference between the NM and Bx counts
power spectral density peaks at the period of ∼27 days for Bx and                  fluctuates around 40° at the period of ∼27 days, which clearly
By and for the SCR counts corresponding to the low-energy                          dominates in the cross-spectrum. In other words, the count
charged particles and neutrons measured using the SEVAN                            variations observed using the NM advance the variations of
[1,0,0] and [0,1,0] combinations, respectively, and for the NM                     the near-Earth Bx component of the HMF at the period of
counts (compare Figure 3A with Figures 5A, B, D), it is useful to                  ∼27 days by approximately 3 days. Very similar results were
investigate phase relations (time delays) between these variables                  obtained for cross-spectral analyses of the SEVAN [1,0,0] and
around the period of ∼27 days. Figure 9 presents the CSD of the                    [0,1,0] combinations and Bx (not shown). Calculating the cross-
normalized Bx and NM counts, calculated according to Eq 2. Only                    spectrum of Bx and By, it is easy to verify that the phase difference
data from the time interval from June 10, 2016 to April 15, 2019                   between Bx and By is very close to 180°. Consequently, the count
were used to analyze the same period of time for both data series.                 variations recorded using the NM and the SEVAN [1,0,0] and

Frontiers in Earth Science | www.frontiersin.org                               9                                           July 2021 | Volume 9 | Article 671801
Chum et al.                                                                                                            Solar Wind and Earth’s Atmosphere

  FIGURE 7 | Normalized PG (proxy for fair weather) at Studenec (A), Panska Ves (B), and LS (C).

[0,1,0] combinations lag the variations of By. The phase difference                 seed energetic electrons and the ionization necessary for
is around –140° and exhibits a frequency dependence, as is                          breakdown processes (e.g., Dwyer and Uman, 2014). Recently,
demonstrated in Figures 9C–H, which show the absolute                               Shao et al. (2020) performed a detailed radio frequency
values and phase differences of the CSD for the NM–By,                              interferometry of the fast positive breakdown process that
SEVAN [1,0,0]–By, and SEVAN [0,1,0]–By data series.                                 started a normal intracloud lightning and concluded that the
Asterisks in the individual plots of Figure 9 mark the                              breakdown process was ignited by a cosmic ray shower. Thus,
maximum of the absolute values of the CSD and values larger                         there is a possibility that the discovered ∼27-day modulation of
than ½ of this maximum, including the corresponding phase                           SCRs that is primarily caused by the ∼27-day periodicity in the
differences. The phase differences change around the maxima;                        HMF and solar wind, which influences the primary CRs entering
nevertheless, they are relatively stable for the frequencies                        the Earth’s atmosphere, could also modulate lightning
(periods) of interest, marked by the asterisks, unlike the values                   occurrence. Indeed, some previous statistical studies indicate
of phase differences outside the maxima.                                            that the polarity of By and corotating interaction regions that
   It is useful to remember that it is assumed that SCRs might                      often embed the HCS modulate lightning activity in middle
play an important role in lightning initiation by providing                         latitudes (Owens et al., 2014; Owens et al., 2015; Miyahara

Frontiers in Earth Science | www.frontiersin.org                               10                                     July 2021 | Volume 9 | Article 671801
Chum et al.                                                                                                                    Solar Wind and Earth’s Atmosphere

  FIGURE 8 | Power spectral densities (PSD) of the normalized PG (proxy for fair weather) measured at Studenec (A), Panská Ves (B) and on LS (C).

et al., 2018). It should be noted that the polarity of By (Bx) reverses             atmosphere and/or the material surrounding the detectors
in the HCS.                                                                         (Chum et al., 2020). It should be remembered in this respect
    On the other hand, the high electric field in thunderclouds                      that the significant enhancements of SCRs due to high electric
might also be responsible for enhancements of SCRs. Such                            fields—the several minutes–long TGEs—represented outliers in
enhancements were also observed on Lomnický Štít (Kudela                           our dataset and were removed from the analysis, as was described
et al., 2017; Chum et al., 2020). In these cases, however, the                      in the section “Methods.” Therefore, the observed ∼27-day
seed energetic electrons generated by cosmic rays were likely                       periodicity of SCRs is modulated by the HMF/SW and not by
multiplied in the process called relativistic runaway electron                      thunderstorms.
avalanche (RREA) suggested by Gurevich et al. (1992).                                  We investigated the periodicity of lightning activity in the area
Thunderstorm ground enhancements (TGEs) of SCRs were                                with the coordinates 48–51°N, 11–23°E, covering roughly Czechia
usually observed only in SEVAN channel 1, except one                                and Slovakia. Figure 10A presents the number of lightnings
extreme event, for which the TGE was also reliably detected                         recorded by the WWLLN in subsequent 1-h intervals for the
using the NM and the SEVAN [0,1,0] combination, which                               period 2016–2019. Obviously, the lightning counts are high in the
indicated a possibility of photonuclear reactions in the                            summer seasons. The seasonal variability produces a spectral

Frontiers in Earth Science | www.frontiersin.org                               11                                            July 2021 | Volume 9 | Article 671801
Chum et al. Solar Wind and Earth’s Atmosphere FIGURE 9 | Cross-spectral densities (absolute values and phase differences) of (A, B) normalized pressure-corrected NM counts and Bx, (C, D) normalized pressure-corrected NM counts and By, (E, F) normalized pressure-corrected SEVAN [1,0,0] counts and By, and (G, H) normalized pressure-corrected SEVAN [0,1,0] counts and By. Asterisks mark the peak of absolute values of CSD, including its flanks, and the corresponding phase difference. peak around the period of one year and partly around lower caused by the high power spectral density of By at this period. harmonics (∼half, ∼third, ∼quarter, and ∼fifth of the year). The Asterisks in the individual plots of Figure 9 mark the maximum spectral peaks related to the seasonal variability are therefore of the absolute values of the CSD at the period of ∼27 days and sufficiently far from the period of ∼27 days on the frequency values larger than ½ of this maximum, including the (period) axis. To calculate the spectra, lightning counts were first corresponding phase differences. It should be noted that the normalized using the method described in the section “Methods.” phase difference around the maximum is relatively stable. The Figure 10B shows the PSD of normalized lightning counts. The observed phase difference is about 180°, which indicates that a most distinct and sharp spectral peak is observed for the period of probability of lightning occurrence is in antiphase with By. In 1 day (Figure 10B) as the lightning activity usually peaked other words, the probability of lightning occurrence decreases for between 14–15 UT over Czechia and Slovakia in the analyzed By > 0 and increases for By < 0. Consequently, it is in phase with period. Besides the dominant peak at the 1-day period, several Bx (not shown) as fluctuations of Bx and By are anticorrelated at relatively flat peaks of similar amplitudes also occurred. One of the period of ∼27 days. It should be emphasized that the these flat peaks is at the period of ∼27 days. Figures 10C, D dependence of lightning activity on the values/polarity of Bx display results of cross-spectral analysis between the lightning and By is only weak as the spectral peak at ∼27 days in the counts and By; specifically, the absolute values of CSD and phase spectrum of lightning counts (Figure 10B) is not dominant. differences are shown, respectively. The distinct peak at the Nevertheless, this finding is an interesting result which is in period of ∼27 days of absolute values of the CSD is mainly agreement with the previous statistical study performed by Frontiers in Earth Science | www.frontiersin.org 12 July 2021 | Volume 9 | Article 671801
Chum et al.                                                                                                                             Solar Wind and Earth’s Atmosphere

  FIGURE 10 | Analysis of lightning activity. (A) Lightning counts over Czechia and Slovakia. (B) Power spectral density (PSD) of normalized lightning counts. (C, D)
  Cross-spectral densities (absolute values and phase differences) of normalized lightning counts and By. Asterisks mark the peak of absolute values of CSD, including its
  flanks, and the corresponding phase difference.

Owens et al. (2014), who showed that the lightning occurrence                             harmonic (∼13.5 days) are well expressed both in the HMF
over the UK was modulated by the polarity of the HMF and found                            and SW and in SCR data. Especially, count variations
that the lightning occurrence was lower for the orientation of the                        registered by the NM and by the SEVAN low-energy and
HMF away from the Sun (Bx < 0 and By > 0) than it was for the                             neutron channels ([1,0,0] and [0,1,0] combinations,
orientation toward the Sun (Bx > 0 and By < 0).                                           respectively) exhibit distinct peaks at the period of ∼27 days.
                                                                                          We also investigated the phase difference between the Bx and By
                                                                                          components of the HMF and the variations of the NM and
CONCLUSION                                                                                SEVAN counts and found that the variations of NM and SEVAN
                                                                                          [1,0,0] and [0,1,0] data advance, on average, the fluctuations of
Effects of the HMF on SCRs and on atmospheric electricity at                              the Bx component of the HMF by roughly 40°, which corresponds
middle latitudes were studied by using measurements of SCRs in                            to about a 3-day time-shift at the period of 27 days. As Bx and By
Slovakia (LS), the electric field in Slovakia (LS) and Czechia                             are practically in the antiphase as predicted by Parker (1958), the
(Panská Ves and Studenec), and lightning activity in Czechia and                          variations of NM, SEVAN [1,0,0], and SEVAN [0,1,0] data lag the
Slovakia. By analyzing the spectra of the near-Earth HMF,                                 fluctuations of the By component of the HMF by roughly –140°.
velocities of SW, atmospheric electric field, and SCRs                                        No reliable signatures of the ∼27-day periodicity were found in
measured using the NM and SEVAN detectors located on the                                  the electric field (PG) measurements in Czechia and Slovakia.
mount of Lomnický Štít, Slovakia, it was found that the variations                       Therefore, we conclude that the By component of the HMF does
with the period of solar rotation (∼27 days) and its second                               not influence the PG measured at these middle-latitude stations.

Frontiers in Earth Science | www.frontiersin.org                                     13                                               July 2021 | Volume 9 | Article 671801
Chum et al. Solar Wind and Earth’s Atmosphere
This differs from the observation at polar stations, mainly DATA AVAILABILITY STATEMENT
stations in the winter Antarctic, where the fair-weather PG
substantially depended on the By polarity (Mansurov et al., The datasets presented in this study can be found in online
1974; Burns et al., 2008). On the other hand, minor repositories. The names of the repository/repositories and accession
signatures of ∼25.7-day periodicities were found in the number(s) can be found below: the SW and HMF data can be found at
analyzed PG observations. Such a periodicity was also NASA/GSFC’s Space Physics Data Facility’s OMNIWeb (https://
observed in the SW velocity. Because of the large differences omniweb.gsfc.nasa.gov/). The SEVAN and NM data and PG data
between the PG and SW spectra, it is difficult to reliably from Lomnický Štít can be downloaded from http://data.space.saske.
determine whether the 25.7-day periodicity in PG data is sk/status/ (access is provided by R. Langer, langer@saske.sk, on
induced by SW, as it is likely a random coincidence. Our request). PG data from Czechia are available at https://www.ufa.
observations show that variations of the PG measured in cas.cz/en/institute-structure/department-of-ionosphere-and-
Czechia and Slovakia are likely fully controlled by processes in aeronomy/measurements-operated-by-department-of-ionosphere-
the troposphere. and-aeronomy/.
The lightning activity in Slovakia and Czechia and its
periodicity were investigated using data from the WWLLN.
We observed a minor peak of the lightning activity at AUTHOR CONTRIBUTIONS
the period of solar rotation of about 27 days. The fluctuation
of lightning counts at this period was in phase with the Bx JC designed and wrote the manuscript and performed most of the
component of the HMF and was in antiphase with the By analysis. MK, RL, and IS are responsible for and provided the SCR
component. In other words, lightning was more probable data. IK provided the lightning counts from the WWLLN. DS
for the orientation of the HMF toward the Sun (Bx > 0 and helped with solar wind data. JR helped with the wavelet
By < 0) than for the orientation away from the Sun (Bx < 0 and transform. All authors read and approved the submitted version.
By > 0). It should be noted that this effect is weak and that
the lightning activity is mainly controlled by processes in
the troposphere. A similar relation was also observed for the FUNDING
lightning occurrence in the UK by Owens et al. (2014), who
used, however, a statistical approach in their study. The Support under the grants SAV-18-04 and SAV-21-01 by the Czech
fact that similar results were obtained using different methods Academy of Sciences is acknowledged. IK also acknowledges the
and for different regions enhances the credibility of these support under the project 20-09671S of the Czech Science Foundation.
findings.
A more detailed investigation of the phase differences between
the measured SCR, lightning occurrence, and By (Bx) for different ACKNOWLEDGMENTS
phases of the solar cycle, together with investigation of other
characteristics of solar activity, and analysis of the physical We are grateful to Jiří Baše for maintaining the electric field
mechanisms leading to the observed relations is a potential measurements. JC also acknowledges valuable discussions with
subject for future study. Keri Nicoll that preceded this study.
Chowdhury, P., and Kudela, K. (2018). Quasi-periodicities in Cosmic Rays and
REFERENCES Time Lag with the Solar Activity at a Middle Latitude Neutron Monitor: 1982-
2017. Astrophys. Space Sci. 363, 250. doi:10.1007/s10509-018-3467-y
Bazilevskaya, G., Broomhall, A.-M., Elsworth, Y., and Nakariakov, V. M. (2014). Chum, J., Langer, R., Baše, J., Kollárik, M., Strhárský, I., Diendorfer, G., et al.
A Combined Analysis of the Observational Aspects of the Quasi-Biennial (2020). Significant Enhancements of Secondary Cosmic Rays and Electric Field
Oscillation in Solar Magnetic Activity. Space Sci. Rev. 186, 359–386. at the High Mountain Peak of Lomnický Štít in High Tatras during
doi:10.1007/s11214-014-0068-0 Thunderstorms. Earth Planets Space 72, 28. doi:10.1186/s40623-020-01155-9
Burns, G. B., Tinsley, B. A., French, W. J. R., Troshichev, O. A., and Frank- Dwyer, J. R., and Uman, M. A. (2014). The Physics of Lightning. Phys. Rep. 534 (4),
Kamenetsky, A. V. (2008). Atmospheric Circuit Influences on Ground-Level 147–241. doi:10.1016/j.physrep.2013.09.004
Pressure in the Antarctic and Arctic. J. Geophys. Res. 113, D15112. doi:10.1029/ Gosling, J. T., and Pizzo, V. J. (1999). Formation and Evolution of Corotating
2007JD009618 Interaction Regions and Their Three Dimensional Structure. Space Sci. Rev. 89,
Chilingarian, A., Babayan, V., Karapetyan, T., Mailyan, B., Sargsyan, B., and Zazyan, 21–52. doi:10.1023/A:100529171190010.1007/978-94-017-1179-1_3
M. (2018). The SEVAN Worldwide Network of Particle Detectors: 10 Years of Gosse, J., and Klein, J. (2015). “Terrestrial Cosmogenic Nuclide Dating,” in Encyclopedia
Operation. Adv. Space Res. 61, 2680–2696. doi:10.1016/j.asr.2018.02.030 of Scientific Dating Methods. Editors W. J. Rink and J. W. Thompson (New York:
Chilingarian, A., Hovsepyan, G., Karapetyan, G., and Zazyan, M. (2021). Stopping Springer), 29, 799–813. doi:10.1007/978-94-007-6304-3_148
Muon Effect and Estimation of Intracloud Electric Field. Astroparticle Phys. Gray, L. J., Beer, J., Geller, M., Haigh, D. J., Lockwood, M., Matthes, K., et al. (2010).
124, 102505. doi:10.1016/j.astropartphys.2020.102505 Solar Influences on Climate. Rev. Geophys. 48, RG4001. doi:10.1029/2009RG000282
Chilingarian, A., and Reymers, A. (2008). Investigations of the Response of Hybrid Grieder, P. (2001). Cosmic Rays at Earth, 1. Amsterdam: Elsevier.
Particle Detectors for the Space Environmental Viewing and Analysis Network Gurevich, A. V., Milikh, G. M., and Roussel-Dupre, R. A. (1992). Runaway Electron
(SEVAN). Ann. Geophys. 26, 249–257. Available at: www.ann-geophys.net/26/ Mechanism of Air Breakdown and Preconditioning during a Thunderstorm.
249/2008/. doi:10.5194/angeo-26-249-2008 Phys. Lett. A 165 (5-6), 463–468. doi:10.1016/0375-9601(92)90348-P
Frontiers in Earth Science | www.frontiersin.org 14 July 2021 | Volume 9 | Article 671801Chum et al. Solar Wind and Earth’s Atmosphere Kirkby, J. (2008). Cosmic Rays and Climate. Surv. Geophys. 28, 333–375. 2 M 2 Ground-Based tRPC Detector. Earth Space Sci. 7, e2020EA001131. doi:10.1007/s10712-008-9030-610.1007/s10712-008-9030-6 doi:10.1029/2020EA001131 Kristjánsson, J. E., Stjern, C. W., Stordal, F., Fjæraa, A. M., Myhre, G., and Jónasson, Rieger, E., Share, G. H., Forrest, D. J., Kanbach, G., Reppin, C., and Chupp, E. L. K. (2008). Cosmic Rays, Cloud Condensation Nuclei and Clouds - a (1984). A 154-day Periodicity in the Occurrence of Hard Solar Flares? Nature Reassessment Using MODIS Data. Atmos. Chem. Phys. 8 (24), 7373–7387. 312, 623–625. doi:10.1038/312623a0 doi:10.5194/acp-8-7373-2008 Rodger, C. J., Brundell, J. B., Dowden, R. L., and Thomson, N. R. (2004). Location Kudela, K., Chum, J., Kollárik, M., Langer, R., Strhárský, I., and Baše, J. (2017). Accuracy of Long Distance VLF Lightning Locationnetwork. Ann. Geophys. 22 Correlations between Secondary Cosmic Ray Rates and Strong Electric Fields at (3), 747–758. doi:10.5194/angeo-22-747-2004 Lomnický Štít. J. Geophys. Res. Atmos. 122, 700–710. doi:10.1002/ Rycroft, M. J., Israelsson, S., and Price, C. (2000). The Global Atmospheric Electric 2016JD026439 Circuit, Solar Activity and Climate Change. J. Atmos. Solar-Terrestrial Phys. 62, Kudela, K., and Langer, R. (2009). Cosmic ray Measurements in High Tatra 1563–1576. doi:10.1016/S1364-6826(00)00112-7 Mountains: 1957-2007. Adv. Space Res. 44 (10), 1166–1172. doi:10.1016/ Saad Farid, A. I. (2019). High Frequency Spectral Features of Galactic Cosmic Rays j.asr.2008.11.028 at Different Rigidities during the Ascending and Maximum Phases of the Solar Kudela, K., Mavromichalaki, H., Papaioannou, A., and Gerontidou, M. (2010). On Cycle 24. Astrophys Space Sci. 364, 57. doi:10.1007/s10509-019-3544-x Mid-term Periodicities in Cosmic Rays. Sol. Phys. 266, 173–180. doi:10.1007/ Shao, X. M., Ho, C., Bowers, G., Blaine, W., and Dingus, B. (2020). Lightning s11207-010-9598-0 Interferometry Uncertainty, Beam Steering Interferometry, and Evidence of Kudela, K., Rybák, J., Antalová, A., and Storini, M. (2002). Time Evolution of Low- Lightning Being Ignited by a Cosmic ray Shower. J. Geophys. Res. Atmos. 125, Frequency Periodicities in Cosmic ray Intensity. Solar Phys. 205, 165–175. e2019JD032273. doi:10.1029/2019JD032273 doi:10.1023/A:1013869322693 Shea, M. A., and Smart, D. F. (2000). Fifty Years of Cosmic Radiation Data. Space Lam, M. M., and Tinsley, B. A. (2016). Solar Wind-Atmospheric Electricity-Cloud Sci. Rev. 93, 229–262. doi:10.1023/A:1026500713452 Microphysics Connections to Weather and Climate. J. Atmos. Solar-Terrestrial Silva, H. G., Conceição, R., Melgão, M., Nicoll, K., Mendes, P. B., Tlemçani, M., Phys. 149, 277–290. doi:10.1016/j.jastp.2015.10.019 et al. (2014). Atmospheric Electric Field Measurements in Urban Environment López-Comazzi, A., and Blanco, J. J. (2020). Short-Term Periodicities Observed in and the Pollutant Aerosol Weekly Dependence. Environ. Res. Lett. 9 (11), Neutron Monitor Counting Rates. Sol. Phys. 295, 81. doi:10.1007/s11207-020- 114025. doi:10.1088/1748-9326/9/11/114025 01649-5 Svensmark, H., Bondo, T., and Svensmark, J. (2009). Cosmic ray Decreases Affect Mansurov, S. M., Mansurova, L. G., Mansurov, G. S., Mikhnevich, V. V., and Visotsky, Atmospheric Aerosols and Clouds. Geophys. Res. Lett. 36, L15101. doi:10.1029/ A. M. (1974). North–south Asymmetryofgeomagneticandtroposphericevents. 2009GL038429 J.Atmos.Terr.Phys. 36 (1), 1957–1962. doi:10.1016/0021-9169(74)90182-2 Usoskin, I. G., Kananen, H., Mursula, K., Tanskanen, P., and Kovaltsov, G. A. Miyahara, H., Kataoka, R., Mikami, T., Zaiki, M., Hirano, J., Yoshimura, M., et al. (1998). Correlative Study of Solar Activity and Cosmic ray Intensity. J. Geophys. (2018). Solar Rotational Cycle in Lightning Activity in Japan during the 18-19th Res. 103 (A5), 9567–9574. doi:10.1029/97JA03782 Centuries. Ann. Geophys. 36, 633–640. doi:10.5194/angeo-36-633-2018 Voiculescu, M., Usoskin, I., and Condurache-Bota, S. (2013). Clouds Blown by Nicoll, K. A., Harrison, R. G., Barta, V., Bor, J., Brugge, R., Chillingarian, A., et al. the Solar Wind. Environ. Res. Lett. 8, 045032. doi:10.1088/1748-9326/8/4/ (2019). A Global Atmospheric Electricity Monitoring Network for Climate and 045032 Geophysical Research. J. Atmos. Solar-Terrestrial Phys. 184, 18–29. doi:10.1016/ Voiculescu, M., and Usoskin, I. (2012). Persistent Solar Signatures in Cloud Cover: j.jastp.2019.01.003 Spatial and Temporal Analysis. Environ. Res. Lett. 7, 044004. doi:10.1088/1748- Nicoll, K. A., and Harrison, R. G. (2009). Vertical Current Flow through Extensive 9326/7/4/044004 Layer Clouds. J. Atmos. Solar-Terrestrial Phys. 71 (12), 2040–2046. doi:10.1016/ Yang, Z.-Y., and Sheu, R.-J. (2020). An In-Depth Analysis of Aviation Route Doses j.jastp.2009.09.011 for the Longest Distance Flight from Taiwan. Radiat. Phys. Chem. 168, 108548. Owens, M. J., and Forsyth, R. J. (2013). The Heliospheric Magnetic Field. Living doi:10.1016/j.radphyschem.2019.108548 Rev. Solar Phys. 10, 5. doi:10.12942/lrsp-2013-5 Owens, M. J., Scott, C. J., Bennett, A. J., Thomas, S. R., Lockwood, M., Harrison, R. Conflict of Interest: The authors declare that the research was conducted in the G., et al. (2015). Lightning as a Space-Weather hazard: UK Thunderstorm absence of any commercial or financial relationships that could be construed as a Activity Modulated by the Passage of the Heliospheric Current Sheet. Geophys. potential conflict of interest. Res. Lett. 42, 9624–9632. doi:10.1002/2015GL066802 Owens, M. J., Scott, C. J., Lockwood, M., Barnard, L., Harrison, R. G., Nicoll, K., Copyright © 2021 Chum, Kollárik, Kolmašová, Langer, Rusz, Saxonbergová and et al. (2014). Modulation of UK Lightning by Heliospheric Magnetic Field Strhárský. This is an open-access article distributed under the terms of the Creative Polarity. Environ. Res. Lett. 9 (11), 115009. doi:10.1088/1748-9326/9/11/115009 Commons Attribution License (CC BY). The use, distribution or reproduction in Parker, E. N. (1958). Dynamics of the Interplanetary Gas and Magnetic Fields. ApJ other forums is permitted, provided the original author(s) and the copyright owner(s) 128, 664–676. doi:10.1086/146579 are credited and that the original publication in this journal is cited, in accordance Riádigos, I., García-Castro, D., González-Díaz, D., and Pérez-Muñuzuri, V. (2020). with accepted academic practice. No use, distribution or reproduction is permitted Atmospheric Temperature Effect in Secondary Cosmic Rays Observed with a which does not comply with these terms. Frontiers in Earth Science | www.frontiersin.org 15 July 2021 | Volume 9 | Article 671801
You can also read