Mining Bytecode Features of Smart Contracts to Detect Ponzi Scheme on Blockchain
←
→
Page content transcription
If your browser does not render page correctly, please read the page content below
Computer Modeling in
                                                                                                        Tech Science Press
            Engineering & Sciences

DOI: 10.32604/cmes.2021.015736

ARTICLE

Mining Bytecode Features of Smart Contracts to Detect Ponzi
Scheme on Blockchain
Xiajiong Shen1,3 , Shuaimin Jiang2,3 and Lei Zhang1,2,3,*
1
    Henan Key Laboratory of Big Data Analysis and Processing, Henan University, Kaifeng, 47500, China
2
    Institute of Data and Knowledge Engineering, Henan University, Kaifeng, 47500, China
3
    School of Computer and Information Engineering, Henan University, Kaifeng, 47500, China
*
    Corresponding Author: Lei Zhang. Email: zhanglei@henu.edu.cn
Received: 09 January 2021 Accepted: 24 February 2021

     ABSTRACT
     The emergence of smart contracts has increased the attention of industry and academia to blockchain technol-
     ogy, which is tamper-proofing, decentralized, autonomous, and enables decentralized applications to operate in
     untrustworthy environments. However, these features of this technology are also easily exploited by unscrupulous
     individuals, a typical example of which is the Ponzi scheme in Ethereum. The negative effect of unscrupulous
     individuals writing Ponzi scheme-type smart contracts in Ethereum and then using these contracts to scam large
     amounts of money has been significant. To solve this problem, we propose a detection model for detecting Ponzi
     schemes in smart contracts using bytecode. In this model, our innovation is shown in two aspects: We first propose
     to use two bytes as one characteristic, which can quickly transform the bytecode into a high-dimensional matrix,
     and this matrix contains all the implied characteristics in the bytecode. Then, We innovatively transformed the
     Ponzi schemes detection into an anomaly detection problem. Finally, an anomaly detection algorithm is used to
     identify Ponzi schemes in smart contracts. Experimental results show that the proposed detection model can greatly
     improve the accuracy of the detection of the Ponzi scheme contracts. Moreover, the F1-score of this model can
     reach 0.88, which is far better than those of other traditional detection models.

     KEYWORDS
     Ponzi scheme; blockchain security; smart contracts; anomaly detection

1 Introduction
    Blockchain technology originated from Nakamoto [1] invention of Bitcoin technology, which
is a distributed accounting technology that builds trust and achieves node consensus in a peer-
to-peer network. On the one hand, the consensus mechanism is used to solve the information
consistency problem in the untrusted environment to guarantee that all nodes have the same
transaction information. On the other hand, cryptographic techniques such as digital signatures
and hashing algorithms are used to guarantee the security of the distributed network. The use of
these technologies has made blockchain decentralized, tamper-proof, open, and transparent. The
emergence of smart contracts gives blockchain the ability to truly change the world [2–4]. In 1995,

                                 This work is licensed under a Creative Commons Attribution 4.0 International License,
                                 which permits unrestricted use, distribution, and reproduction in any medium, provided the
                                 original work is properly cited.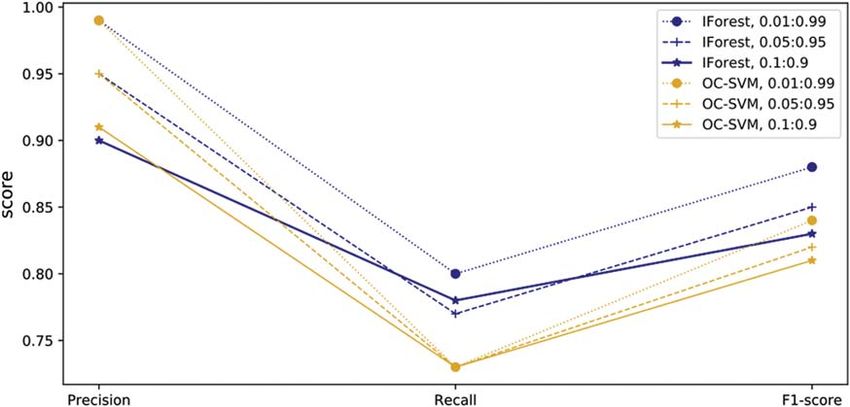
1070                                                                       CMES, 2021, vol.127, no.3

Nick Szabo already introduced the concept of a smart contract [5]; “a smart contract is a set of
digitally defined promises, including an agreement on which the contract participants can execute
those promises.” In blockchain terminology, a smart contract is a piece of programming code that
runs on the blockchain system. By writing the execution conditions and steps of the contract into
the blockchain system, the contract can be triggered to execute automatically when a specific event
occurs (unless otherwise specified, all smart contracts mentioned below refer specifically to smart
contracts in the blockchain) [6].
     Smart contracts inherit the characteristics of blockchain, which also has the characteristics
of decentralization, tamper-proofing, openness, and transparency; these properties make smart
contracts have a broad application prospect. Ethernet is one of the world’s leading open-
source blockchain platforms, it implements support for smart contracts using the Ethernet virtual
machine (EVM), and allows developers to write smart contracts using Turing-complete languages
such as Solidity [7]. According to Dune Analytics [8], the total number of smart contracts pub-
lished on the Ethereum blockchain network has exceeded 2 million as of March 2020. However,
an increasing number of hackers are taking advantage of the characteristics of smart contracts to
perform Ponzi contract-type scams on users [9].
     Ponzi schemes are one of the most common and oldest investment scams. In short, this
scheme the money of new investors to pay interest and short-term returns to old investors to
create the illusion of making money and defraud more investment. The essence of the Ponzi
scheme is to pay the investors of the latter round as investment income to the investors of the
previous round and so on, as a result, an increasing number of people and funds are involved [10].
The principle of the Ponzi schemes on the blockchain is the same [11,12]. Chen et al. [13]
called the contracts with the characteristics of Ponzi schemes on the blockchain as Ponzi scheme
contracts and summarized the three characteristics of Ponzi scheme contracts:
    • No maintenance costs are paid after the smart contract is implemented;
    • The participants have a high degree of confidence that the repayment will continue because
      the smart contract cannot be terminated and is automatically executed;
    • The creators of the Ponzi scheme contracts remain anonymous.
   They also pointed out that the creators of the Ponzi scheme contracts can earn more than
40% of the profit while 80% of the participants are in a losing position.
    The abovementioned study shows that detecting Ponzi schemes contracts is an important task
to maintain the healthy development of blockchain. Given that the number of smart contracts
in Ethereum has reached 2 million, it is obviously impractical to detect Ponzi scheme contracts
manually [14–16]. Obtaining the source code of smart contracts is difficult, and only the latest
500 smart contracts can be retrieved from Ethereum at present [17]. Thus, detecting Ponzi scheme
contracts in Ethereum using the source code is impossible [18,19].
     To address the aforementioned issues, this paper proposes a model for detecting Ponzi scheme
contracts using the bytecode of smart contracts. The bytecode file compiled by the smart contract
in Ethereum is divided into three parts: deployment code, runtime code, and auxdata. Thereafter,
the EVM executes the bytecode file to complete the deployment of the smart contract. When
EVM executes, it will create the contract account and then run the deployment code. After the
deployment code is executed, EVM will store the runtime code and auxdata on the blockchain
and finally associate the storage address of both with the contract account. Ethereum takes these
steps to deploy smart contracts. Runtime code contains the core logic of smart contracts. Thus,
it includes all the features in Ponzi scheme contracts, and the bytecode file is easy to obtain.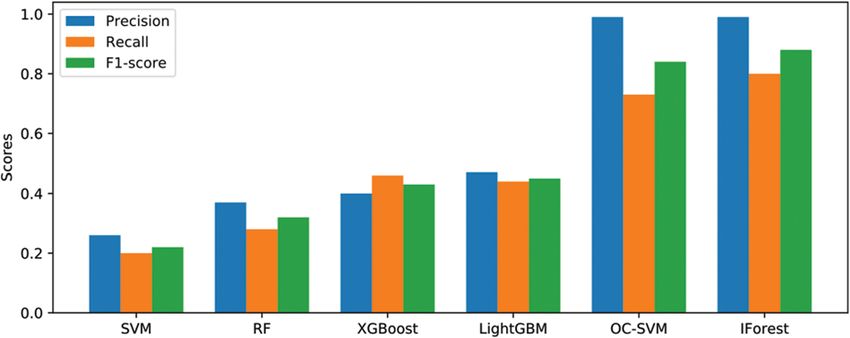
CMES, 2021, vol.127, no.3                                                                        1071

Nearly all smart contracts can obtain their bytecodes from Ethereum. Thus, this paper uses
runtime code to detect Ponzi scheme contracts (if no special note is specified, then the bytecode
mentioned below refers to runtime code).
    In this paper, we propose a model for detecting Ponzi scheme contracts based on bytecode.
The number of Ponzi scheme contract samples is very sparse compared with that of the normal
data samples. Therefore, this paper transforms the detection problem of Ponzi scheme contracts
into an anomaly detection problem. First, we extract the characteristic information in the bytecode
and transform the bytecode into a high-dimensional characteristic matrix. Then, we use princi-
pal component analysis (PCA) algorithms to reduce the dimension of the characteristic matrix
and eliminate the noise. Finally, we use anomaly detection algorithms, one-class-support vector
machine (OC-SVM) and isolation forest (IForest), to solve the detection problem of Ponzi scheme
contracts. The overall framework of the detection model of Ponzi scheme contracts is shown
in Fig. 1.

             Data                   Extracting Features               Classification Model
          Preparation

            Source            Grouping
                                                                             Anomaly
            Codes
                                                                             Detection

                                 All
           Compiler         Characteristics
                                                                      Ponzi         Non Ponzi
                                                     Important
                                                                     Scheme          Scheme
                                                   Characteristics
                                                                     contracts       contracts

          Bytecodes              PCA

         Figure 1: Overall framework of the detection model of Ponzi scheme contracts

    The main contributions of this paper can be summarized as follows:
     1) We innovatively propose to detect Ponzi scheme contracts using the characteristics of
bytecodes in smart contracts. First, the bytecodes are transformed into a high-dimensional charac-
teristic matrix. Then, the noise in the characteristic matrix is eliminated using the PCA algorithm.
This method improves the generalizability and practicality of the proposed model given that
bytecode files are very easy to obtain.
    2) We transform the detection problem of the Ponzi scheme contract into an anomaly detec-
tion problem by using the characteristics in the bytecodes. This way can significantly improve the
accuracy of Ponzi scheme contract detection with only a small number of samples. The F1-score
value of Ponzi scheme contract detection in this paper is improved to 88%, which is much better
than those of other methods.
1072 CMES, 2021, vol.127, no.3
The remaining sections of the paper are organized as follows. In Section 2, we introduce the
work related to Ponzi scheme contract detection. In Section 3, we elaborate on the proposed detec-
tion model of the Ponzi scheme contracts. In Section 4, we perform an experimental evaluation
of the proposed model. We conclude and discuss the paper in Section 5.
2 Related Work
This section briefly introduces the differences between non-Ponzi and Ponzi scheme contracts.
First, an ordinary smart contract is used as an example to illustrate the steps of executing smart
contracts in Ethernet from compilation to deployment. Then, this section analyzes the features of
Ponzi schemes contracts in detail. Finally, this section presents the work of other researchers.
2.1 Smart Contract Deployment
Smart contracts in Ethernet are mainly written in the Solidity script language. Thus, this
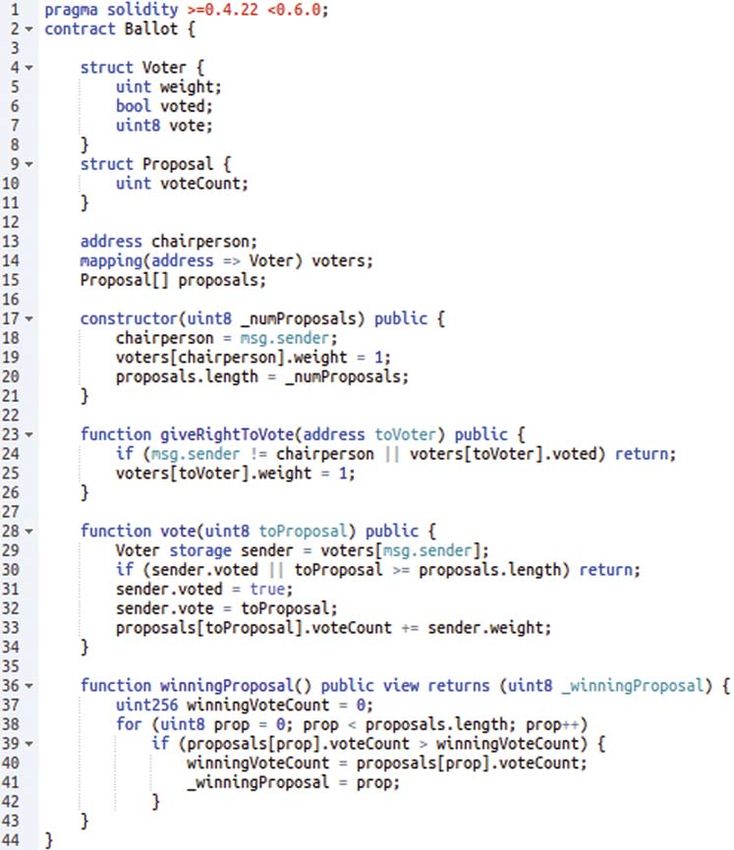
section takes a smart contract written in Solidity as an example. Fig. 2 shows a normal smart
contract, which comes from the case in the Solidity language documentation [20], implementing
the voting function.
Line 1 declares the version compiled by Solidity, lines 4–11 define the structural body used in
the smart contract, the names of which are “Voter” and “Proposal,” “Voter” includes the informa-
tion of the elector, and “Proposal” includes the information of the candidate. The values of the
variables in the structural body are permanently stored in the storing space of the smart contract.
Lines 17–21 are the constructor, which is called only when the smart contract is deployed, and the
function is to initialize the “Voter” and “Proposal” structural body. The function in lines 23–26
gives the unvoted voters the right to vote and sets the weight of the vote to 1. The function in
lines 28–34 implements the voting function, which is the core logic of this smart contract. Line
29 obtains the information of the elector, and line 30 determines whether this elector has voted;
if he or she has already voted, then this elector will fail to vote. Line 31 sets the status of the
voter from unvoted to voted. Line 32 indicates that the voter voted for that candidate. Line 33
adds 1 to the number of votes for the candidate who received a vote. Lines 36–43 count the votes
of all candidates and find the final winning candidate.
The smart contract shown in Fig. 2 is compiled using the Solidity compiler. After successful
compilation, the compiler generates two files, the Application Binary Interface (ABI) file and the
binary file, which end in “.abi” and “.bin”, respectively. ABI file can be simply understood as the
interface description file of the smart contract, which contains the field names, method names, and
parameter names, parameter types, in the smart contract. The ABI description with the “vote”
function as an example is shown in Fig. 3.
The binary file of a smart contract contains three parts: deployment code, runtime code, and
auxdata. When the EVM executes a smart contract, it will first create the smart contract account
and then run the deployment code. After running, it will store the runtime code and auxdata on
the blockchain (auxdata is the fingerprint verification of the contract; thus, it will not be executed
by EVM). Thereafter, the storage address of both is associated with the smart contract account,
and the deployment of the smart contract is completed. The process of deploying smart contracts
in Ethernet is shown in Fig. 4. Notably, that only binary codes are required for deploying smart
contracts. Thus, the creator can hide the source code of the smart contract. Accordingly, the
method of detecting Ponzi scheme contracts based on source code is not feasible. This paper
uses runtime code to detect Ponzi scheme contracts given that the runtime code contains the core
operational logic of the smart contracts.CMES, 2021, vol.127, no.3 1073
Figure 2: Normal smart contracts
Each byte in the runtime code represents an instruction in the EVM or the number of
operations needed to run the instruction. Similar to the JVM, the EVM is a stack-based virtual
machine. As a result, all its operations are performed on the stack. The stack in the EVM
operates in words, and each word is 32 bytes long, or 256 bits per word, to facilitate cryptographic
computation. The EVM stack holds a maximum of 1024 words.
Given that EVM limits the length of instructions to one byte, its instruction set can contain
up to 256 instructions. Currently, EVM has defined 144 instructions, including jumps, arithmetic
operation, comparison, bit operation, and cryptographic computation. Each instruction has a
corresponding opcode, and Tab. 1 shows some of the commonly used opcodes in EVM.1074 CMES, 2021, vol.127, no.3
Figure 3: ABI description of “vote” function
ABI Web3.js
Source Code Compile Solidity compiler
Data
ByteCode Deploy Blockchain
DApp
Figure 4: Smart contract deployment process
Table 1: Some commonly used opcodes in EVM
Opcode Assembly instruction Description
0 × 00 STOP Stop execution
0 × 01 ADD Remove param0, param1 from the stack, and push the result
of param0 + param1 entering the stack
0 × 02 MUL Remove param0, param1 from the stack, and push the result
of param0 ∗ param1 entering the stack
0 × 03 SUB Remove param0, param1 from the stack, and push the result
of param0 − param1 entering the stack
0 × 34 CALLVALUE Obtain the value of the transfer amount in the transaction
0 × 35 CALLDATALOAD Obtain the value of the Input field in the transaction
0 × 36 CALLDATASIZE Obtain the length of the Input value in the transaction
0 × 50 POP Pop param0 from the stack
0 × 56 JUMP Pop param0 from the stack and jump to the address pointed
to by param0
0 × 60 PUSH1 Push the 1-byte number entering the stack
0 × 61 PUSH2 Push the 2-byte number entering the stackCMES, 2021, vol.127, no.3 1075
2.2 Ponzi Scheme Contract Detection
Vasek et al. [21] conducted an empirical analysis of Bitcoin fraud for the first time. They
concluded four types of scams: Ponzi scheme, mining fraud, fraudulent wallet, and fraudulent
exchange. They also pointed out that the fraud amount in Bitcoin fraud reached at least 11 million
US dollars. Ngai et al. and Massimo et al. used data mining techniques to identify Ponzi schemes
in Bitcoin [22,23]. Massimo et al. analyzed the smart contract scams in Ethereum for the first
time. They summarized four salient features in Ponzi scheme contracts through the source code
and gave four suggestions [24]. Weili and others extracted the transaction history and opcode
features of smart contracts to detect Ponzi scheme contracts. They predicted through this method
that more than 500 Ponzi scheme contracts run in Ethereum [13].
3 Detection Model of Ponzi Scheme Contracts Based on Bytecode
In this paper, we innovatively transform the classification problem of the Ponzi scheme
contracts to the anomaly detection problem. Anomaly detection differs from problems and tasks
in the conventional paradigm by targeting a small number of unpredictable or uncertain rare
events, which have a unique complexity that renders general machine learning and deep learning
techniques ineffective [25,26]. Compared with non-Ponzi scheme contracts, Ponzi scheme con-
tracts have very few samples, and their characteristics are very different (see Section 3.1.2 for
details). Therefore, this paper converts the classification problem of Ponzi scheme contracts into an
anomaly detection problem. A certain degree of rationality exists. The results of the experimental
evaluation (Section 4) also verify the rationality of this conversion.
3.1 Data and Feature Extraction
3.1.1 Data
Very few open-source data sets are currently available in the field of Ponzi scheme contract
detection. We use the largest known data set of Ponzi scheme contract detection [27], which is an
open-source data set by Weili et al., to ensure the universality and practicability of the proposed
model. The data set contains 3780 labeled and 14,000 unlabeled data. A total of 200 pieces of
data in the labeled data are marked as Ponzi scheme contracts. These labeled data are obtained
after the open-source smart contracts in Etherscan.io are manually checked.
3.1.2 Feature Extraction Based on Bytecode
The developers write the smart contracts and compile them through the Solidity compiler into
bytecode that can be run in the EVM. The EVM compiles the bytecode into assembly instructions
and then executes the operations in the smart contract through the assembly instructions in the
computer. Each calculation step executed by the smart contract will charge a certain amount of
fees to avoid network abuse and avoid some of the halting problems caused by Turing complete-
ness. Ethereum calls these fees Gas. Fig. 5 shows the execution process of the smart contract in
the EVM.
As concluded from Fig. 5, the bytecode contains all the operations of the smart contract and
the data used in the operation. Thus, this paper proposes a detection model of Ponzi scheme
contracts based on bytecode. For a start, we use two characters as a group and divide each smart
contract into a corresponding characteristic matrix. The advantage of this procedure is that the
meaning of the bytecode need not be considered, and various features hidden in the bytecode can
be extracted quickly and effectively. After feature extraction, this paper performs standardization
operations on these features. We let x denote the value before standardization; μ, σ denote the1076 CMES, 2021, vol.127, no.3
mean and variance of the value, respectively, and x∗ denotes the value after standardization. The
standardization formula of the features is given as follows:
x−μ
x∗ = (1)
σ
Bytecode
Ethereum virtual
machine (EVM)
instructions
Stack
Stack Top
Programe …
Operations push/pop/... random access Memory
Counter
…
Gas
random access
Available Storage
Figure 5: The execution process of the smart contract in the EVM
After feature standardization, we find that the characteristic matrix of Ponzi and non-Ponzi
scheme contracts are significantly different. The number of Ponzi scheme contracts in the data set
used in this paper is 200. Thus, we randomly select 200 samples of non-Ponzi scheme contracts,
and Ponzi scheme contract samples are compared. Fig. 6 shows the characteristics of the Ponzi
and non-Ponzi scheme contracts. The X-axis is the name of the characteristics, and Y-axis is
the mean value of each characteristic. Because of the length, we randomly select 50 features
for display.
Figure 6: Characteristic mean of Ponzi and non-Ponzi scheme contracts (50-dimension)CMES, 2021, vol.127, no.3 1077
Although the bytecode contains all the features of the smart contract, it also contains a lot of
noise. The PCA algorithm [28] is used by us to reduce the dimension of the characteristic matrix
and eliminate the noise for improving the applicability of the proposed model.
The basic idea of PCA is to map the n-dimensional feature matrix to the k-dimensional
characteristic matrix. The new k-dimensional matrix is an orthogonal matrix, also known as the
principal component, which is a k-dimensional characteristic reconstructed based on the original
n-dimensional characteristic. The PCA calculation process calculates the covariance matrix of the
characteristic matrix, then obtains the eigenvalue of the covariance matrix, and finally selects the
matrix composed of the eigenvector corresponding to the k features with the largest eigenvalue
(that is, the largest variance). In this way, the original space of the matrix can be converted into
the new k-dimensional space, and the feature dimension reduction operation can be realized.
Assuming that the elements in sample X are x1 , x2 , . . . , xn , the elements in sample Y are
y1 , y2 , . . . , yn , x, y represent the sample mean of X , Y respectively. The mean formula is given
as follows:
1
n
x= xi (2)
n
i
S2 denotes the sample variance, and the formula is shown as follows:
1
n
s2 = xi − x (3)
n−1
i=1
According to the sample mean and variance formula, the covariance formula Cov(X , Y ) of
X , Y is obtained as follows:
1
n
Cov (X , Y ) = (xi − x)(yi − y) (4)
n−1
i=1
Fig. 7 shows the characteristic mean after PCA reduces the original 257-dimensional charac-
teristic to 25-dimensional. As in Fig. 6, we still randomly select 200 samples of non-Ponzi scheme
contracts to compare with samples of Ponzi scheme contracts. Notably, the experimental part of
this article (Section 4) does not use 25-dimensional characteristics for experiments. In Section 4,
we select the best feature dimension according to different algorithms.
As shown in Figs. 6 and 7, the bytecode features of Ponzi scheme contracts are extremely
different from those of non-Ponzi scheme contracts, which also verifies the rationality of the
extracted features in this paper.
3.2 Data Ponzi Scheme Contracts Detection Model
In this paper, the classification problem of Ponzi scheme contracts is transformed into an
anomaly detection problem. Then, smart contracts are classified using conventional anomaly detec-
tion algorithms. Experiments have proven that these conventional anomaly detection algorithms
can also obtain excellent results after the abovementioned feature extraction steps. The anomaly
detection algorithms used in this paper are OC-SVM [29,30] and IForest [31,32].1078 CMES, 2021, vol.127, no.3
Figure 7: 25-dimensional characteristic mean
3.2.1 Detection Algorithm of Ponzi Scheme Contracts Based on OC-SVM
OC-SVM is significantly different from the traditional SVM algorithm. The traditional SVM
algorithm generally has two types of training data. Its basic model is a linear classifier, which
maximizes the interval between different classes in the feature space. However, it can also classify
non-linear samples by using the kernel function. The core strategy of the SVM algorithm is to
maximize the interval of different types of data, which can be formalized as a problem of solving
second-order convex programming. That is, the SVM algorithm is equivalent to the optimization
algorithm for solving second-order convex programming.
The SVDD algorithm is widely used in OC-SVM. It can distinguish between target and non-
target samples and is usually used in areas such as anomaly detection and fault detection. Its
principle is given as follows:
Supposing is a set of single-type training samples X ∈ Rn∗d , n indicates the number of
samples, d indicates the feature dimension, and the elements in X are x1 , x2 , . . . , xn . Supposing
that the original space X ⊂ Rd where the data are located, the SVDD algorithm first maps X to
the new space through a nonlinear change function φ (x) = Z d and Z d indicates the new feature
space. Then, it will look for a hypersphere with the smallest volume in the new feature space
through the SVDD algorithm. For constructing this smallest hypersphere, SVDD needs to solve
the following optimization problems:
n
min R2 + C ξi
a, R, ξ
i=1
s.t. φ (x) − a2 + ξi , ξi ≥ 0, i = 1, 2, . . . , n (5)
R indicates the radius of the hypersphere, a indicates the center of the hypersphere, ξ indicates
the relaxation factor and C indicates the penalty parameter that weighs the volume of the
hypersphere and the misclassification rate. The penalty for misclassification increases when C isCMES, 2021, vol.127, no.3 1079
large, and the penalty for misclassification rate is reduced when C is small. According to the
Lagrange multiplier method, the dual problem of the original problem is
n
n
n
min αi αj K xi , xj − αi K xi , xj
α
i=1 j=1 i=1
n
s.t. 0 ≤ αi ≤ C, αi = 1, i = 1, 2, . . . , n (6)
i=1
αi indicates the Lagrangian coefficient corresponding to the sample xi . The calculation
formulas for the center a and the radius R of the hypersphere are
n
a= αi φ (x)
i=1
n
n
n
R = K (xv , xv ) − 2 αi K (xv , xi ) + αi αj K xi , xj (7)
i=1 i=1 j=1
Among all training samples, the samples with Lagrangian coefficient that satisfies 0 ≤ αi ≤ C
are called support vectors, and let SV denote all support vectors in the training sample X .
Then, in the formula for calculating R, xv ∈ SV , K (xv , xi ) indicates the kernel function, which is
equivalent to the inner product operation of samples in the feature space, that is
K xi , xj = φ (xi ) , φ xj (8)
Supposing the test sample is xt , the distance d from xt to the center a of the hypersphere is
n
n
n
d = K (xt , xt ) − 2 αi K (xt , xi ) + αi αj K xi , xj (9)
i=1 i=1 j=1
If d ≤ R, then the test sample is inside the hypersphere and is a normal sample; otherwise, it
is an abnormal sample.
3.2.2 Figure Detection Algorithm of Ponzi Scheme Contracts Based IForest
IForest is an anomaly detection algorithm based on the Ensemble algorithm family. Thus, it
has linear time complexity. IForest is not only fast when processing big data but also has high
accuracy. As a result, it has a wide range of applications in the industry. The theoretical basis of
IForest has the following two points:
• The proportion of abnormal data in the total sample size is small.
• The eigenvalues of abnormal points are very different from those of normal points.
The algorithm idea of IForest is to use a random hyperplane to cut a data space, which can
generate two subspaces at a time. Then, a randomly selected hyperplane is used to cut the two
subspaces obtained in the first step, and an endless loop is conducted until each subspace contains
only one data point. Therefore, those data clusters with high density need to be cut many times to1080 CMES, 2021, vol.127, no.3
make each point exist in a subspace alone. However, those sparsely distributed points only need
to be cut a seldom times to stop in a subspace.
The IForest algorithm is an unsupervised method. First, it randomly selects a feature from
the training data set and then randomly selects a split point between the maximum and minimum
values of the feature. Points smaller than the split point enter the left branch, and points greater
than or equal to the split point enter the right branch. Thereafter, repeat the abovementioned
process is repeated until only one sample or similar samples are left. If the tree depth limit is
reached in repeating the aforementioned process, then the process will be skipped. Finally, IForest
indicates the degree of “isolation” of a sample point by the path length.
Supposing h(x) denotes the number of edges of the binary tree that x passes through in the
process of sample point x from the root node to the external node, also known as the path length.
Smaller sample path length generally corresponds to a higher degree of “isolation” of this sample.
The formula h(x) is given as follows:
h (x) = e + C(n) (10)
The abovementioned formula e indicates the process of x from the root node of the subtree
iTree to the leaf node, that is, the number of edges x passes through the iTree. C(n) indicates the
average path length of the binary tree constructed using n sample data, and the formula of C(n)
is given as follows:
2(n − 1)
C(n) = 2ln (n − 1) + γ − (11)
n
The aforementioned formula γ indicates the Euler constant. Supposing S (x, n) indicates the
abnormal value of x, the formula S (x, n) is shown as follows:
− E(h(x))
S (x, n) = 2 C(n) (12)
E(h(x)) indicates the average path length of x in all iTree. If S (x, n) ∈ [0.5, 1], then the value
S (x, n) is proportional to the probability that x is an abnormal point, that is, the larger the
value of S (x, n), which means x is more likely an abnormal point. If S (x, n) ∈ [0.5, 1], then the
value of S (x, n) is inversely proportional to the probability that x is a non-abnormal point, that
is, the smaller value of S (x, n), implies x is less likely an abnormal point.
4 Performance Evaluation
In this section, we first describe the experimental environment and experimental indicators.
Then, we select four benchmark models for comparative experiments. Finally, we give experimental
evaluations of different models.
4.1 Experiment Environment
This paper uses the labeled data set mentioned in Section 3.1 to evaluate our model. This data
set has a total of 3780 pieces of data, 200 of which are marked as Ponzi schemes. First, we select
80% of all data as the training set and 20% of the entire data as the test set for the experiment
to ensure the accuracy and validity of the experimental results. Then, we select the different
proportions of Ponzi and non-Ponzi scheme contracts to conduct experiments for simulating the
proportion of Ponzi and non-Ponzi scheme contracts in a real environment. The proportion isCMES, 2021, vol.127, no.3 1081
set to three gradients, namely PSC: Non_PSC = {0.01:0.99, 0.05:0.95, 0.1:0.9}. We conduct all
experiments five times and took an average of five times as the final result.
4.2 Experiment Index
The number of samples of Ponzi and non-Ponzi scheme contract data is quite different.
Thus, this paper chooses three metrics, namely, Precision, Recall, and F1-score, to evaluate the
performance of the model. The formulas of the three evaluation indicators are given as follows:
Positivetrue
Precision = (13)
Positivetrue + Positiveflase
Positivetrue
Recall = (14)
Positivetrue + Negativeflase
Precision ∗ Recall
F1-score = 2 ∗ (15)
Precision + Recall
4.3 Baseline
This paper selects the following four models as the benchmark model:
• SVM: Its basic model is to define a linear classifier with the largest interval in the feature
space, but it can also classify nonlinear samples by using a kernel function. The core
strategy of the SVM algorithm is to maximize the interval of different types of data, which
can be formalized as a problem of solving second order convex programming. That is, the
SVM algorithm is equivalent to the optimization algorithm for solving second-order convex
programming.
• Random Forest (RF): It is a very representative Bagging integration algorithm. Its basic
idea is to randomly select a part of the sample from the overall sample for training, then
obtain multiple random results, and finally vote on these results. It uses the voted mean as
the final result. The purpose of this way is to avoid poor sample data as much as possible
for improving accuracy.
• Extreme Gradient Boosting (XGBoost) [33]: It is an integrated machine learning algorithm
based on decision trees. It uses gradient boost as the framework and uses additive models
and forward step-by-step algorithms to achieve the learning optimization process. XGBoost
has been applied to many cutting-edge industries because of its excellent performance.
• Light Gradient Boosting Machine (LightGBM): Similar to XGBoost, it is also a member
of the ensemble learning algorithm. However, compared with XGBoost, it does not need
to calculate information gain through all samples. It has built-in feature dimensionality
reduction technology and thus performs faster and uses lower memory than XGBoost.
4.4 Result Analysis
On the basis of the abovementioned description, Tab. 2 and Fig. 8 show the experimental
results of different models. They show the performance evaluation results of the Ponzi scheme
contract detection using the aforementioned algorithms. We enumerate the Precision, Recall, and
F1-score of different algorithms. For the different parameters of each algorithm, we use the
heuristic search to find the best combination of parameters.
The operating system of this experiment is Ubuntu 18.04, Python version: 3.7.4, sklearn
library version is 0.22.1, CPU model is Inter Core i5-8500, memory size is 8 G.1082 CMES, 2021, vol.127, no.3
Table 2: Experimental results data
Algorithm Precision Recall F1-score
SVM 0.26 0.20 0.22
RF 0.37 0.28 0.32
XGBoost 0.40 0.46 0.43
LightGBM 0.47 0.44 0.45
OC-SVM 0.99 0.73 0.84
IForest 0.99 0.80 0.88
Figure 8: Experimental results
For the SVM algorithm, we use Gaussian kernel as the kernel function, and opti-
mizes the kernel coefficient gamma = {0.01, 0.02, 0.03, . . . , 0.1} and the sample class_weight =
{10, 11, 12, . . . , 20}. In the test, the best combination is gamma = 0.08, class_weight = 14. For RF,
we adopt a similar strategy to search for n_estimators = {1, 2, 3, . . . , 100} heuristically, and obtain
n_estimators = 83 as the best value. For XGBoost, we optimize eta = {0.1, 0.15, 0.3}, max _depth, =
{4, 5, 6, 7}, scale_pos_weight = {10, 11, 12, . . . , 20} to obtain the best the combination is eta =
0.15, max _depth, = 6, scale_pos_weight = 20. For LightGBM, we optimize the combination
of n_estimators = {100, 110, 120, . . . , 200}, learning_rate = {0.01, 0.15, 0.3}, scale_pos_weight =
{5, 6, 7, . . . , 15}, and obtain the best combination as n_estimators = 150, learning_rate = 0.01,
scale_pos_weight = 10. The best combination for IForest algorithm is n_estimators = 150,
max _samples = 50. The best combination for OC-SVM is nu = 0.01, kernel = rbf, gamma = 0.02.
For the algorithm parameters not mentioned, we all use the default parameters of the algorithm.
Tab. 2 and Fig. 8 show that the values of Precision, Recall, and F1-score of the IForest
and OC-SVM models are far superior to those of other models. We simulate the performance
difference between IForest and OC-SVM in the real environment to further explore their best
performance by changing the proportion of Ponzi and non-Ponzi scheme contracts in the sample.
The proportion of Ponzi and non-Ponzi scheme contracts set in this paper is PSC : Non_PSC =
{0.01:0.99, 0.05:0.95, 0.1:0.9}. The results are shown in Tab. 3 and Fig. 9.CMES, 2021, vol.127, no.3 1083
Table 3: Data of different proportions of Ponzi and non-Ponzi scheme contracts on the model
Algorithm PSC:Non_PSC Precision Recall F1-score
IForest 0.01:0.99 0.99 0.80 0.88
0.005:0.95 0.95 0.77 0.85
0.1:0.9 0.90 0.78 0.83
OC-SVM 0.01:0.99 0.99 0.73 0.84
0.005:0.95 0.95 0.73 0.82
0.1:0.9 0.91 0.73 0.81
Figure 9: Different proportions of performance of Ponzi and non-Ponzi scheme contracts
From Tab. 3 and Fig. 9, the following conclusions can be made.
1) The performance of the IForest model is much better than that of the OC-SVM model.
2) The performance of the IForest and OC-SVM models gradually decreases as the proportion
of Ponzi scheme contracts increases. The reason is that the proportion of Ponzi and non-Ponzi
scheme contracts increasingly does not meet the definition of anomaly detection problems as the
proportion of Pozi scheme contracts increases. As a result, so the performance of IForest and
OC-SVM gradually declines.
3) The Precision of the IForest model has reached 0.99, and F1-score has also reached 0.88.
Thus, the proposed method is effective for detecting Ponzi schemes contracts, and its performance
is far better than those of other models.
5 Conclusion and Future Work
The Ponzi scheme contracts on the blockchain will cause the asset loss of the user. Thus,
detecting the Ponzi schemes contracts is a vital task. This paper proposes a bytecode-based detec-
tion model of Ponzi scheme contracts, innovatively transforms the classification of Ponzi scheme
contracts into anomaly detection problems, and implements its prototype. First, we extract all the1084 CMES, 2021, vol.127, no.3
features in the bytecode and convert the bytecode into a characteristic matrix. Then, the PCA
method is used to reduce the dimensionality of the characteristic matrix for eliminating the noise
in the characteristic matrix and improving the accuracy of detection. Finally, we use the proposed
bytecode-based anomaly detection algorithm to identify Ponzi scheme contracts. The experimental
results prove that the method proposed is far superior to other methods.
In the future, we will continue to research from two aspects. First, we will continue to dig
deeper into the features contained in the bytecode to further improve the detection of Ponzi
scheme contracts. Second, we hope to build a real-time detection platform in Ethereum to purify
the network environment.
Funding Statement: This work was supported by the Scientific and Technological Project of Henan
Province (Grant No. 202102310340), Foundation of University Young Key Teacher of Henan
Province (Grant Nos. 2019GGJS040, 2020GGJS027), Key Scientific Research Projects of Col-
leges and Universities in Henan Province (Grant No. 21A110005), and National Natual Science
Foundation of China (61701170).
Conflicts of Interest: The authors declare that they have no conflicts of interest to report regarding
the present study.
References
1. Nakamoto, S. (2008). Bitcoin: A peer-to-peer electronic cash system. https://bitcoin.org/bitcoin.pdf .
2. Wang, Y., Tian, Z., Sun, Y., Du, X., Guizani, N. (2020). Locjury: An IBN-based location privacy pre-
serving scheme for IOCV. IEEE Transactions on Intelligent Transportation Systems, 21(1), 30–47. DOI
10.1109/TITS.6979.
3. Tian, Z., Gao, X., Su, S., Qiu, J., Du, X. et al. (2019). Evaluating reputation management schemes of internet
of vehicles based on evolutionary game theory. IEEE Transactions on Vehicular Technology, 68(6), 5971–
5980. DOI 10.1109/TVT.2019.2910217.
4. Qiu, J., Du, L., Zhang, D., Su, S., Tian, Z. (2020). Nei-TTE: Intelligent traffic time estimation based on
fine-grained time derivation of road segments for smart city. IEEE Transactions on Industrial Informatics,
16(4), 2659–2666. DOI 10.1109/TII.2019.2943906.
5. Wrightw, C., Serguieva, A. (2017). Sustainable blockchain-enabled services: smart contracts. IEEE Interna-
tional Conference on Big Data, pp. 4255–4264. Boston, MA, DOI 10.1109/BigData.2017.8258452.
6. Tian, Z., Li, M., Qiu, M., Sun, Y., Su, S. (2019). Block-DEF: A secure digital evidence framework using
blockchain. Information Sciences, 491(3), 151–165. DOI 10.1016/j.ins.2019.04.011.
7. Gu, J., Sun, B., Du, X., Wang, J., Zhuang, Y. et al. (2018). Consortium blockchain-based malware detection
in mobile devices. IEEE Access, 6(1), 12118–12128. DOI 10.1109/ACCESS.2018.2805783.
8. Securities, U., Commission, E. (2017). Report of investigation pursuant to section 21(a) of the securities
exchange act of 1934: The DAO. http://www.virtualschool.edu/mon/Economics/ SmartContracts.html.
9. Palladino, S. (2017). The parity wallet hack explained. Openzeppelin. https://blog.zeppelin.solutions/on-the-
parity-wallet-multisighack-405a%8c12e8f7/.
10. Wikipedia (2017). Ponzi scheme. Eikipedia. https://en.wikipedia.org/wiki/Ponzi_scheme.
11. Higgins, S. (2015). SEC seizes assets from alleged altcoin pyramid scheme. Coindesk. https://www.coi7ndesk.
com/sec-seizesalleged-altcoin-pyramid-scheme.
12. Keirns, G. (2017). Gemcoin ponzi scheme operator hit with $74 million judgment. Bitcoinwiki.
https://bitcoinwiki.co/gemcoinponzi-scheme-operator-hit-with-74-million-judgment/.
13. Chen, W., Zheng, Z., Ngai, E. C. H., Zheng, P., Zhou, Y. (2019). Exploiting blockchain data to detect smart
ponzi schemes on ethereum. IEEE Access, 7, 37575–37586. DOI 10.1109/ACCESS.2019.2905769.CMES, 2021, vol.127, no.3 1085
14. Qiu, J., Tian, Z., Du, C., Zuo, Q., Su, S. et al. (2020). A survey on access control in the age of Internet of
Things. IEEE Internet of Things Journal, 7(6), 4682–4696. DOI 10.1109/JIOT.2020.2969326.
15. Shafiq, M., Tian, Z., Bashir, A. K., Du, X., Guizani, M. (2020). Corrauc: A malicious bot-iot traffic
detection method in iot network using machine learning techniques. IEEE Internet of Things Journal, 8(5),
3242–3254. DOI 10.1109/JIOT.2020.3002255.
16. Li, M., Sun, Y., Lu, H., Maharjan, S., Tian, Z. (2019). Deep reinforcement learning for partially observable
data poisoning attack in crowdsensing systems. IEEE Internet of Things Journal, 7(7), 6266–6278. DOI
10.1109/JIOT.2019.2962914.
17. Morris, D. Z. (2017). The rise of cryptocurrency ponzi schemes. https://www.theatlantic.com/technology/
archive/2017/05/cryptocurrency-ponzi-schemes/528624/.
18. Luo, C., Tan, Z., Min, G., Gan, J., Shi, W. et al. (2020). A novel web attack detection system for
Internet of Things via ensemble classification. IEEE Transactions on Industrial Informatics, 1. DOI
10.1109/TII.2020.3038761.
19. Sun, Y., Tian, Z., Li, M., Su, S., Du, X. et al. (2020). Honeypot identification in softwarized
industrial cyber-physical systems. IEEE Transactions on Industrial Informatics, 1. Early Access, DOI
10.1109/TII.2020.3044576.
20. Swan, M. (2015). Blockchain: Blueprint for a new economy, pp. 1362–1364. England: O’Reilly, pp. 1362-1364.
21. Vasek, M., Moore, T. (2015). There’s no free lunch, even using bitcoin: Tracking the popularity and profits
of virtual currency scams. In: Böhme, R., Okamoto, T. (Eds.), Financial cryptography and data security.
Lecture notes in computer science, pp. 44–61. Berlin, Heidelberg: Springer.
22. Ngai, E. W, T., Hu, Y., Wong, Y. H., Chen, Y. J. et al. (2010). The application of data mining techniques in
financial fraud detection: A classification framework and an academic review of literature. Decision Support
Systems, 50(3), 559–569. DOI 10.1016/j.dss.2010.08.006.
23. Bartoletti, M., Pes, B., Serusi, S. (2018). Data mining for detecting bitcoin ponzi schemes. 2018 Crypto Valley
Conference on Blockchain Technology, pp. 75–84. Zug, Switzerland, DOI 10.1109/CVCBT.2018.00014.
24. Bartoletti, M., Carta, S., Cimoli, T., Saia, R. (2019). Dissecting ponzi schemes on ethereum: Iden-
tification, analysis, and impact. Future Generation Computer Systems, 102(3–4), 259–277. DOI
10.1016/j.future.2019.08.014.
25. Pang, Y., Peng, L. Z., Chen, Z. X., Yang, B., Zhang, H. L. (2019). Imbalanced learning based on adap-
tive weighting and gaussian function synthesizing with an application on android malware detection.
Information Sciences, 484(1), 95–112. DOI 10.1016/j.ins.2019.01.065.
26. Mi, Y., Liu, W., Shi, Y., Li, J. (2020). Semi-supervised concept learning by concept-cognitive
learning and concept space. IEEE Transactions on Knowledge and Data Engineering, 1. DOI
10.1109/TKDE.2020.3010918.
27. Chen, W. L., Zheng, Z. B., Cui, J. H., Ngai, E., Zheng, P. et al. (2018). Detecting ponzi schemes on ethereum:
Towards healthier blockchain technology. Proceedings of the 2018 World Wide Web, pp. 1409–1418. Geneva,
Switzerland, DOI 10.1145/3178876.3186046.
28. Turk, M., Pentland, A. (1991). Eigenface for recognition. Journal of Cognitive Neuroscience, 3(1), 71–86.
DOI 10.1162/jocn.1991.3.1.71.
29. Schölkopf, B., Williamson, R. C., Smola, A. J., Shawe-Taylor, J., Platt, J. C. (1999). Support vector method
for novelty detection. Advances in Neural Information Processing Systems, 12, pp. 582–588.
30. David, M. T., Duin, R. P. (2004). Support vector data description. Machine Learning, 54(1), 45–66. DOI
10.1023/B:MACH.0000008084.60811.49.
31. Liu, F. T., Ting, K. M., Zhou, Z. H. (2008). Isolation forest. 2008 Eighth IEEE International Conference on
Data Mining, pp. 413–422. Pisa, Italy, DOI 10.1109/ICDM.2008.17.
32. Liu, F. T., Ting, K. M., Zhou, Z. H. (2012). Isolation-based anomaly detection. ACM Transactions on
Knowledge Discovery from Data, 6(1), 1–39. DOI 10.1145/2133360.2133363.
33. Chen, T. Q., Guestrin, C. (2016). XGBoost: A scalable tree boosting system. Proceedings of the 22nd ACM
SIGKDD International Conference on Knowledge Discovery and Data Mining, pp. 785–794. New York, NY,
USA, DOI 10.1145/2939672.2939785.You can also read