Network assessment - Waka Kotahi NZ Transport Agency
←
→
Page content transcription
If your browser does not render page correctly, please read the page content below
Page 40
5. Network assessment
This Chapter provides an understanding of the current and forecast network performance in terms of the
pressures on, and opportunities provided by, an improved transport network. It highlights the outcomes
provided by the WNC programme and WNC package including fulfilment of the regional plans that provide for
multi-modal access through and within the Wellington CBD. Also identified are the number of new and
permanent jobs, reduced road trauma and journey times, more efficient journeys, and improved resilience of the
transport network.
5.1 Introduction
5.1.1 Roading connections
The topography and geographic constraints have meant that the region has developed a compact urban form
along the transport corridors. SH1 and the NIMT follow a similar alignment near the west coast from Levin in
Horowhenua and extend southwards through Kapiti and Porirua to the Wellington City CBD. SH1 then continues
on to Wellington International Airport.
SH1 is the main road connection in, through and out of the Wellington region. It is a critical link to the lower
North Island, the CBD of Wellington and its sea ports and international airport. As noted in section 3, SH1 from
Levin to Wellington International Airport is classified as a high volume national strategic route under the NZTA’s
State Highway Classification System. This system classifies state highways by freight volume, annual average
daily traffic, proximity to cities, access to ports and airports, and tourism routes.
SH2 and the railway’s Wairarapa Line follow similar alignments between Woodville, just east of Palmerston
North, to Masterton extending south-west through the Wairarapa, the Hutt Valley and on to merge with SH1 at
Ngauranga and the NIMT line at Kaiwharawhara.
SH58 is a vital east-west link between SH1 and SH2. State Highway 53 connects Martinborough to the regional
network at Featherston. State Highway 57 and State Highway 56 connect Levin to Palmerston North, east of
SH1.
5.1.2 Public transport
Public transport in the Wellington region includes services on trains, buses and ferries, which are important
components of the transport network.
Over the 2008-12 period journeys on public transport services account for around 5% of the region’s trips.
Within the same period, public transport mode share during journey to work was 23%.
Patronage on the train services on the western corridor (ie Kapiti line) in the year ending 30 June 2012 was 4.5m,
an increase of 2.7% on the previous year. It is noted that the double tracking of the rail line from MacKays
Crossing to Waikanae was completed in February 2011.
Forecasts available for public transport in the Wellington region show that between 2010 and 2020 patronage is
expected to grow to over 45m trips per year, a slight decrease from the 2009 forecast in the RPTP of 50 million
passengers by 2016. The RPTP states this growth can be accommodated as a consequence of the recent
improvements to rail services. For example, the double tracking of rail services to Waikanae (2011), and the
introduction of the new fleet of Matangi trains (2012).
5.1.3 AADT growth
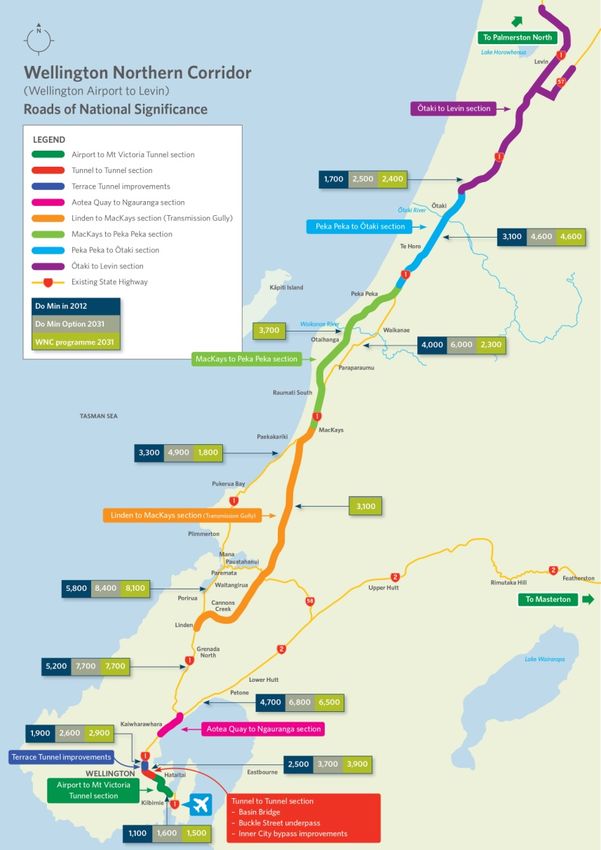
Figure 3 shows AADT growth to 2031 under a do-minimum scenario and with the WNC programme in place. Do
minimum AADT in 2012 is also shown.
NZ Transport Agency Wellington Northern Corridor: Business case: 2013 addendum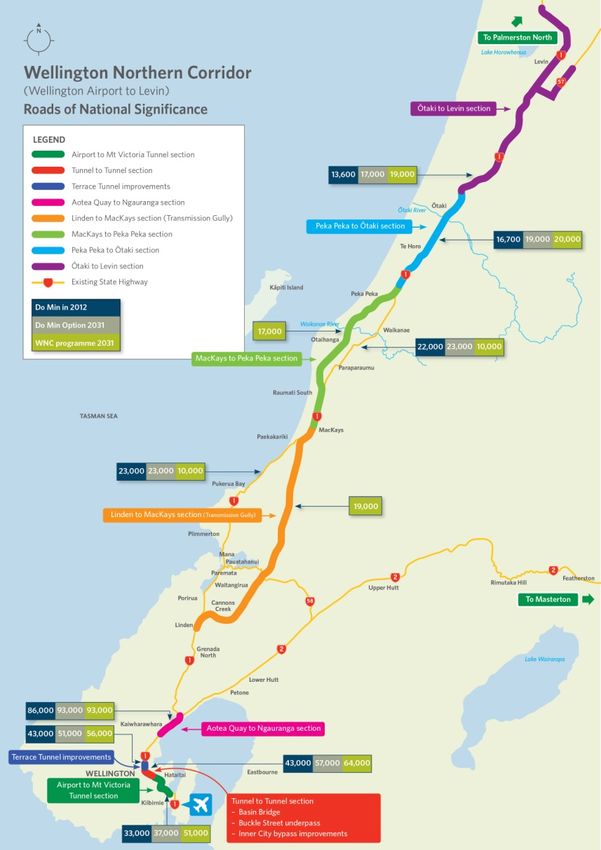
Page 41

Figure 3 Annual Average Daily Traffic (AADT) forecast
5.1.4 Freight road and rail
Figure 4 shows growth in heavy commercial vehicle numbers to 2031 under a do-minimum scenario and with the
WNC programme in place. Do minimum heavy commercial vehicle AADT is also shown.
The changes presented are based on outputs from the WTSM, which estimates the growth in freight volumes for
future years based on land use projections and GDP growth forecast, but does not reflect the potential changes
in freight volumes resulting from infrastructure changes. The estimated WEIs do take account of the
infrastructure changes, and these estimates coupled with the latest forecasts from the National Freight Demands
Study provide the best freight forecasts available at this time.
There is research confirming a relationship between heavy vehicle travel and primary and secondary sector
production which have been used to establish forecasts for heavy commercial vehicle travel. In 2010/11 the
heavy commercial vehicle travel in the Wellington region was 89 million vehicle-km. The Richard Paling Report
(Appendix B) is forecasting an additional 865 jobs which amounts to $500m in GDP PV, which translates into an
additional 1.2 million vehicle-km.

NZ Transport Agency Wellington Northern Corridor: Business case: 2013 addendum
Page 42

Figure 4 Heavy Commercial Vehicle AADT forecast

5.2 Wider economic impacts
5.2.1 Introduction
In some cases conventional economic calculations for a transport project will take into account efficient, reliable
and safe travel benefits, but not the benefits associated with encouraging economic growth and productivity.
However, transport projects of a large scale, such as the WNC programme can have a major effect on levels of
economic activity and productivity. These benefits are generally referred to as WEIs in the EEM.
The EEM provides for the following WEIs to be calculated for large transport projects:
•   Agglomeration,
•   Imperfect Competition,
•   Labour Supply, and
•   Labour Demand.
Importantly, despite being considered a WEI, agglomeration benefits are assessed as part of the WNC
programme’s CEBs.
The “other” WEIs listed above are assessed only for sensitivity testing purposes.

NZ Transport Agency Wellington Northern Corridor: Business case: 2013 addendum
Page 43

Agglomeration benefits

Agglomeration benefits arise when businesses gain economic benefits from being able to interact more
effectively with other similar businesses, and/or through reduced transport costs so achieving higher levels of
productivity.
In the 2009 Business Case, these benefits were assessed to be $195m (in 2009 dollars).

Imperfect competition benefits
CEBs assume that a $10 saving in business travel time results in extra output worth $10. However, markets rarely
work like this (ie they are imperfect) and businesses have some control over price, rather than just the market
setting price. Research has demonstrated there is imperfect competition in several sectors in the New Zealand
marketplace, and this research provides methods to assess benefits associated with imperfect competition.
Imperfect competition benefits were not calculated in the 2009 Business Case.

Labour supply benefits
Labour supply benefits arise when a transport improvement reduces commuting costs to a point that enables
people who would not have otherwise chosen to work to enter the workforce.
Labour supply benefits were not calculated in the 2009 Business Case.

Labour demand benefits

Labour demand benefits arise from businesses setting up new employment centres and increasing the demand
for labour. These are new businesses to the area and are not transfers from other areas.
In the 2009 Business Case, these benefits were assessed to be $331m (in 2009 dollars). However, that
assessment took into account full GDP for the increase in employment rather than the tax wedge component of
that employment, which is a more accurate representation of this benefit.
5.2.2 Patterns of regional development and employment growth
The general patterns of economic activity including employment and freight patterns within the potential area of
influence of the WNC programme have not changed since 2009. Although a census was completed in 2013, this
data is not yet available to update the average earnings per area, the average household incomes by region, or
the employment by industry, and the 2006 census remains the most recent data.

5.2.3 Freight issues
Freight continues to be carried by road, rail and ship into and out of the Wellington region.
The NFDS (2006) remains the most current national freight study that considers all freight movement. The
Ministry of Transport publishes quarterly reports on the Freight Information Gathering System which provides an
overview of freight movements around New Zealand, including containerised freight, rail freight, and bulk coastal
freight, however it excludes road freight.
The NFDS is in the process of being updated to 2013.
The 2009 Business Case noted the NFDS, and a similar regional freight study (Wellington Freight Analysis
Study 26), and noted in particular:
•     In 2006/7, road freight accounted for 91% of outbound inter-regional freight movements and 74% of
      inbound movements,
•     The region’s key road freight destinations are Seaview/Gracefield, Petone, Porirua/Tawa and CentrePort, and

26
     Hyder Wellington Freight Analysis.

NZ Transport Agency Wellington Northern Corridor: Business case: 2013 addendum
Page 44
• The longer distance road movements on SH1 through the Wellington Region between areas to the North and
the South Island were estimated to be 2 million tonnes.
The updated WRLTS identifies freight as a key issue for the region’s transport network, and also identifies
outcomes, targets and actions for the freight task. In particular, it notes the following:
“expected growth in road freight volumes, together with timing needs associated with freight delivery will mean an
increasing contribution of road freight to peak period congestion. Currently, there are significant heavy vehicle flows
along SH1 as well as SH 2 (which links manufacturing centres in Upper and Lower Hutt, as well as Seaview with the
population base and port facilities in Wellington City). Likewise, the effects of congestion on freight movement have
been signalled as a problem which is likely to increase with expected freight volume growth”.
The WRLTS also recognises the following:
“Most freight journeys within the Wellington region tend to be relatively short (less than 20 km) and not easily
transferred to rail”.
The WRLTS sets out two freight-specific targets as follows:
• “Improved regional freight efficiency” - This target seeks to improve road journey times for freight traffic
between key destinations, which will encourage and facilitate economic growth. Key actions to achieve this
include implementation of the Wellington Road of National Significance. This target was developed in
consultation with Horizons (Manawatu-Wanganui region), and is also reflected in the Horizons Regional
Land Transport Strategy, and
• “Improved... freight links to the north of the region”, to ensure “vital links between Wellington and the rest of
the North Island are maintained and improved”. Key actions to achieve this target include: Implementation of
the Wellington Road of National Significance.
The proposed new Clifford Bay Ferry Terminal in Marlborough will improve freight supply chain performance
between the North Island and South Island. The proposed terminal is also expected to improve future
“headroom” for new freight volume and vessels that will serve freight volumes for at least 50 years.
27
GWRC completed a forecasting report for the update of their strategic transport model (WTSM). As part of
this they estimated HCV trips to increase uniformly from 2011 to 2041 to a significantly higher level. This growth
is directly related to increases in GDP per capita and future estimates of employment distribution and is
independent of any transport network changes. In terms of HCV trips this results in an increase from the
existing AM peak number of 10,557 in 2011 to 17,625 in 2041. It is noted that these figures differ with the
forecast increase in freight volumes identified in the NFDS.
5.3 Improved connections to areas of economic growth potential
The Focus Areas identified in the Wellington Regional Strategy (section 3) remain current, and the effect of
increased accessibility provided by the WNC programme on employment levels remains significant. These are
quantified below.
27
Wellington Transport Models: TN24 Baseline Forecasting Report (Opus International Consultants and Arup) Dec 2012.
NZ Transport Agency Wellington Northern Corridor: Business case: 2013 addendumPage 45
5.4 Increasing access to markets
5.4.1 Agriculture
The agricultural products for the Wellington and Manawatu-Wanganui regions, and those processed within the
regions remain:
• forest products,
• meat,
• horticultural products, and
• dairy products.
Forest products
The NFDS remains the most current study forecasting forestry estimates regionally in NZ, expecting 270%
growth of log production in Manawatu-Wanganui by 2031. It is expected that rail will play a role in transporting
forestry products to CentrePort , but road will remain the principal mode of transport.
Meat and dairy products
Access to the market for meat and dairy relies on travel time reliability, but transport costs remain a significant
portion of the export cost.
Horticultural products
Increasing access to market for horticultural products may also increase the demand for the products, and
therefore returns for growers.
5.4.2 Retail and manufacturing
Retail and manufacturing goods continue to be processed or imported in Auckland and Christchurch and
distributed from these centres to other regions. More sophisticated supply chains and reduced inventories in
retail stores are resulting in an increased premium being placed on just-in-time delivery. Thus these goods
remain vulnerable to unreliable travel times and therefore increased costs.
Compared to the existing SH1, the more reliable infrastructure provided by the WNC programme will assist with
increasing access to markets for the agricultural and retail and manufacturing sectors.
5.4.3 Tourism
Tourism remains an important activity within the Wellington and Manawatu-Wanganui regions. Tourism is
estimated to account for 5% of the regional domestic product translating to about $1.4b per year.
The Ministry of Economic Development publishes the number of guest nights spent in each Regional Tourism
Organisation area, which are set out in Table 5-1.
Table 5-1: Annual guest nights by regional destination for the year ended April 2013
Guest Nights Growth Rate
Regional Tourism 2011 2012 2013 2013% 11-12 12-13
Organisation area of total
Manawatu 468,651 471,689 446,720 1% 1% -5%
Wanganui 172,873 176,415 167,767 1% 2% -5%
Wairarapa 193,985 205,101 194,130 1% 6% -5%
Kapiti-Horowhenua 205,882 207,402 211,303 1% 1% 2%
Wellington 2,279,145 2,403,686 2,354,737 7% 5% -2%
New Zealand 31,808,503 31,685,059 31,772,356 100%
NZ Transport Agency Wellington Northern Corridor: Business case: 2013 addendumPage 46
Summary
The Wellington Regional Tourism Organisation area (Wellington, Porirua, Lower Hutt and Upper Hutt) accounts
for 7% of guest nights spent in NZ.
The Kapiti-Horowhenua Regional Tourism Organisation area accounts for 1% of guest nights spent in NZ.
The Manawatu Regional Tourism Organisation area accounts for 1% of guest nights spent in NZ.
Information on tourist expenditure per Regional Tourism Organisation area is set out in Table 5-2.
Table 5-2: Estimated Tourist Expenditure (in $m) by Regional Tourism Organisation area for the year ended June 2011
Regional Tourism Organisation Domestic International Total
area
Manawatu 327 49 376
Wairarapa 106 16 122
Kapiti-Horowhenua 167 26 194
Wellington 1,016 414 1,430
New Zealand 9,315 5,763 15,078
Summary
Expenditure by tourists in the year ending June 2011 in the four Regional Tourism Organisation areas within the
broad area of influence of the WNC programme amounted to about $2b (the sum of Manawatu, Wairarapa,
Kapiti-Horowhenua and Wellington).
rd th
Relative to other Regional Tourist Organisation areas, Wellington has the 3 highest domestic spend and the 4
highest international spend. Auckland and Canterbury top domestic spends, while Auckland, Canterbury and
Queenstown top international spends.
Origins of the tourists visiting the three Regional Tourism Organisation areas of Wellington, Kapiti and
Manawatu and the number of nights tourists stay are shown in Table 5-3 and Table 5-4.
Table 5-3: Tourist day visits to the Wellington, Kapiti and Manawatu Regional Tourism Organisation areas in 2011
Destination
Origin Wellington Kapiti-Horowhenua Manawatu
Wellington 828,937 1,235,212 815,256
Manawatu-Wanganui 516,571 389,920 1,019,606
Other NZ 714,641 196,628 617,192
International 153,320 70,873 88,346
Total 2,213,470 1,892,634 2,540,400
Table 5-4: Visitor nights in the Wellington, Kapiti and Manawatu Regional Tourism Organisation areas in 2011
Destination
Origin Wellington Kapiti-Horowhenua Manawatu
Wellington 232,015 438,068 353,808
Manawatu-Wanganui 400,051 106,172 145,242
Other NZ 3,098,169 313,993 1,020,231
International 3,532,800 274,481 838,331
Total 7,263,035 1,132,713 2,357,612
NZ Transport Agency Wellington Northern Corridor: Business case: 2013 addendumPage 47
Summary
Day visits by tourists continue to be dominated by shorter distance travel (eg 86% of visits to Kapiti originate in
either Wellington or Manawatu), and as identified in the 2009 Business Case, the quality of the road network
remains an important factor in being able to make these trips safely, quickly and reliably.
About half of the visitors spending nights in Wellington are of international origin, reflecting the city’s
importance as a capital and as a large generator of traffic.
The Wellington International Airport Master Plan predicts that by 2030 the current annual international arrivals
of 600,000 will reach almost two million.
5.5 Improvements to journey time reliability
Journey time reliability remains an important component in the development of freight patterns and effective
supply chains. Poor reliability may hinder economic growth, especially in remote areas. Improvements in
journey time reliability reduce the unpredictable level of variation in journey times, which are experienced during
a journey undertaken at broadly the same time every day.
Variability in travel times can be caused by congestion, accidents, other network shocks caused by weather,
natural disasters or spills.
Reliability is expected to improve with the implementation of the WNC programme, particularly with the
completion of Transmission Gully, MacKays to Peka Peka, Peka Peka to Otaki and Petone to Grenada Link Road
and by removing key congestion points on SH1 through Wellington City.
The reliability of a journey can be measured using the standard deviation of the journey time recorded for
journeys between the same origin and destination. The standard deviations of journey time for journeys between
28
Otaki and the Wellington Airport in 2031 under a Do Minimum and WNC programme scenario are shown in
Table 5-5. These are developed using outputs from the transport models for each section of the WNC
programme and application of research that established formulae for the calculation of reliability.
Table 5-5: Standard deviation (minutes) of journey times between Otaki and Wellington Airport in 2031
Direction AM peak Interpeak PM peak
Northbound – Do Minimum 16.9 7.5 54.2
Northbound – WNC 0 0 4.0
Southbound – Do Minimum 53.3 10.1 20.6
Southbound – WNC 4.5 0 0.8
From the above, the WNC programme is expected to significantly reduce journey time variability, such that for
68% (given that one standard deviation represents 34%) of journeys north in the PM peak the variability is
expected to reduce from ±54 minutes to ±4 minutes. Note these predications are based on the outputs from
research, research that is theoretical and as such does not account for practical actions, such as postponing
journeys or taking alternate routes, that road users may take before they tolerate a journey with 54 minutes of
variability. However the predictions demonstrate the relative difference in reliability that can be expected ie for
the northbound PM peak journey time the WNC programme is expected to be over ten times more reliable than
the existing SH1 by 2031.
The NZTA’s assessment framework recognises the link between journey time reliability and economic growth
through its strategic fit assessment. A high assessment is given to a road improvement that has potential for a
nationally significant contribution to economic growth and productivity. This only applies to nationally strategic
state highways where significant improvements in journey time reliability, amongst other characteristics, are
possible.
28
The improvements and demands north of Otaki do not have significant impacts on journey time reliability.
NZ Transport Agency Wellington Northern Corridor: Business case: 2013 addendumPage 48 The WNC programme SARs, PFRs and RMA applications provide assessments for the current journey time reliability and forecast changes based on implementation. The following paragraphs summarise these. 5.5.1 Airport to Mount Victoria Tunnel The SAR identifies the following: “Related to the capacity issues is the issue of trip reliability. With the corridor operating at capacity for lengthy periods, and alternative parallel local road routes also operating at capacity, the highway is prone to trip reliability issues from spikes in traffic demand and also from incidents occurring. The delays that can occur at times are of particular concern for people travelling to the airport, as it can mean they miss flights.” 5.5.2 Tunnel to Tunnel The RMA applications for the Basin Bridge identified the following: “A median journey variability between Willis Street and Evans Bay Parade of between 387 to 932 seconds in a westbound direction and 391 to 784 seconds in an eastbound direction. In other words the same journey taken at the same time of day can vary by a factor of between 2 and 3. This significant variability highlights the level of congestion during peak periods and the difficulty for road users to plan travel times, which is particularly important for those travelling between the CBD and airport.” The detailed PFR for the ICB upgrade identified the following: Journey time data from 2026 SATURN has been used to analyse changes in travel time variability on SH1 (Karo Drive and Vivian Street) in the study area. In the do minimum the difference in journey times on SH1 between the different peak periods is 12 to 16 seconds. In Option 2 the difference reduces to 9 to 11 seconds. 5.5.3 Terrace Tunnel The analysis currently available is at a preliminary level and an assessment of journey time reliability is yet to be completed. 5.5.4 Aotea Quay to Ngauranga The SAR identifies the mean travel time and the 10th percentile and 90th percentile travel times for the routes along the state highway between Hobson Street and Petone, and states: “For northbound traffic, 80% of journeys are between 200 and 250 seconds between these two points for most of the day. During the PM peak, variability increases such that 80% of journeys are between 200 and 600 seconds. For southbound traffic, for most of the day journey times between the Petone Weighbridge and Hobson Street are between 200 and 250 seconds. During the AM peak, variability increases such that journey times are typically between 250 and 550 seconds.” The SAR states that a similar pattern is observed for journey times on the other routes within the project area which includes Hutt Road. 5.5.5 Transmission Gully The RMA applications for Transmission Gully stated the following with regard to effects on travel time variability: “The variability or uncertainty of travel times in the existing SH1 corridor is a significant issue. As a result of significant reductions in regular congestion and in random incidents such as crashes, the Project would eliminate virtually all travel time variability between Linden and MacKays Crossing, with a very low residual level of variability in 2026. This is an important benefit of the Project, enabling individuals and businesses to plan their travel with a much greater degree of certainty. Without the Project, rising traffic demands will increase the frequency, duration and severity of congestion in the corridor. Modelled travel times for the years 2006 and 2026 indicated that under normal traffic flow conditions, travel times may be increased by as much as 14% on existing SH1 over this period. This will be accompanied by increases in the variability of travel times, and magnified as a result of incidents when they occur.” NZ Transport Agency Wellington Northern Corridor: Business case: 2013 addendum
Page 49

5.5.6 MacKays to Peka Peka
The RMA applications for the MacKays to Peka Peka section stated the following with regard to effects on travel
time variability:
“Although not directly forecast by the models (which predict average journey times), travel time variability is
known to increase as traffic levels approach the capacity of the network, as expected in the Kāpiti corridor
without the Project. Therefore the significant increase in capacity provided as part of the Project is expected to
significantly improve journey time reliability;
Greatly improved travel time reliability arises from reduced congestion, meaning that travellers will have more
certainty regarding their expected arrival times at their destination, especially important for freight movements.”
5.5.7 Peka Peka to Otaki
The RMA applications for the Peka Peka to Otaki section stated the following with regard to effects on travel
time variability:
“Motorists currently experience variable travel times when travelling through the Project area, particularly on
weekends and holidays. This variability is generally caused by delays which occur as a motorists travel through
the Ōtaki Railway Retail area.
With the Expressway constructed, motorists will be able to bypass this area. Motorists who choose to stop in
Ōtaki will also experience improved performance of the existing SH1 due to the reduction in traffic. These
improvements in journey time reliability will also benefit Heavy Commercial Vehicles. The Ōtaki bypass also
means HCVs do not need to accelerate or decelerate for intersections or when travelling through the Ōtaki urban
area which will improve their operating efficiency.
There is the potential for some journey time variability to occur on holiday weekends as a result of constraints to
the north of the Project area where the Expressway and SH1 becomes a single lane in each direction.”
5.5.8 Otaki to Levin
The improvements within the Otaki to Levin section concentrate on addressing safety risks, and an assessment
of journey time reliability is yet to be completed.

5.6 Easing of severe congestion
The existing state highway between the Wellington International Airport and Levin remains significantly variable
in terms of congestion, with severe congestion occurring during the peak periods, weekends and holiday periods
on the sections around Wellington City and localised points north.
SH2 between Petone and Ngauranga is a key route in that it is severely congested during peak periods, and is a
key determinant for the congestion that occurs at the Ngauranga interchange on SH1.
Journey times during peak periods for the WNC programme have been measured using WTSM and the project
models (see the Opus report for more details). Table 5-6 and Table 5-7 show the (inbound) southbound travel
times during the AM peak period and the (outbound) northbound travel times during the PM peak period,
respectively for the sections of the WNC programme.
It is noted that travel time data for the section between Linden and Ngauranga is excluded from Table 5-6 and
Table 5-7. It is, however, noted that the Petone to Grenada Link Road is expected to save four minutes in 2031
for the AM peak southbound trip and eight minutes in 2031 for the PM peak northbound trip on the section of
SH1 between Linden and Ngauranga
It should also be noted that the peak period may have expired by the time a trip reaches a section (eg if a trip
begins at Levin in the peak period, by the time that trip reaches the Wellington International Airport section the
peak may have expired).

NZ Transport Agency Wellington Northern Corridor: Business case: 2013 addendum
Page 50

Table 5-6: Travel times for the sections of the WNC programme in the AM peak southbound

Section                              2031 Do                  2031 WNC               2031 Travel
                                     Minimum                  programme              Time Savings
                                     (mins)                   (mins)                 (mins)
                  29
Levin to Otaki                           21.8                    20.5                     1.3
Otaki to Peka Peka                        9.2                     7.3                     1.9
Peka Peka to MacKays                     18.8                     9.6                     9.2
                           30
MacKays to Linden                        23.7                     16.3                    7.3
                           31
Linden to Ngauranga                      n/a                      n/a                     n/a
Ngauranga to Aotea                       15.9                     7.5                     8.4
Terrace Tunnel                            7.6                     3.4                     4.1
Tunnel to Tunnel                         4.6                      3.6                     1.0
Mt Vic to Airport                         9.7                     7.8                     1.9
Southbound Total                         111.2                   76.1                     35.1

Table 5-7: Travel times for WNC programme in the PM peak northbound
Section                         2031 Do Minimum              2031 WNC              2031 Travel Time
                                     (mins)              programme (mins)           Savings (mins)

Airport to Mount Victoria                8.5                      7.0                      1.4
Tunnel
Tunnel to Tunnel                         11.1                     7.5                      3.6
Terrace Tunnel                           2.1                      2.0                      0.1
Aotea Quay to                            7.5                      6.0                       1.5
Ngauranga
Ngauranga to Linden 32                  n/a                       n/a                      n/a
                           33
Linden to MacKays                       23.0                      16.2                     6.8
MacKays to Peka Peka                    26.1                      9.6                      16.5
Peka Peka to Otaki                       9.1                      7.3                       1.8
                  34
Otaki to Levin                          22.3                     20.9                      1.4
Northbound Total                       109.7                     76.5                      33.1

29
  The travel times for this section are derived from modelling completed as part of the O2L Scoping Report which used 2041
as the modelling forecast year as well as the PFRs completed in April 2013. This section includes for speed limit reductions in
the Manukau and Ohau settlements, however we do not have travel time changes associated with these projects.
30
  This section is Transmission Gully. The modelling that establishes these travel times was undertaken for the modelling
year 2026, not 2031.
31
  Although P2G link road will reduce travel times along this section of SH1, it is not a formal part of the WNC programme so
these effects are excluded.
32
     as for footnote 27.
33
  This section is Transmission Gully. The modelling that establishes these travel times was undertaken for the modelling
year 2026, not 2031.
34
  The travel times for this section are derived from modelling completed as part of the Scoping Report which used 2041 as
the modelling forecast year as well as the PFRs completed in April 2013. This section includes for speed limit reductions in
the Manukau and Ohau settlements, however we do not have travel time changes associated with these projects.

NZ Transport Agency Wellington Northern Corridor: Business case: 2013 addendum
Page 51 Summary The above tables show significant travel time savings once the WNC programme is in place for the main flows south into the CBD in the AM and north from the CBD in the PM. However, other routes such as the route from the Airport to the CBD also have travel time savings which are provided in Appendix A as well as for travel times outside of peak periods. 5.7 Improving transport efficiency Travel time savings and a reduction in the variability of travel times result in improved transport efficiency. This efficiency enhances the connections between the three main urban areas within the Wellington region and inter- regionally for passengers and freight. The traffic modelling indicates that the implementation of the WNC programme will result in regular travel time savings of about 30 minutes over the route or about 25%. More detail of how these efficiencies relate to the quantitative benefits of the WNC programme is set out in later in this section. 5.8 Alternatives and options The sections that make up the WNC programme were predicated on a series of strategic transport studies identified in the 2009 Business Case. Consideration, including public consultation, of alternatives and option testing was undertaken as part of the development of these studies (for example, the Ngauranga to Airport Strategic Study considered a “public transport only option”). Consideration of alternatives and option testing has continued as part of the investigation and development phases for each section of the WNC programme. All of the public engagement programmes for each section have sought feedback on the options considered. In some cases the project scope for some of the sections has been amended as a result of option testing and the public engagement process. See each section’s completed SAR for further information on the alternative and option consideration processes. 5.9 Quantifying the wider economic impacts 5.9.1 Introduction The following WEIs have been calculated for this Addendum: • agglomeration, • imperfect competition, • labour supply, and • labour demand. The following paragraphs summarise the quantification of the above WEIs. For more detail of how these are calculated refer to the Richard Paling Report (Appendix B). There are also other benefits that may be described as WEIs that are associated with the increase in employment while the WNC programme is under construction, eg existing businesses providing services to construction workers. 5.9.2 Agglomeration impacts The assessment of the agglomeration impacts has been undertaken in accordance with the approach set out in the EEM. The area of influence used for estimating agglomeration is the corridor from the Wellington Airport to Otaki. This is in line with international best practice which considers agglomeration to occur when populations exceed certain thresholds. NZ Transport Agency Wellington Northern Corridor: Business case: 2013 addendum
Page 52

In the 2009 Business Case, the agglomeration benefits estimate was completed for the area covered by the
Wellington City Transport Model (which covers from Miramar to Johnsonville). International work suggests that
it is now appropriate to extend the area for the estimation of agglomeration benefits to Otaki.
The PV of the estimated benefits amounts to $410m. The benefits represent 1.5% of the annual GDP of the
                        35
Wellington Region area.
It is noted that the Petone to Grenada Link Road is also expected to generate significant additional agglomeration
benefits in the order of $310m PV. As such, if the Petone to Grenada Link Road proceeds as programmed in
order to make the WNC programme more effective, the expected combined agglomeration benefits would be in
the order of $720m PV.

5.9.3 Imperfect competition
As identified in the Richard Paling Report (Appendix B), imperfect competition benefits are calculated to be
$130m PV. The benefits would represent an annual increase in the GDP of the Wellington Region of 0.5%. The
EEM provides for imperfect competition benefits to be calculated for sensitivity testing purposes.

5.9.4 Labour supply
As identified in the Richard Paling Report, 35 jobs will be created by 2021 climbing to 185 in 2031 as a
consequence of improved accessibility and reduced commuting costs. The Richard Paling Report estimates that
this will result in benefits of $35m PV.
The EEM provides for labour supply benefits to be calculated for sensitivity testing purposes.
5.9.5 Labour demand
In the 2009 Business Case only the employment effects associated with increased labour demand were
estimated under the section titled “Employment Impacts”. For clarity this Addendum separates the components
of employment impacts into those associated with increased labour supply and labour demand.
The Richard Paling Report identifies that in addition to the 185 jobs identified through the labour supply WEI,
680 additional jobs are expected to be generated from the WNC programme due to increased demand for
labour. This increase of 680 is spread across the Territorial Authorities (TAs) as shown in the tables below.
Table 5-8: Estimation of increase in demand for labour for the Levin-MacKays section of WNC programme
TAs in Area of              Employment in Area of              Employment                 Increase in
Influence                      Influence 2012                Generation Factors          Employment
Palmerston North                   44,750                          0.1%                  Not evaluated
                                                                                           at TA level
Manawatu                             9,150                           0.1%
Horowhenua                           7,950                           0.1%
Kapiti Coast                         11,600                          0.2%
Porirua                              14,200                          0.2%
Total                               87,650                          (0.13%)                    115

Table 5-9: Estimation of increase in demand for labour for the MacKays-Wellington Airport section of WNC programme
TAs in Area of              Employment in Area of              Employment                 Increase in
Influence                      Influence 2012                Generation Factors          Employment
Horowhenua                          7,950                          0.1%                  Not evaluated
                                                                                           at TA level
Kapiti Coast                         11,600                          0.2%
Porirua                              14,200                          0.2%

35
     The Wellington regional GDP ending March 2010 was $26,858m.

NZ Transport Agency Wellington Northern Corridor: Business case: 2013 addendum
Page 53 Hutt 42,400 0.2% Wellington 140,300 0.3% Total 216,450 (0.26%) 565 These estimates assume that the levels of employment remain as they are today. However, there are several development areas within Wellington that will increase these levels of employment significantly. For example, if the planned development sites at Miramar, Lincolnshire Farm, and Paraparaumu Airport proceed it can be expected that up to 3,700 new and permanent jobs will be created. An important difference to the 2009 Business Case is that, in 2009 the GDP associated with new jobs was used to determine the dollar value benefits associated with these new jobs. While GDP is a good indicator of the overall benefits it has the potential to overestimate benefits. A more accurate representation of benefits for the labour demand WEI is to use the tax component of the GDP generated by these new jobs. The reason for including the tax component is that it is a more accurate proxy for the additional benefits achieved by Government investing in other programmes. Accordingly, labour demand benefits are estimated to be $230m PV. As an indicator of benefit to the region the full GDP amounts to $715m PV. 5.9.6 Construction workers A significant number of additional jobs are anticipated to be created during project construction. Over the course of delivering the WNC programme a total of 8,000 FTE construction jobs are expected to be created. These are construction jobs, associated with constructing the programme (ie excluding those professional service consultants used to undertake investigation/consenting work). When considering the programme for delivering the projects, at any one time we expect on average 650 construction workers working on the programme, and peaking at 1,000 in 2018. 5.9.7 Overall assessment In summary the total number of WEIs are summarised in Table 5-10. Table 5-10: Summary of wider economic benefits WEIs PV of benefits • Agglomeration* $410m • Imperfect Competition $130m • Labour Supply $35m • Labour Demand $230m Total $805m *Agglomeration benefits are treated as a conventional benefit. 5.10 Economic assessment 5.10.1 Introduction The BCR was calculated in the same manner as completed in 2009. In short, the annual benefits and costs for each section of the WNC programmes were re-calculated at a project level and adjusted to 2012 dollars, then staged as per the proposed programme. A full description of the process is identified in the Opus Report (Appendix A). A peer review of the economic assessment was completed by Beca and their report and response is included in Appendix A. All of the benefits and the costs associated with the Petone to Grenada Link are included for sensitivity test purposes only (thus differing from the 2009 Business Case). In the 2009 Business Case, the travel time benefits of the Petone to Grenada Link were included in the programme evaluation, although the benefits associated with vehicle operating costs and crash reductions were not included. NZ Transport Agency Wellington Northern Corridor: Business case: 2013 addendum
Page 54

5.10.2 Transportation modelling
As set out in the Opus report, three transport models have been used to evaluate the CEBs (eg travel time
benefits).
As for the 2009 Business Case, the transportation modelling for the WNC programme has assumed that a
number of projects are in the Do-Minimum scenario in forecast years ie 2021, 2031, and 2041. These projects,
and other detailed assumptions, are identified in the Opus Report.
5.10.3 Travel time
In 2010, the NZTA modified their annual surveys to include specific monitoring of the existing SH1 to cover the
extents of the WNC programme. The monitoring included travel times and average travel speeds. The results
for travel times are shown in the figures below.

Figure 5 Average Travel Times between Wellington Airport and Levin

NZ Transport Agency Wellington Northern Corridor: Business case: 2013 addendum
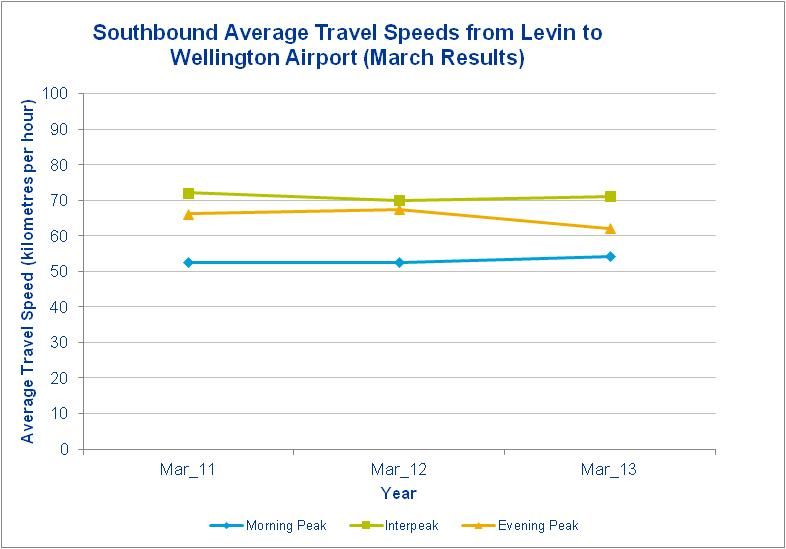
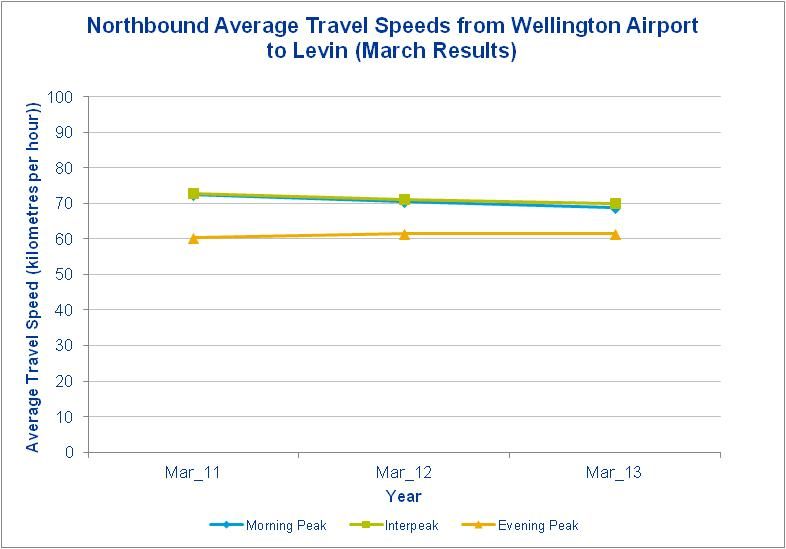
Page 55

Figure 6 Average Travel Times between Levin and Wellington Airport
The change in average travel speeds are shown in the figures below.

Figure 7 Average Travel Speeds from Wellington Airport and Levin

NZ Transport Agency Wellington Northern Corridor: Business case: 2013 addendum
Page 56

Figure 8 Average Travel Speeds from Levin to Wellington Airport
5.10.4 Level of service
The current Level of Service provided by SH1 is measured by the recorded traffic volume over the theoretical
capacity of the highway.
The Level of Service ratings used in NZ are adopted from the American Association of State Highway and
Transportation Officials (AASHTO) Highway Capacity Manual. These are based on vehicle headways, which are
a measurement of the distance or time between vehicles in a transit system.

NZ Transport Agency Wellington Northern Corridor: Business case: 2013 addendum
Page 57

Table 5-11: Level of Service descriptions
Level of       Average delay per vehicle     Traffic signals and roundabouts
Service        (seconds)
    A          80                           Traffic volumes typically exceed capacity

Where identified in the investigations completed since 2009 the most recent Levels of Service have been
extracted and are shown in Table 5-12.
Table 5-12: Current Level of Service
  Section        Location                                                           AM          PM
Airport to       SH1 Cobham Drive                                                   D           C
Mt Victoria      SH1 Kilbirnie Crescent                                             E           D
Tunnel to        SH1 (Terrace Tunnel and Buckle Street)                             E           E
Tunnel           Adelaide Road (northbound)                                         E           E
                 SH1 Mount Victoria Tunnel (in both directions)                     E           E
                 John Street eastbound                                              E           n/a
                 Cambridge Terrace                                                  n/a         E

                 Oriental Parade (eastbound)                                        n/a         E
                 Willis Street (southbound)                                         n/a         E
                 Victoria Street (southbound)                                       n/a         E
Ngauranga        SH1 Ngauranga to Tawa                                              E           E
 to Linden
Linden to        SH1 intersections with Teihana Road, Wairaka Road, Pukerua         D/E         D/E
MacKays          Beach Road, Steyne Avenue, Grays Road, Pope Street, Acheron
                 Road, Mana View Road, and Pascoe Avenue
MacKays to       SH1 intersection with Kapiti Road                                  E           E
          36
Peka Peka        SH1 intersection with Elizabeth Street                             C           C
                 SH1 intersection with Te Moana Road                                B           B

Note that when a route has a Level of Service E capacity has been reached and the effect of more traffic is to
extend queues. As a result the peak period gets longer in duration. For the Wellington CBD area, travel
behaviour is expected to change under these conditions with people using alternative routes such as Evans Bay
Parade and Oriental Parade instead.
Recent surveys (March 2013) identify the current Congestion Travel Index (CTI - the mean travel time on a given
route at a particular time over the free flow travel time for a route), and the minutes of delay per km of travel. A
CTI of zero represents uncongested free-flowing conditions, and the higher the indicator, the greater the degree
of congestion. Maps presenting the results of these surveys are in Appendix D.
5.10.5 Vehicle operating costs
                                                            37
In 2021, the annual savings in vehicle operating costs for the WNC programme are approximately $12.6 million.
By 2031 these savings are expected to rise to $17.3 million. The associated carbon dioxide emission cost
reductions are $0.7 million in 2031.

36
     Note these are 2026 Do Minimum Levels of Service.

NZ Transport Agency Wellington Northern Corridor: Business case: 2013 addendum
Page 58
5.10.6 Improvements in road safety
The road safety of SH1 is described by the reported fatal and serious crashes over the past five years (Table
5-13).
Table 5-13: Reported Fatal and Serious Crashes Jan 2008 – Dec 2012
WNC section Fatal Serious
Airport to Mount Victoria Tunnel 1 14
Mount Victoria Tunnel to Terrace Tunnel 2 5
Terrace Tunnel to Aotea 0 7
Aotea Quay to Ngauranga 2 3
Ngauranga to Linden (Petone to Grenada) 2 17
Linden to MacKays (Transmission Gully) 4 15
MacKays to Peka Peka 4 16
Peka Peka to Otaki 2 12
Otaki to Levin 1 16
Total 18 105
38
The recent KiwiRAP initiative also describes road safety and demonstrates the poor safety record of SH1 as it
has one of the highest numbers of fatal and serious crashes per kilometre in New Zealand, especially the section
between Paraparaumu and Levin which averages 0.23 fatal and serious injury crashes per kilometre per year.
This is similar to the 0.21 result for the section of SH2 from Pokeno (SH1) to Mangatarata (SH25) in the Waikato
and Bay of Plenty region.
With the WNC programme in place the reduction in cost associated with crashes is calculated to provide annual
benefits of $27.0 million. Many (over 80%) of these safety benefits occur for the sections from Transmission
Gully north.
Note the crash record of the Ngauranga to Linden (Petone to Grenada) section is shown however this may not
equate directly with crashes on the Petone to Grenada Link Road. This is the same for the other off-line sections
ie Linden to MacKays, MacKays to Peka Peka, and Peka Peka to Otaki.
Different to the 2009 Business Case, the crash benefits are calculated for all of the sections of the WNC
programme in this Addendum. This information is now available from the completion of the various SARs and
PFRs.
5.10.7 Safety analysis
Forecasting the reduction in fatal and serious crashes is possible by using crash prediction models for a five-year
period with and without implementing the WNC programme.
The procedure for evaluating this forecast involves factoring the historical crash record contained in Table 5-13
to account for under reporting, and then weighted for use in crash prediction models. This results in a forecast
five-year total fatal and serious crash number of 142 in 2031 under a Do Minimum scenario. For that same year
37
The NZTA provides values for vehicle operating costs categorised into running costs, road surface related costs, speed
change cycle costs, congestion costs, and costs while at a stop. Values are provided by vehicle classes and for standard traffic
compositions on four different road categories. Refer to Appendix A5 of the economic evaluation manual.
38
NZ Road Assessment Programme. It is a partnership between the NZ Automobile Association, NZ Transport Agency,
Ministry of Transport, ACC and NZ Police with a purpose of analysing the road safety of the state highway network.
NZ Transport Agency Wellington Northern Corridor: Business case: 2013 addendumPage 59
with the programme in place the forecast number of fatal and serious crashes is 102, indicating that the WNC
programme is estimated to save 40 fatal and serious crashes per five year period by 2031.
According to the most recent five years’ of historical crash data on NZ state highways, fatal crashes contribute
19.8% of the sum of fatal and serious crashes. However, as a consequence of implementing the WNC
programme, the same figure drops to 9.7%. Therefore, we can expect that of the 40 fatal and serious crashes
saved, 18 of these will be fatal crashes. These savings are shown for each section in the table below.
Table 5-14: Predicted savings in Fatal and Serious Crashes for a 5-year period in 2031 by WNC programme section
WNC programme section Fatal and serious crash
savings
Airport to Mount Victoria Tunnel 0
Tunnel to Tunnel 0
Terrace Tunnel to Aotea 0
Aotea Quay to Ngauranga 0
39
Ngauranga to Linden n/a
Linden to MacKays (Transmission Gully) 8
MacKays to Peka Peka 11
Peka Peka to Otaki 5
Otaki to Levin 5
Total 29
The predicted savings on SH1 between Ngauranga and Linden as a result of Petone to Grenada Link Road is 11
fatal and serious crashes. These are not included in the savings benefits. It should be noted that there will be
fatal and serious crashes generated by the new road (and also for other new off-line improvements), which have
not been calculated since the design of the road has not been finalised.
The detail for the procedure for this is found in Appendix E.
39
Although P2G link road will reduce safety risk along this section of SH1, it is not a formal part of the WNC programme so
these effects are excluded.
NZ Transport Agency Wellington Northern Corridor: Business case: 2013 addendumPage 60
5.10.8 Programme benefit cost ratio
A summary of the individual BCRs for each section of the WNC programme calculated in accordance with the
programme is included in the table below.
Table 5-15: Summary of overall WNC programme BCR
WNC programme section Expected Costs NPV Benefits NPV BCR
Costs ($m) ($m)
($m)
Airport to Mount Victoria Tunnel 363.8 235.5 144.4 0.6
Tunnel to Tunnel 94.8 82.9 262.9 3.2
Terrace Tunnel improvements 181.5 104.5 161.8 1.6
Aotea Quay to Ngauranga 84.1 75.1 166.9 2.2
Ngauranga to Linden 40 n/a n/a n/a n/a
Linden to MacKays (Transmission 847.1 536.6 927.5 1.5
Gully)
MacKays to Peka Peka 554.2 473.0 513.9 1.1
Peka Peka to Otaki 249.8 175.1 140.1 0.8
Otaki to Levin 161.9 161.9 190.6 1.2
Agglomeration benefits 410.0
Programme BCR 2,857 2,228 3,206 1.6
5.10.9 Adjusted Programme BCR to include Wider Economic Impacts
The “other” WEIs (excluding agglomeration) have a PV of $395m. Inclusion of these benefits increases the BCR
for the programme from 1.6 to 1.8.
5.10.10 Sensitivity tests
To establish how sensitive the benefits of the WNC programme are to different scenarios in the future a number
of BCR scenario tests have been undertaken as follows:
Petone to Grenada Link Road
In the 2009 Business Case the Petone to Grenada Link Road was included in the BCR, albeit without the benefits
associated with reduced crashes and vehicle operating costs. In this Addendum the benefits, including
agglomeration and the costs are treated as a sensitivity test, and include in the WNC package. The
agglomeration benefits associated with the link road are $330m.
The expected costs and benefits used in the project BCR for the Petone to Grenada Link are identified in Table
5-16.
Variable Trips Benefits
The EEM states that variable vehicle trip matrix methods are to be used for all complex improvements unless:
• It can be demonstrated that the congestion level expected throughout the analysis period in the do-minimum
or option will not be substantial, and the peak period passenger transport mode share is less than 15 %, or
• The preliminary evaluation shows that the fixed trip matrix benefits are unlikely to differ by more than 10%
from those from a variable trip matrix approach.
40
Although Petone to Granada link road is a key RoNS Network Plan project that seeks to address issues between Ngauranga
Gorge and Linden it is not included (its benefits including agglomeration and costs) in the base BCR, since it is part of the
wider WNC package, but not part of the WNC programme.
NZ Transport Agency Wellington Northern Corridor: Business case: 2013 addendumPage 61 Contrary to the above, most of the WNC programme project models are based on fixed vehicle trip matrices. The effect of this is to assume that there will be no induced trips following completion of the programme resulting in fewer transport benefits being generated by the programme. Background research has been completed to understand the level of this estimation for the WNC programme. This indicates that the conventional benefits are underestimated by 7.2%. The sensitivity test applies the additional benefit on those projects within the programme that are modelled using a fixed matrix approach. Wider Economic Impacts Agglomeration benefits are a WEI which is included in the primary BCR as shown in Table 5-15. The “other” WEIs are applied in increments in the sensitivity tests (ie the first test includes imperfect competition and increased labour supply, and second test adds labour demand benefits). Cost Estimates The costs used in the base BCR are within a likely range of costs, and represent the 50th percentile costs. As the cost to deliver the WNC programme will vary, a “cost” sensitivity test has been undertaken. This test seeks to account for various factors that may influence the cost to deliver the programme such as various methods of procuring and delivering the sections (eg alliances, early contractor involvement, public-private partnerships), and also for changes in the market competing for this work. Each sensitivity test does not seek to account for inflation as escalation is excluded from the EEM procedures. Two tests are applied: one for a low cost (20% less than expected cost for entire programme), and secondly for a high cost. The high cost scenario utilises the 95th percentile costs from scheme estimates where available, otherwise an increase of 20% in the expected estimate has been adopted. Benefit Evaluation Period and Discounting Rate The primary BCR is determined using a 40-year analysis period and a 6% discount rate, as per current NZTA policy. In order to provide a comparison with the primary BCR identified in the 2009 Business Case (ie 1.2) a 30-year evaluation period and 8% discount rate has been undertaken (excluding sunk costs). A 60-year analysis period and 4% discount rate are also tested for comparison purposes. These tests are undertaken to reflect the enduring nature of the WNC programme (ie the projects are expected to provide benefits well beyond 40 years). Benefits Capping The benefits for the WNC programme are determined from the transport model outputs in certain years, typically 2021 and 2031 (see the Opus Report). This provides annual benefits between these two modelling years, however, what happens to the benefits beyond the last modelling year is less certain. Reasons for this uncertainty are many and include peak spreading (ie duration of the peak period lengthens), lack of reliability about future demographic projections, potential for mode shift under very severe congestion and high fuel prices, all of which could limit the benefit stream beyond 2031. To allow for such a scenario, this sensitivity test determines the impacts on the BCR of capping the annual benefits beyond 2031 to the 2031 level, and another test for the 2041 level. Growth Scenarios WTSM utilises various demographic assumptions, in terms of population, employment and associated issues that are used for each project’s economic evaluation. These are known to vary and to account for the uncertainty associated with demand. WTSM contains a low, medium and high projection of growth across the region and also a number of spatially different scenarios which include different growth intensities for different parts of the region. All projects have used medium growth forecasts, apart from Aotea Quay to Ngauranga which assumes high growth. The growth scenario sensitivity tests are as follows: NZ Transport Agency Wellington Northern Corridor: Business case: 2013 addendum
Page 62

•   Low growth (low growth to each territorial area),
•   High growth (high growth to each territorial area), and
•   “Western drift” (high growth to western territorial areas while the rest of the region experiences medium
    growth).
The “Western drift” test seeks to model the observed higher growth in areas in the western part of the region (eg
Kapiti and Porirua which could continue to grow ahead of other parts of the region with the implementation of
the WNC programme being an influencing factor).

Summary
A summary of the results of the sensitivity tests is shown in Table 5-16. The sensitivity tests are applied
singularly in accordance with the EEM, however, it is probable that future scenarios may involve two or more of
the situations modelled within these tests.
Table 5-16: Sensitivity tests results
                               Scheme                                   NPV Benefits   NPV Cost     BCR
                                                                           ($B)          ($B)

WNC programme                                                                3.0         1.9         1.6
1 – WNC package (ie include Petone to Grenada)                               3.8         2.1         1.8
2 – Variable trips benefits                                                  3.2         1.9         1.6
3 – Wider                a-   Imperfect competition and increased            3.2         1.9         1.6
economic                      labour supply
impacts                  b-   Imperfect competition, increased               3.4         1.9         1.8
                              labour supply and labour demand

4 – Cost                 a-   Low                                            3.0         1.6        2.0
estimates                b-   High                                           3.0         2.4        1.3
5 – Analysis             •    30 year period and 8% discount rate            1.9         1.8        1.1
period and
discounting rate
                         •    60 year period and 4% discount rate            6.0         2.2         2.8

6 – Benefits             a-   Capping at 2031                                2.7         1.9         1.4
Capping                  b-   Capping at 2041                                2.9         1.9         1.5
7 – Growth               a-   Low                                            2.8         1.9         1.4
Scenarios                b-   High (Wellington Expansion)                        3.1     1.9         1.6
                         c-   Western Drift                                  3.2         1.9         1.6

The sensitivity tests show the programme has a range of benefits between $1.9b and $6.0b and a range of cost
of $1.6b to $2.4b in 2012 dollars. Therefore, the WNC programme BCR has been assessed to range between 1.0
and 2.8.

5.11 Network assessment summary
The primary BCR for the WNC programme is calculated at 1.6 including the benefits from agglomeration.
Together with the “other” WEIs the BCR is 1.8.

NZ Transport Agency Wellington Northern Corridor: Business case: 2013 addendum
You can also read