Assessing Uranium Pollution Levels in the Rietspruit River, Far West Rand Goldfield, South Africa
←
→
Page content transcription
If your browser does not render page correctly, please read the page content below
International Journal of
               Environmental Research
               and Public Health

Article
Assessing Uranium Pollution Levels in the Rietspruit River,
Far West Rand Goldfield, South Africa
Iyioluwa Busuyi Raji * , Emile Hoffmann, Adeline Ngie and Frank Winde

                                          Unit of Environmental Science and Management, Faculty of Natural and Agricultural Sciences,
                                          Potchefstroom Campus, North-West University, Private Bag X6001, Potchefstroom 2520, South Africa;
                                          emile.hoffmann@nwu.ac.za (E.H.); Adeline.Ngie@nwu.ac.za (A.N.); frank.winde@gmail.com (F.W.)
                                          * Correspondence: rajiiyioluwa@gmail.com

                                          Abstract: The Rietspruit is located in Gauteng Province, South Africa, within the Witwatersrand
                                          Basin. The basin is noted for its vast gold deposit. The river extends for about 60 km before joining
                                          the Vaal River. The aim of this study was to determine the concentration of uranium in the Rietspruit
                                          and the factors that influenced the concentration of U at each of the sites. The source of uranium in
                                          the river is the discharge from the gold mine and the mine wastes. Inductively coupled plasma mass
                                          spectrometry was used for water and sediment analysis in order to determine the concentration of U.
                                          High concentration of U was found in the river water and sediment, which is above the permissible
                                          limit of U. The water is used for irrigation of farmlands, cattle watering and for human consumption
                                          despite the high concentration of uranium in it. Ingestion of uranium is dangerous to human health.
                                          Due to the toxic nature of uranium, consumption of the water for domestic use and agriculture
                                purpose must be discouraged.


Citation: Raji, I.B.; Hoffmann, E.;       Keywords: uranium; pollution; wetland; dam; water salinity
Ngie, A.; Winde, F. Assessing
Uranium Pollution Levels in the
Rietspruit River, Far West Rand
Goldfield, South Africa. Int. J.          1. Introduction
Environ. Res. Public Health 2021, 18,
                                                Uranium (U) is an isotopic radioactive element [1]. This is because of the difference
8466. https://doi.org/10.3390/
                                          in the number of neutrons in the nucleus of the atom. The natural mean background
ijerph18168466
                                          concentration of U in soil is ≤4 mg/kg [2], and the South African limit of U in water
                                          used for drinking and agricultural activities is 30 µg/L. However, gold mining operations
Academic Editor: Marta Otero
                                          elevated the concentration of U in sediment and water [3]. In South Africa, U is found in
                                          association with gold, and South African uranium is mainly produced as a by-product of
Received: 1 July 2021
Accepted: 29 July 2021
                                          gold mining [4].
Published: 11 August 2021
                                                The mining of gold brought a large concentration of U to the surface. In South Africa,
                                          about six million kilograms of U were brought to the surface and disposed off onto slime
Publisher’s Note: MDPI stays neutral
                                          dams [5]. Slime dams contaminate nearby surface water as well as ground water through
with regard to jurisdictional claims in
                                          different modes of erosion (water and air) and seepage to water systems [6,7]. The contami-
published maps and institutional affil-   nation of water bodies is hazardous to humans and animals that depend on the water for
iations.                                  various uses [8–11]. Due to the mobility of U influenced by the redox state of U, chemistry of
                                          the water and sediment as well as iron and manganese concentration in the sediment [12,13],
                                          downstream users of the water could also be exposed. Exposure pathways of human to U
                                          include drinking of polluted water, consumption of food rich in U, inhalation of mine dusts
Copyright: © 2021 by the authors.
                                          and farm produce irrigated with contaminated water [14–16].
Licensee MDPI, Basel, Switzerland.
                                                Several studies have been done on the impacts of gold mining in South Africa focus-
This article is an open access article
                                          ing on U [6,15,17,18] reporting high concentration of U within gold mines; however, no
distributed under the terms and           literature has reported on the concentration of U for the entire length of the Rietspruit. As
conditions of the Creative Commons        a result of this, it is important to know the concentration of U in the Rietspruit system
Attribution (CC BY) license (https://     (water and sediment), and also the extent of the pollution plus the factors influencing U
creativecommons.org/licenses/by/          concentration. The use of water for irrigation provides a pathway for the introduction of U
4.0/).                                    into the food chain, and also, drinking the water as a religious rite also makes it crucial

Int. J. Environ. Res. Public Health 2021, 18, 8466. https://doi.org/10.3390/ijerph18168466                   https://www.mdpi.com/journal/ijerph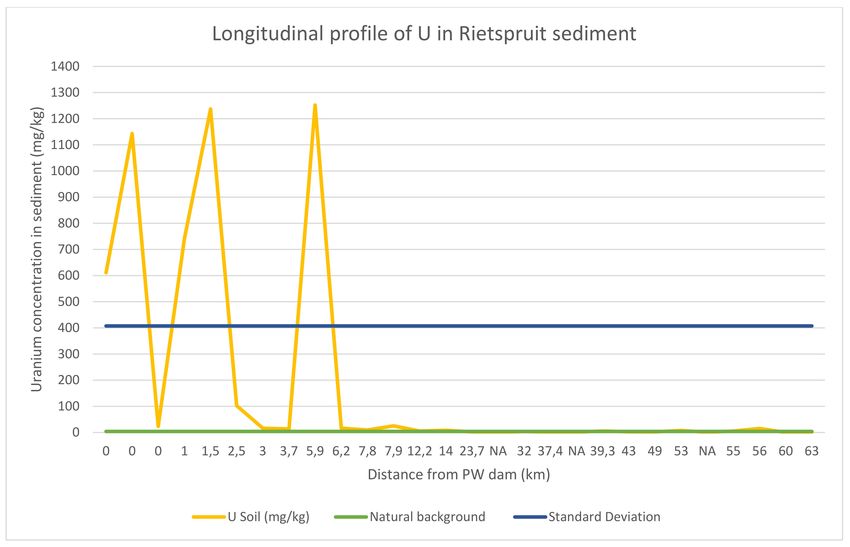
Int. J. Environ. Res. Public Health 2021, 18, 8466 2 of 12
to quantify the level of the pollutant in the water. This is necessary in order to engage the
authority in charge of water to take adequate steps in reducing human exposure. This
study focused on the U pollution level of the Rietspruit from the Peter Wright (PW) dam
downstream to the Vaal River about 60 km and the factors that played role(s) on the U level.
The main objective of this study was to determine the concentration of U in the
Rietspruit water and sediment. Factors that play an important role in the mobilization and
immobilization of U will also be discussed.
2. Materials and Methods
2.1. Study Area
The Rietspruit River is located in the Highveld region of South Africa. It starts from
Peter Wright dam, a reservoir located at an elevation of 1680 m above sea level, in the West
Rand of Gauteng (C22H Quaternary Catchment area according to the Department of Water
Affairs and Forestry) and flows for about 60 km before the confluence with the Vaal River
(Figure 1C). The Vaal River is located downstream of Vanderbijlpark and extends up to
the Northern Cape, where it also joins the Orange River. As a result of the abundance of
gold deposits in this study area, the Rietspruit area has experienced over 60 years of gold
mining activity. Notable mines include Cooke 4 Ezulwini Plant and South Deep Gold Mine,
which is along the Leeuspruit River (Figure 1C). The Leeuspruit River formed a confluence
with the Rietspruit River, and it is found in the C22J Quaternary Catchment area. The
total size of these two catchments is about 1123 km2 . Other notable tributaries include the
Evaton Rietspruit and Klein Rietspruit (Figure 1C).
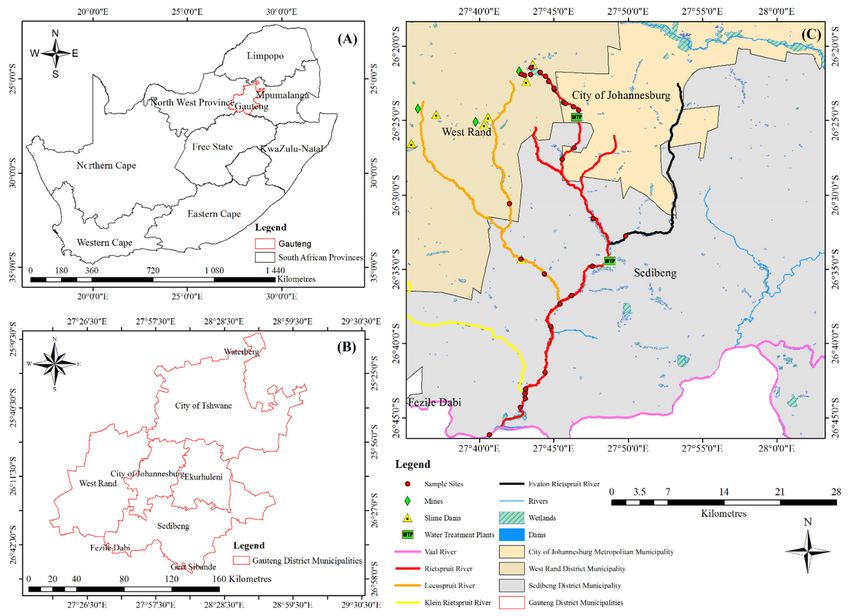
Figure 1. Map of study area. (A) shows the map of South Africa. (B) is the map of the Gauteng Province where the mine is
located. (C) depicts the Rietspruit river with associated tributaries and the sampled sites.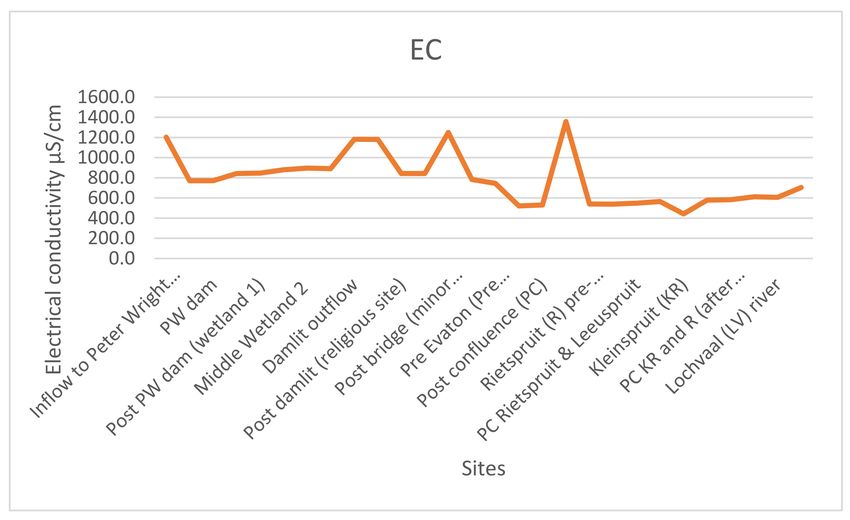
Int. J. Environ. Res. Public Health 2021, 18, 8466                                                                                3 of 12

                                             The study area is within the Witwatersrand Basin, an Archean sedimentary basin
                                        that contains a stratigraphic sequence about 6 km thick. It is made up of quartzites and
                                        shales with minor volcanic unit. Gold is hosted by the upper Elsburg and middle Elsburg
                                        reefs. Uranium is also found in the middle Elsburg reef. The gold is found associated with
                                        sulphide minerals (pyrite), while U is found in the form of uraninite.

                                        2.2. Field Work
                                              In total, thirty soil samples and twenty-eight water samples were collected from the 30
                                        sites downstream of the Rietspruit at varying distances, depending on accessibility while
                                        focusing on wetlands, dams, river confluence and where human exposures were witnessed.
                                        Sediments were collected at the same spot where water samples were collected using
                                        an auger. Sampling started in the vicinity of the gold mine and continued downstream
                                        (Figure 1C). Water samples were collected under the water surface using water bottles in
                                        the middle of the river. Water bottles were rinsed three times before taking water samples.
                                        This is done to avoid sampled water contamination. When the water bottle was completely
                                        filled, the bottle was capped under water. There were two dry samples from the tailings;
                                        each from the slime dam and mine waste located along the furrow leading to the PW dam
                                        inflow, while the rest of the sediment samples were collected under water at the same spot
                                        where water samples were collected. The sediment samples were kept in a zip-lock bag,
                                        while the water samples were kept in the 500 mL water bottle used to collect the water
                                        samples. The pH, electric conductivity and temperature of the water body were taken
                                        using the WTW multi 350i at each of the sampled sites (reference temperature: 25 ◦ C).
                                        Stream flow velocity was measured using Global Flow Probe FP101 and 201. All samples
                                        were taken to the laboratory after sampling.

                                        2.3. Lab Analyses
                                             Sediment samples were all dried in the oven at a temperature of 50 ◦ C for 24 h to
                                        remove the water content. About 400 g of the sediment was placed in a labelled petri
                                        dish. The petri dish was then arranged in the oven. After drying, a mortar and pestle
                                        were used to break the particles and a sieve of mesh size 2000 µm was used to remove
                                        gravel and plant particles. Sediment samples were digested according to EPA 3050b. About
                                        200 mg of the sieved sediment sample were placed in a Teflon tube. A volume of 9 mL
                                        of 65% nitric acid and 3 mL of 32% hydrochloric acid was added to the tube, capped and
                                        placed in a microwave digestion system (Milestone, Ethos UP, Maxi 44). A period of 20 min
                                        allowed the system to reach 1800 MW at a temperature of 200 ◦ C, which was maintained
                                        for another 15 min. After cooling, Agilent 7500 CE ICP-MS fitted with Collision Reaction
                                        Cell technology for interface removal was used to determine the concentration of U and
                                        other trace metals in the samples. In order to achieve a quantitative result, the instrument
                                        is calibrated using ULTRASPEC certified custom mixed multi-element stock standard
                                        (De Bruyn Spectroscopic Solutions, Midrand, South Africa) solutions containing all the
                                        elements of interest.
                                             Water samples were filtered using a 0.45 µm pre-filter nylon sieve to remove sus-
                                        pended particles. Then, 1 mL of the filtered water was mixed with 9 mL of 2% HNO3
                                        to remove organic constituents before ICP-MS was used to determine U concentration.
                                        High-performance ion chromatography was used to determine the anion concentration of
                                        chlorine (Cl), sulphate (SO4 ), nitrate (NO3 ), nitrite (NO2 ), phosphate (PO4 ) and fluorine (F)
                                        in the water.

                                        3. Results and Discussion
                                        3.1. Rietspruit Water Chemistry
                                            The quality of water of the Rietspruit River from twenty-eight (28) water samples is
                                        given in Table 1.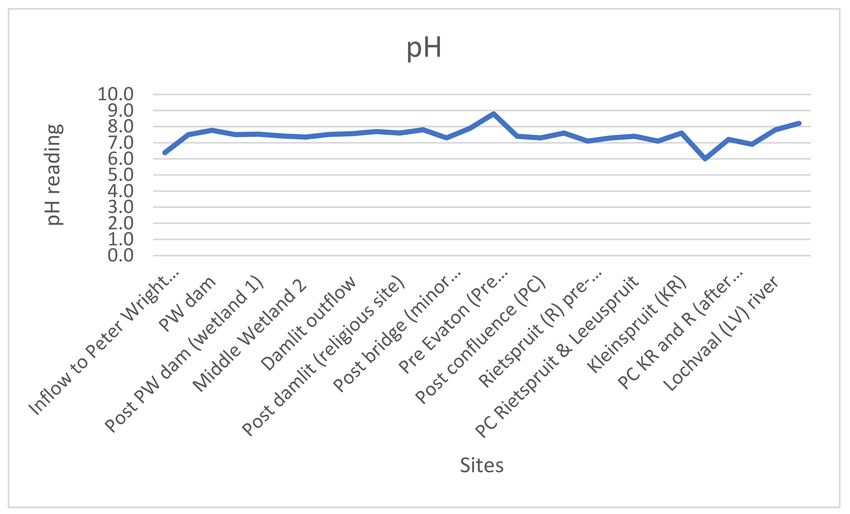
Int. J. Environ. Res. Public Health 2021, 18, 8466                                                                                  4 of 12

                                                         Table 1. Rietspruit water chemistry.

                                                     Water Samples (n = 28)
    Parameters
                            Maximum                  Average         Minimum               SD      WHO Limit [19]      SANS 241 [20]
        pH                       8.8                   7.4                 6               0.7           6–9                5–9.7
   EC (µS/cm)                  1358                    788               443               252           400
    Temp (◦ C)                   26                     16                8.8               4             30
    Cl (mg/L)                  481.5                    56               18.5               85             5                300
   SO4 (mg/L)                  1009                   302.2              13.2              241           500                500
   NO3 (mg/L)                  25.1                     4                  0                6             10                 11
   NO2 (mg/L)                   2.9                     0                  0                1              3                 1
    F (mg/L)                    1.2                    0.1                 0               0.2           1.5                1.5
   PO (mg/L)                    14.8                   1.1                 0               2.8           0.03

                                        3.2. pH Value
                                             The pH of the stream water is weakly acidic to weakly alkaline (6.0–8.8) (Figure 2).
                                        This is within the WHO guideline range (6–9) and also the South African limit (5–9.7).
                                        The temperature at which pH reading are taken should always be reported, since pH
                                        measurement is influenced by temperature. The maximum temperature recorded was 26 ◦ C
                                        at the channel water, while the minimum temperature was 8.8 ◦ C, which corresponded to
                                        the lowest pH reading observed in the field.

                                        Figure 2. pH readings at the sampled sites.

                                              The pH of the stream water increases as the sun rises from the first site, inflow to Peter
                                        Wright dam, downstream. The maximum pH reading, 8.8, was recorded around noon,
                                        when the sun was at its peak (Figure 2). The fluctuation of pH in stream water is as a result
                                        of photosynthesis of aquatic plants and algae. The minimum pH reading, 6.0, was recorded
                                        in the evening, after sunset. As a result of the sunset, sampling was continued the next
                                        day and the trend of the rising pH reading as the sun rises was observed the following
                                        day when the last few sites were visited. This is similar to the finding of Winde et al. [21].
                                        However, in his study, pH observation was done in one location, but the pH observations
                                        correspond with this study finding.
                                              The reduced species (U(lV), U4+ ) typically precipitates from natural waters near neu-
                                        tral pH due to its low solubility, and so is usually characterized as relatively immobile [22].
                                        In contrast, the oxidized species of uranium, uranyl (U(VI), UO2 2+ ), typically forms more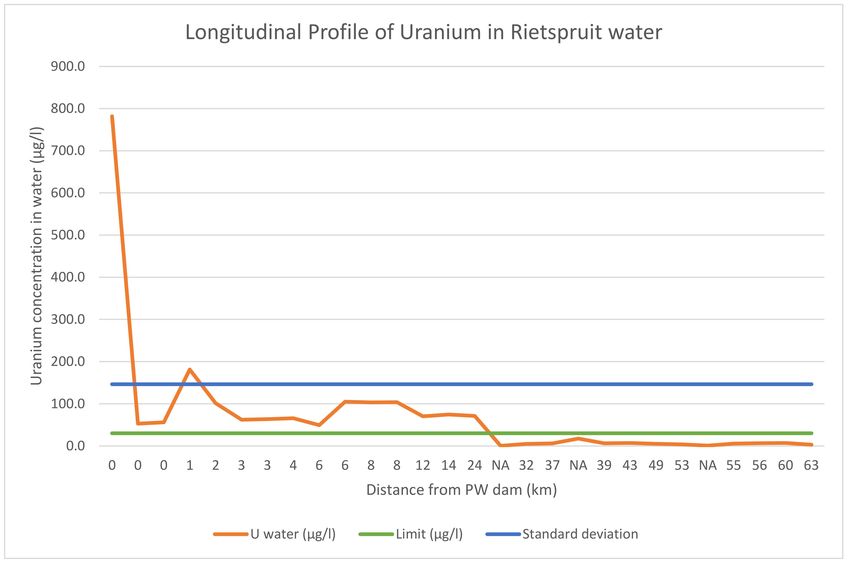
Int. J. Environ. Res. Public Health 2021, 18, 8466                                                                                5 of 12

                                        stable aqueous complexes and is much more mobile in natural waters [22], although there
                                        are many known minerals containing uranium in the VI oxidation state [23].

                                        3.3. Electrical Conductivity
                                             Electrical conductivity (EC) is a measure of the ability of water to conduct an electrical
                                        current [24]. The range of EC at 25 ◦ C in the water is 443–1358 µS/cm (Figure 3). The
                                        World Health Organization (WHO) recommends that the value of EC in water should not
                                        exceed 400 µS/cm. This means that the EC of the study area is higher than the normal
                                        threshold for EC in water. The average of the study area EC (785.1 µS/cm) is above the
                                        WHO recommended limit of EC in water (400 µS/cm).

                                        Figure 3. EC reading at the sampled sites.

                                             Electrical conductivity is influenced by the availability of ions, and it is proportional to
                                        the total amount of dissolved solid, positively charged ions like sodium (Na), magnesium
                                        (Mg), calcium (Ca), iron (Fe) (cations) and chlorine (Cl), nitrate (NO3 ), sulphate (SO4 ), and
                                        phosphate (PO4 ), (anions) in the water. Electrical conductivity is also affected by water
                                        temperature; the warmer the water, the higher the conductivity [21]. Anions like Cl, NO3 ,
                                        SO4 are synonymous with sewage discharge. High concentrations of these anions were
                                        recorded at sites after the two water treatment plants and both sites have high EC (Figure 1C).

                                        3.4. Anions Concentration
                                              The concentrations of the anion (SO4 , NO3 , NO2 , F, PO4 , Cl2 ) relate to the source
                                        of water contamination. Typical sources for this kind of contamination are industrial
                                        operations, agricultural practices and mining activities, municipal waste discharge. The
                                        average concentration of SO4 (302.2 mg/L), NO3 (4.2 mg/L), NO2 (0.3 mg/L), F (0.1 mg/L)
                                        are below the WHO guideline limit (500 mg/L, 10 mg/L, 3 mg/L, 1.5 mg/L, respectively),
                                        only PO4 (1.3 mg/L) has a higher average concentration than the WHO guideline limit
                                        (0.03 mg/L). Using the South-African National Standard, SANS 241, the average of the
                                        SO4 , NO3 , NO2 and F in this study are all below the national limit.
                                              The presence of sulphate, nitrate, nitrite, chlorine in water increases the salinity of
                                        the water. An increase in water salinity decreases the ability of U to be adsorbed by the
                                        sediment [15]. High concentrations of SO4 , NO3 and Cl were recorded at sites after the
                                        two water treatment plants were established downstream of the Rietspruit (Figure 1C). At
                                        each of these sites, a low concentration of U was recorded in the sediment, despite the high
                                        concentration of U in the water column and the high adsorption capacity of the sediment.
Int. J. Environ. Res. Public Health 2021, 18, 8466 6 of 12
3.5. Uranium Concentration in the Rietspruit Water
Within the immediate environment of the gold mine, the uranium concentration in
the water is very high. At the inflow of the PW dam, a concentration of 781.9 µg/L was
recorded in the furrow (Figure 4). This is about 200× higher than the WHO regulatory
limit of U in water. The furrow takes discharge from the mine sewage plant to the PW dam.
Another contributing factor to the high concentration of U at the furrow is the erosion
of mine waste that litters the environment. During rain events, mine wastes are eroded
into the furrow. In one of the mine wastes sampled next to a channel that connects with
the furrow, U concentration of 1125 mg/kg was recorded in the sediment. Before the
main rain event, the channel was dry, so the water sample collected after rainfall in the
channel was analyzed. The concentration of U in the water was 387.7 µg/L. It confirms
that erosion of mine wastes located on the earth surface could contribute to the increase in
the concentration of U in water.
Figure 4. Longitudinal profile of U in Rietspruit water.
The discharge from the underground shaft has a concentration of 52.7 µg/L. It should
be noted that, despite the treatment of fissure water before discharge in order to remove
U, U still persists in the water. The Cold Lime Softening process is used by the mine to
remove U in the water before discharge [25].
About 1 km from the dam inflow (Figure 4), the concentration of U has reduced to
181.2 µg/L. This site is the outflow of the PW dam. It shows the ability of the dam to remove
U from the water column. This indicates immobilization of U. Further downstream, the
concentration of U reduced further to 101.4 µg/L after another 1 km from the previous site
(PW dam outflow). Reduction of U in water concentration as distance increases from the
source pollutant has been reported [26]. This site is a wetland (Figure 1C). The reeds cover
of the wetland and the hydraulic control point created as a result of the road culvert reducedInt. J. Environ. Res. Public Health 2021, 18, 8466 7 of 12
the flow of the water. This allows for the deposition of suspended particles, which U is
adsorbed to. The deposition resulted in having a high concentration of U in the wetland
sediment, signaling immobilization of U by wetland sediment.
The reduction trend in the concentration of U continues downstream for another 6 km,
where another dam is located (Figure 4). We call the dam a damlit because it does not have
an official name. The concentration of U in the damlit water is 49.2 µg/L. After the damlit
outflow, the concentration of U increased to 104.9 µg/L. This is because of the turbulence
created by the damlit outflow slab. After the slab, the flow velocity of the stream increased
to 177.9 m/s from 24.7 m/s recorded before the slab. This turbulence was able to resuspend
fine particles of silt and slay which contains U, resulting in a high concentration of U in the
water column.
The environment of the damlit is noted for a series of religious activities and farming.
Many of the worshippers use the water for drinking, cooking and bathing, whereas the
farmers use the damlit water for crop irrigation and animal watering. Due to the high
concentration of U recorded in the water, these activities could be toxic to human health.
The concentration of U was consistent for another 2 km before a reduction in concen-
tration. The reduction was caused by the diluting effect of the Ennerdale Water Treatment
Plant (Figure 1C). The average discharge from the water plant averages about 132,300 m3
per month [25]. After the Ennerdale Water Treatment plant, there is a change in water color,
from clear water to dark color, with a sewage odor. As a result of the discharge, the concen-
tration of chlorine and nitrate in the water increased more than twofold. These increased
the water salinity and reduced the adsorption capacity of the stream sediment [15]. The
concentration of U after the Ennerdale Water Treatment plant was 70.2 µg/L; this value
was consistent for another 2 km before the confluence of the Evaton Reitspruit tributary.
Evaton Rietspruit has no mining or industrial activity upstream (Figure 1C). As a
result, the site was selected as this study background concentration of U. The concentration
of U at the Evaton Rietspruit is 0.3 µg/L. This is the lowest concentration of U recorded in
this study. Downstream of the Evaton Rietspruit is the Sebokeng Water Treatment Plant
(Figure 1C), with an average monthly discharge of 2,191,867 m3 [25]. About 1 km from the
Sebokeng Water Treatment Plant is the post confluence of Rietspruit and Evaton Rietspruit.
The concentration of U in the water of this site was 4.9 µg/L. This is a huge decrease in
U concentration. Before the confluence, 71.1 µg/L of U were recorded in the Rietspruit.
The only reason for the reduction in U concentration is the diluting effect of the Sebokeng
Water Treatment Plant. At a concentration of 4.9 µg/L, the concentration of U falls below
the WHO regulatory limit in water.
The Leeuspruit tributary is an interesting tributary of the Rietspruit (Figure 1C). This
is because of the gold mine established upstream. Uranium concentration in the Leeuspruit
also reduces as the distance from the mining site increases. The highest concentration of U
recorded in the Leeuspruit water is 50.2 µg/L. This is lower than expected because the mine
is operational. At about 6.1 km before the confluence of the Leeuspruit and the Rietspruit,
the concentration of U in the water has reduced to 12.81 µg/L. After the confluence, the
concentration of U in the Rietspruit was 6.0 µg/L. This is an increase from the 4.9 µg/L U
concentration recorded before the confluence of Rietspruit and Leeuspruit.
Going further downstream, the concentration of U ranges from 3.7 µg/L to 6.9 µg/L
before the confluence with the Vaal River (Figure 1C). After the Vaal River confluence,
about 60 km from the Rietspruit headwater, the concentration of U in the water was
3.0 µg/L. At another tributary selected as a natural background concentration of U in the
water of the environment, the Klein Rietspruit (Figure 1C), the concentration of U recorded
was 0.7 µg/L. Low concentration of U at the sites selected as the natural background
concentration of U in the study area water (including the Evaton Rietspruit, 0.3 µg/L)
indicates that the major source of U in the Rietspruit is as a result of the gold mine discharge
and mine wastes.Int. J. Environ. Res. Public Health 2021, 18, 8466 8 of 12
3.6. Uranium Concentration in the Rietspruit Sediment
Gold mine wastes contain a high concentration of U. For example, in the slime dam,
the concentration of U recorded was 72.7 mg/kg. A higher concentration of U has been
recorded in slime dam in the country [27,28]. In another mine dump located beside a
water channel that connects with the furrow taking sewage discharge to the PW dam, a
concentration of 1043 mg/kg was recorded in the mine waste. Despite the decommissioning
of the mine, the waste from mining operations contains a high concentration of U in them.
The erosion of these mine wastes into nearby water bodies pollutes the stream, and this is
toxic to downstream users of such water.
The scale found on the concrete canal, which takes discharge from the underground
shaft, has a U concentration of 1143 mg/kg. The scale is formed as a result of calcium
carbonate precipitation and changes in the atmospheric pressure [5]. The concentration of
calcium in the scale is 20,760 mg/kg. This is the highest concentration of Ca found in this
study. During the precipitation of calcium carbonate, U was also removed from the water
column. The scale on the concrete canal could serve as another source of U as it could
easily dissolve if the water chemistry should change. This could be influenced by a drop in
the water pH, and also a change in the discharge flow. According to Winde et al. [28], the
volume of water discharged by the mines at night and on the weekend is more than water
discharged during the day. This is done in order to save costs spent on electricity.
Unlike the trend of U concentration in the Rietspruit water, which decreases with
distance from the mining site, the trend of U in the Rietspruit sediment is not consistent
(Figure 5). Several factors play an active role in the ability of sediment to retain U in them
(immobilization). Some of these factors are sediment texture, organic carbon, water salinity,
iron hydroxide/oxide, water flow velocity.
Figure 5. Longitudinal profile of U in Rietspruit sediment.Int. J. Environ. Res. Public Health 2021, 18, 8466 9 of 12
At the inflow of the PW dam, furrow, the concentration of U recorded was 611.1 mg/kg.
All these concentrations were higher than the natural background concentration of U in soil
(≤4 mg/kg by WHO). The percentage of organic carbon is very high (6.7%). Organic carbon
has been reported to be able to keep an environment in a reducing condition. A reducing
condition favors U immobilization. This is because U (VI), which is highly oxidized, soluble
and mobile, will be reduced to U(IV), which is insoluble and immobile [13]. The correlation
of U concentration in the sediment and organic carbon is positively strong (+0.7).
At the wetland located about 1.5 km from the PW dam inflow (Figure 5), the con-
centration of U at this site is 1237 mg/kg. This is the second highest concentration of
U recorded in this study. The organic carbon plays a role in this site. The percentage of
organic carbon here is 6.7%, which is similar to the Peter Wright inflow organic carbon.
Uranium is adsorbed to organic matter, which breaks down to form humus. Furthermore,
the high concentration of iron recorded at the wetland indicate co-precipitation of U with
iron hydroxide. The correlation of U with OC and Fe is positively strong (+0.7 and +0.8
respectively). This indicates the importance of these two factors in the immobilization of U
in the sediment.
The reed cover of the wetland was able to reduce the flow velocity of the wetland water.
This resulted in the gravitational settling of fine particles of silt and clay. Fine particles
of silt and clay have a higher adsorption capacity than the coarse particle of sand [15].
This is further established by the strong composition of silt and clay in the sediment,
which amounts to a total percentage of 49% of the soil texture. Uranium adsorbed to fine
suspended particles of clay and silt will precipitate out of the water column when the
flow velocity of water has reduced and there are enough barriers (reeds in the case of the
wetland) to impede the flow of the water. All of these factors contributed to the reason why
a high concentration of U was recorded in the wetland sediment.
Wetlands have been categorized as a sink for U and other heavy metals [29–31]. Some
of the concentration of heavy metals recorded in the wetland sediment are the highest
found in these study (Table 2). Water discharged from the mine is the major reason why
the stream is perennial. This could change if the discharge from the mine was stopped,
which could lead to drying up of the stream during winter, thereby exposing the wetland
sediment to atmospheric conditions. With the exposure, the sediment will become oxidized,
and heavy metals stored in the sediment will be released during a rain event. This could
be a major problem for downstream users of the stream.
Table 2. Concentration of heavy metals in wetland.
Heavy Metal Gold Arsenic Lead Cadmium Mercury Cobalt Manganese
Concentration (mg/kg) 2.3 223.1 120.9 3.5 0.3 4878 47,120
The highest concentration of U was recorded in the damlit sediment (Figure 5). The
concentration of U recorded was 1252 mg/kg. Low concentration of organic carbon was
found in the sediment, which indicated that organic carbon does not play any role in this
case. Possible factors that played a role here are the adsorption capacity of the damlit
sediment and co-precipitation of U with iron and manganese hydroxide.
The total composition of silt and clay in the sediment is 31.1%. Similar to the wetland,
this is a valid factor responsible for the immobilization of U in the damlit. In addition, the
concentration of iron is very high, 30,630 mg/kg. As a result, co-precipitation of U with
hardly soluble compound of iron is possible. Due to the reduction in the flow velocity of
water in the damlit, precipitation of U of low solubility could be possible.
After the damlit, the concentration of U decreased to 16.5 mg/kg in the sediment of the
next sampled site about 200 m from the damlit outflow. The reduction of U concentration
in the sediment could be a result of the dominant coarse particle of sand. This resulted in a
decrease in the ability of U to be retained in the sediment despite the high concentration of
U found in the water (104.9 µg/L).Int. J. Environ. Res. Public Health 2021, 18, 8466 10 of 12
At the site after the Ennerdale Water Treatment Plant, the percentage of clay and silt
is high, about 34% of the soil texture, but low concentration of U was recorded in the
sediment. This is because of the increase in the salinity of the water, which reduces the
adsorption capacity of the stream sediment. This finding is similar to the result of the
Leeuspruit tributary: a similar tributary of the Rietspruit with an operational gold mine
established upstream. The percentage of silt and clay in the Leeuspruit dam is high, above
40% at the inflow, middle and outflow of the dam. However, low concentration of U was
found in the sediment. This is because of the water salinity. The concentration of chlorine,
sulphate and nitrate in the water is very high.
Further downstream of the Rietspruit, the concentration of U was below 4 mg/kg, the
natural concentration of U in soil [2] except at two sites (Figure 5), the post confluence of
Leeuspruit and Rietspruit (5.6 mg/kg) and the inflow of the Lochvaal (15.2 mg/kg). The
inflow of the Lochvaal was able to retain U as a result of the high composition of silt and
clay of the sediment (above 50% of the soil texture) and the slow flow velocity of the water.
In the sediment of the sites chosen for this study of natural background concentration
of U in sediment, the concentrations of U are 0.7 mg/kg at the Evaton Rietspruit and
0.6 mg/kg at the Klein Rietspruit. It further indicates that the environment has low
concentration of U but, as a result of gold mining operations in the upstream environment,
U was able to infiltrate the water and sediment of the Rietspruit.
4. Conclusions
The concentration of U decreases with increasing distance from the gold mine located
in the study area. This reduction can be attributed to the water-sediment system interplay
(chemistry), location of wetlands and dams close to the source pollutant.
The major source of U in the Rietspruit is the discharge from the Ezulwini plant
underground shaft and water treatment plant. Other sources include the leaching of slime
dams and mine dumps into the water channel leading to the PW dam. Underground
pollution is another source of pollution mechanism, but not considered in this study.
Despite the decommissioning of the mine, U trapped in mine wastes still contribute to the
concentration of U in the water.
Wetland and dams provide a medium of filtering U out of water. However, this is
not a permanent filtration, as U trapped in sediments can be remobilized back into the
water column, thereby contributing to the pollution of the downstream. If the mine should
stop discharging water into the PW dam, the stream will become non-perennial which will
increase oxidation. Oxidation favors the remobilization of U trapped in sediment [5,13,15]
when in contact with rainwater.
The impact of mining is not limited to the immediate environment. It is confirmed in
this study that while high concentration of U is found in the water about 24 km from the
mining site (Figure 4), highest concentration of U is found in the sediment about 6 km away
from the mining site (Figure 5). As a result, animal grazing and religious activity along the
stream must be discouraged within the environment with high concentration of U. The use
of billboards and signage within the perimeter should be encouraged and effected. The use
of the water from the dam for irrigation purpose should also be discontinued, as well as
fishing activity in the dam.
Possible remediation of the mining environment, which must include the removal
of the mine wastes that litter the mining sites, must be looked into. Also, possible mech-
anisms that will ensure the wetland chemistry does not change in order to prevent the
remobilization of U from the sediment should be considered. This includes keeping the
environment in a reduced state by maintaining the concentration of organic carbon and
preventing the burning of wetland reeds during winter. In dams, the water level must be
maintained to prevent drying out of the dam, which will result in the exposure of oxidized
sediment to acid water from the rain.
Author Contributions: Conceptualization, I.B.R., A.N. and F.W.; methodology, I.B.R. and E.H.;
investigation, I.B.R. and E.H.; resources, I.B.R., A.N. and F.W.; writing—original draft preparation,Int. J. Environ. Res. Public Health 2021, 18, 8466 11 of 12
I.B.R.; writing—review and editing, I.B.R., A.N., E.H. and F.W.; supervision, A.N. and F.W.; funding
acquisition, E.H., A.N. and F.W. All authors have read and agreed to the published version of
the manuscript.
Funding: The study is funded by Sasol Research.
Institutional Review Board Statement: Not applicable.
Informed Consent Statement: Not applicable.
Data Availability Statement: Not applicable.
Acknowledgments: We would like to acknowledge the faculty of environmental sciences at the
North-West University for providing us with the necessary facilities to carry out this research.
Conflicts of Interest: The authors declare that there is no conflict of interest regarding the publication
of this manuscript.
References
1. Grenthe, I.; Drożdżynński, J.; Fujino, T.; Buck, E.C.; Albrecht-Schmitt, T.E.; Wolf, S.F. Uranium. In The Chemistry of the Actinide and
Transactinide Elements; Springer: Berlin/Heidelberg, Germany, 2008; pp. 253–698.
2. WHO. Depleted Uranium: Sources, Exposure and Health Effects; World Health Organization: Geneva, Switzerland, 2001; No.
WHO/SDE/PHE/01.1.
3. Winde, F.; Wade, P.; van der Walt, I.J. Gold tailings as a source of waterborne uranium contamination of streams—The Koekemo-
erspruit(#) (Klerksdorp goldfield, South Africa) as a case study—Part I of III: Uranium migration along the aqueous pathway.
Water SA 2004, 30, 219–225.
4. Winde, F.; Sandham, L. Uranium pollution of South African streams—An overview of the situation in gold mining areas of the
Witwatersrand. GeoJournal 2004, 61, 131–149. [CrossRef]
5. Winde, F.; van der Walt, I.J. The significance of groundwater-stream interactions and fluctuating stream chemistry on waterborne
uranium contamination of streams—A case study from a gold mining site in South Africa. J. Hydrol. 2004, 287, 178–196. [CrossRef]
6. Durand, J.F. The impact of gold mining on the Witwatersrand on the rivers and karst system of Gauteng and North West Province,
South Africa. J. Afr. Earth Sci. 2012, 68, 24–43. [CrossRef]
7. Winde, F. Uranium pollution of the Wonderfonteinspruit, 1997-2008 Part 1: Uranium toxicity, regional background and mining-
related sources of uranium pollution. Water SA 2010, 36, 239–256.
8. Bleise, A.; Danesi, P.R.; Burkart, W. Properties, use and health effects of depleted uranium (DU): A general overview. J. Environ.
Radioact. 2003, 64, 93–112. [CrossRef]
9. Callahan, B.G.; Kostecki, P.; Reece, K.D. Human health risk assessment at a depleted uranium site. Soil Sediment Contam. 2004, 13,
597–609. [CrossRef]
10. Corlin, L.; Rock, T.; Cordova, J.; Woodin, M.; Durant, J.L.; Gute, D.M.; Ingram, J.; Brugge, D. Health Effects and Environmental
Justice Concerns of Exposure to Uranium in Drinking Water. Curr. Environ. Health Rep. 2016, 3, 434–442. [CrossRef]
11. Dewar, D. Uranium mining: Environmental and human health effects. In Nuclear Non-Proliferation in International Law-Volume IV;
Springer: Berlin/Heidelberg, Germany, 2019; pp. 229–235.
12. Boelee, E.; Geerling, G.; van der Zaan, B.; Blauw, A.; Vethaak, A.D. Water and health: From environmental pressures to integrated
responses. Acta Trop. 2019, 193, 217–226. [CrossRef] [PubMed]
13. Cumberland, S.A.; Douglas, G.; Grice, K.; Moreau, J.W. Uranium mobility in organic matter-rich sediments: A review of geological
and geochemical processes. Earth-Sci. Rev. 2016, 159, 160–185. [CrossRef]
14. Keith, S.; Faroon, O.; Roney, N.; Scinicariello, F.; Wilbur, S.; Ingerman, L.; Llados, F.; Plewak, D.; Wohlers, D.; Diamond, G.
Toxicological Profile for Uranium; Agency for Toxic Substances and Disease Registry (US): Atlanta, GA, USA, 2013.
15. Coetzee, H.; Winde, F.; Wade, P. An Assessment of Sources, Pathways, Mechanisms and Risks of Current and Potential Future Pollution
of Water and Sediments in Gold-Mining Areas of the Wonderfonteinspruit Catchment: Report to the Water Research Commission; Water
Research Comission: Pretoria, South Africa, 2006.
16. Kamunda, C.; Mathuthu, M.; Madhuku, M. Health Risk Assessment of Heavy Metals in Soils from Witwatersrand Gold Mining
Basin, South Africa. Int. J. Environ. Res. Public Health 2016, 13, 663. [CrossRef] [PubMed]
17. Hobbs, P.; Oelofse, S.H.; Rascher, J.; Cobbing, J. Pollution reality of gold mining waste on the Witwatersrand. Resource 2010,
12, 51–55.
18. Winde, F.; de Villiers, A.B. The nature and extent of uranium contamination from tailings dams in the Witwatersrand gold mining
area (South Africa). In Uranium in the Aquatic Environment; Springer: Berlin/Heidelberg, Germany, 2002; pp. 889–898.
19. WHO. Uranium in Drinking-water. In Background Document for Development of WHO Guidelines for Drinking-Water Quality; World
Health Organization: Geneva, Switzerland, 2012; WHO/SDE/WSH/03.04/118/Rev/1.
20. SANS. Drinking Water. Part 1: Microbiological, Physical, Chemical, Aesthetic and Chemical Determinants; SABS Standards Division:
Pretoria, South Africa, 2015.Int. J. Environ. Res. Public Health 2021, 18, 8466 12 of 12
21. Winde, F.; Wade, P.; van der Walt, I.J. Gold tailings as a source of water-borne uranium contamination of streams—The
Koekemoerspruit(#) (South Africa) as a case study—Part III of III: Fluctuations of stream chemistry and their impacts on uranium
mobility. Water SA 2004, 30, 233–239.
22. Silva, R.; Nitsche, H. Actinide environmental chemistry. Radiochim. Acta 1995, 70, 377–396. [CrossRef]
23. Finch, R.; Murakami, T. Systematics and paragenesis of Uranium minerals. Uranium: Mineralogy, Geochemistry and the
Environment (PC Burns and R. Finch, editors). Rev. Mineral. Geochem. 1999, 38, 91–180.
24. Meride, Y.; Ayenew, B. Drinking water quality assessment and its effects on residents’ health in Wondo genet campus, Ethiopia.
Environ. Syst. Res. 2016, 5, 1–7. [CrossRef]
25. Kritzinger, A. Socio-Economic Impact Assessment of the Proposed Cessation of Pumping and Associated Closure of the
Underground Workings of the Ezulwini Operations of Sibanye gold, Gauteng Province. Report Prepared for Sibanye Gold. 2017.
Available online: https://www.jaws.co.za/wp-content/uploads/2020/03/Sibanye-SEIA_10-July-2017-1.pdf (accessed on 15
April 2021).
26. Liu, J.; Wang, J.; Li, H.; Shen, C.C.; Chen, Y.; Wang, C.; Ye, H.; Long, J.; Song, G.; Wu, Y. Surface sediment contamination by
uranium mining/milling activities in South China. CLEAN–Soil Air Water 2015, 43, 414–420. [CrossRef]
27. McCarthy, T.S. The impact of acid mine drainage in South Africa. S. Afr. J. Sci. 2011, 107, 1–7. [CrossRef]
28. Winde, F.; van der Walt, I.J. Gold tailings as a source of waterborne uranium contamination of streams—The Koekemoerspruit(#)
(Klerksdorp goldfield, South Africa) as a case study—Part II of III: Dynamics of groundwater-stream interactions. Water SA 2004,
30, 227–232.
29. Coetzee, H.; Wade, P.; Winde, F. Reliance on existing wetlands for pollution control around the Witwatersrand gold/uranium
mines of South Africa-Are they sufficient? In Uranium in the Aquatic Environment; Springer: Berlin/Heidelberg, Germany, 2002;
pp. 59–64.
30. Ross, J.-H.; Dudel, E.G. Uranium loads and accumulation in a mine water contaminated wetland. In Mine Water and the Environ;
Rapantova, N., Hrkal, Z., Eds.; Technical University of Ostrava: Ostrava, Czech Republic, 2008; pp. 225–228.
31. Schöner, A.; Noubactep, C.; Büchel, G.; Sauter, M. Geochemistry of natural wetlands in former uranium milling sites (eastern
Germany) and implications for uranium retention. Geochemistry 2009, 69, 91–107. [CrossRef]You can also read