HHS Public Access Author manuscript J Agric Saf Health. Author manuscript; available in PMC 2021 May 11.
←
→
Page content transcription
If your browser does not render page correctly, please read the page content below
HHS Public Access
                                Author manuscript
                                J Agric Saf Health. Author manuscript; available in PMC 2021 May 11.
Author Manuscript

                    Published in final edited form as:
                     J Agric Saf Health. 2020 ; 26(4): 123–137. doi:10.13031/jash.14043.

                    Examination of Realism in a High-fidelity Tractor Driving
                    Simulator
                    Kayla Faust, PhD1, Carri Casteel, PhD1, Daniel V. McGehee, PhD1,2, Corinne Peek-Asa,
                    PhD1, Diane S. Rohlman, PhD1, Marizen Ramirez, PhD1,3
                    1.University   of Iowa College of Public Health
                    2.University   of Iowa College of Engineering
Author Manuscript

                    3.University   of Minnesota

                    Abstract
                         Transportation-related incidents are the leading cause of occupational fatalities for all industries in
                         the U.S., including the agricultural industry, which suffers thou- sands of crashes involving farm
                         equipment each year. Simulated driving studies offer a safe and cost-effective way to conduct
                         driving research that would not be feasible in the real world. A tractor driving miniSim was
                         developed and then evaluated for realism at the University of Iowa among 99 Midwestern farm
                         equipment operators. It is important for driving simulators to have a high degree of realism for
                         their results to be applicable to non-simulated driving operations. High-fidelity driving simulators
                         facilitate extrapolations made by driving research but should be re-tested for realism when changes
Author Manuscript

                         are made to the design of the simulator. The simulator used in this study emulated a tractor cab
                         with realistic controls, three high-resolution screens, and high-fidelity sound. After completing a
                         10-minute drive, farm equipment operators completed a survey and scored four specific domains
                         assessing specific characteristics (i.e., appearance, user interface, control, and sound) of the tractor
                         simulator’s realism using a seven-point Likert scale (from 0 = not at all realistic to 6 = completely
                         realistic). An overall realism score and domain scores were calculated. Farm equipment operators
                         were also asked to provide recommendations for improving the tractor miniSim. Overall, farm
                         equipment operators rated the simulator’s realism favorably (i.e., >3 on a scale from 0 to 6) for all
                         individual items and domains. The appearance domain received the highest average realism score
                         (mean = 4.58, SD = 1.03), and the sound domain received the lowest average realism score (mean
                         = 3.86, SD = 1.57). We found no significant differences in realism scores across farm equipment
                         operator characteristics. The most frequently suggested improvements were to tighten the steering
Author Manuscript

                         wheel (27%), make the front tires visible (19%), and that no improvements were needed to
                         improve the simulator realism (18%). This study demonstrates that the new trac- tor miniSim is a
                         viable approach to studying farm equipment operations and events that can lead to tractor-related
                         crashes. Future studies should incorporate the suggested improvements and seek to validate the
                         simulator as a research and outreach instrument.

                    Kayla Faust, 821 Dover Street, Iowa City, IA 52245, Kayla-faust@uiowa.edu.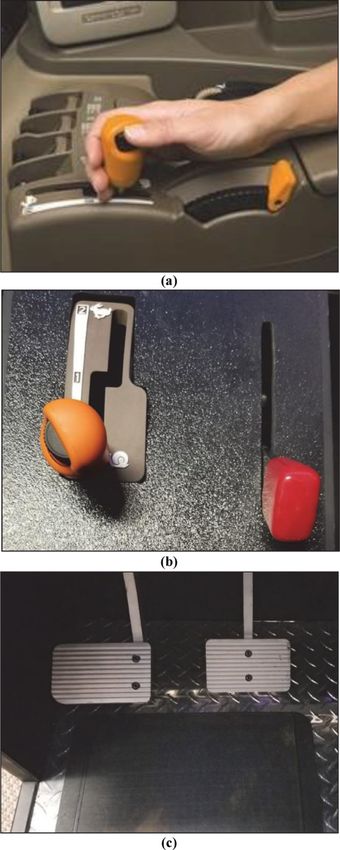
Faust et al.                                                                                                   Page 2

                        Keywords
Author Manuscript

                              Driving simulator; Farm equipment operators; Realism; Tractors

                        Introduction
                                        The agricultural industry has the highest rate of fatalities among all occupational industries
                                        in the U.S., with an annual fatality rate of 22.8 deaths per 100,000 full-time workers (BLS,
                                        2017). This industry also has the highest nonfatal injury rate, averaging 5.7 cases per 100
                                        full-time workers per year (BLS, 2016). Many of these injuries and fatalities can be
                                        attributed to agricultural equipment, particularly tractors (BLS, 2017; Peek-Asa et al., 2007;
                                        Toussaint et al., 2017).

                                        While there are numerous studies detailing the factors in passenger vehicle crashes, the same
Author Manuscript

                                        cannot be said about agricultural equipment (Görücü et al., 2014; Harland et al., 2018).
                                        Research on agricultural equipment crashes frequently focuses on crash reports, which are
                                        often incomplete (Harland et al., 2018; Peek-Asa et al., 2007; Ranapurwala et al., 2019;
                                        Toussaint et al., 2017). Other studies focus on environmental factors, such as road
                                        conditions, but not driving performance factors (Greenan et al., 2016). Vehicle performance,
                                        such as braking, steering, center of gravity, and field of view, are very different between
                                        passenger vehicles and tractors. The vehicle size, wheels, and engine power, among other
                                        things, are also quite different. Furthermore, farm equipment studies using primary data
                                        sources and those examining driver characteristics (particularly among older farm equipment
                                        operators) preceding vehicle crashes are tenuous.

                                        Whether due to safety, cost, or experimental control, simulated driving studies offer a safe,
Author Manuscript

                                        cost-effective, and with the use of smaller miniSim devices, portable way to conduct driving
                                        research that would not be feasible on public roadways (de Winter et al., 2012; Wassinek et
                                        al., 2006). Simulation allows researchers to measure how drivers respond to hazardous
                                        events in a simulated environment (designed to be realistic) without endangering the driver
                                        (Underwood et al., 2011). In addition to driver safety, use of a driving simulator in
                                        behavioral, operator performance, or crash research guarantees that different participants
                                        will experience identical driving conditions regarding route, traffic, lighting, weather, visual
                                        scene, and vehicle response (Kaptein et al., 1996). Results from simulation studies also
                                        typically require fewer resources to run and offer more experimental control than on-road
                                        research (Kaptein et al., 1996; Haug, 1990). Finally, although tractor-driving simulators have
                                        been built and used historically in product testing and driver safety, none of those simulators
                                        are mobile. Considering how common a barrier participant recruitment is within agricultural
Author Manuscript

                                        safety research, mobility is crucial for recruiting eligible participants and collecting data
                                        (Görücü et al., 2014; Deere, 2017, 2018; Prinz et al., 2009).

                                        Whenever a new driving simulator is designed, it is important to make the experience as
                                        similar to real-world driving as possible (Weir and Clark, 1995). Driving simulators can be
                                        customized with regard to the visual scenery, the user interface of the cab such as position
                                        and response of vehicle controls (i.e., velocity and steering controls), the ability to control
                                        the simulated vehicle, and the sounds associated with driving the vehicle (Gruening et al.,

                                           J Agric Saf Health. Author manuscript; available in PMC 2021 May 11.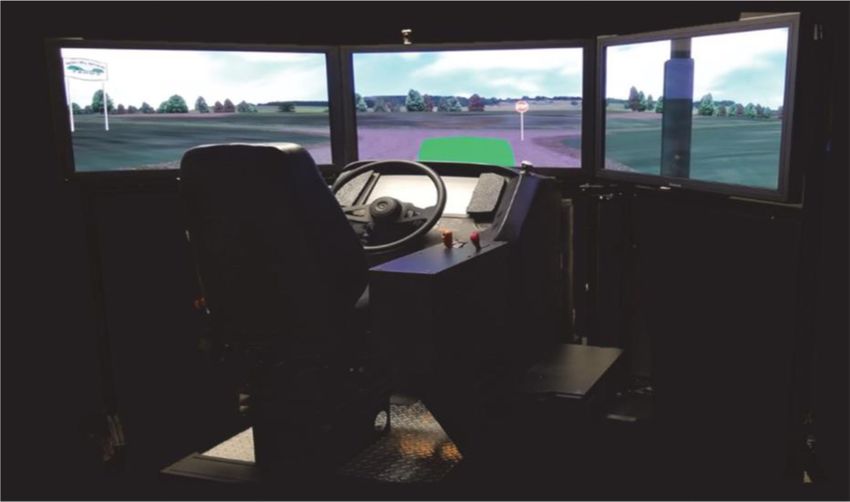
Faust et al. Page 3
1998). Once developed, realism surveys allow researchers to assess each feature and
Author Manuscript
determine if changes are needed (Blana, 1996; Freeman et al., 1995). Realism surveys
typically assess the simulated visual appearance of the road and other objects in the
simulated drive using a Likert scale (typically ranging from 0 to 6, where 0 = not at all
realistic and 6 = completely realistic), in which scores above 3 indicate a high degree of
realism and functional correspondence with an actual tractor (Lee et al., 2013; Schwarz et
al., 2003; Kay et al., 2013).
From this review of the literature, there is a paucity of research on assessing the realism of
tractor simulators. One important gap is how and what to measure in such simulators. The
purpose of this study was to examine four realism domains of a new tractor driving
simulator (i.e., appearance, user interface, vehicle control, and sound) and whether realism
varied by farm and farm equipment operator characteristics such as demographics (gender
and age), farm type (crop, livestock, or mixed), and tractor characteristics (i.e., tractor age
Author Manuscript
and the presence of a rollover protective structure (ROPS) or cab).
Materials and Methods
Design and Construction of New Tractor Simulator
Creating a simulator that mimics the appearance and feel of the vehicle type being studied is
critical when conducting driving simulation research (Kaptein et al., 1996). To ap- proximate
a realistic tractor cab, an existing heavy truck miniSim was repurposed and modified to
represent the controls and interface of a John Deere tractor (fig. 1). This model originally
simulated a semi-truck and was chosen because it had an interface similar to that used by
most farmers.
Author Manuscript
A John Deere instrument panel (fig. 2a) was simulated on an LCD screen on the new tractor
miniSim (fig. 2b). Tractor instrument panels have different features compared to passenger
vehicles. For example, unlike a passenger vehicle, which prominently features a
speedometer (measuring vehicle speed in miles per hour), tractor instrument panels typically
feature a tachometer (measuring engine speed in revolutions per minute) prominently and
may not even display a standard speedometer (fig. 2a).
Furthermore, unlike passenger vehicles, which have discrete gears and a gas pedal to control
the vehicle speed, many tractors use an infinitely variable transmission (IVT) for gear
shifting and a hand throttle to control the vehicle speed (fig. 3a). Therefore, a box was
mounted to the right side of the tractor miniSim with hand-based speed controls including
the IVT control and hand throttle (fig. 3b). The gas pedal was removed, leaving only a clutch
pedal and brake pedal (fig. 3c).
Author Manuscript
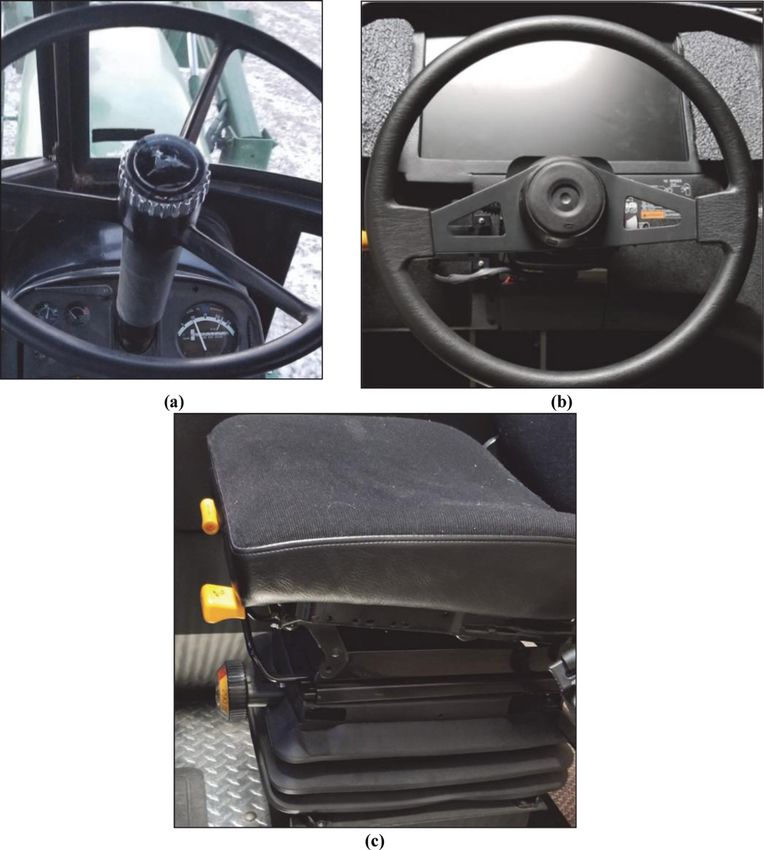
Steering wheels tend to be wider on tractors (fig. 4a) compared to passenger vehicles.
Sedans, sports utility vehicles, and pickup trucks tend to have steering wheels that are less
than 16 inches in diameter, while tractor steering wheels are typically 16 to 18 inches in
diameter. To account for this difference, the tractor simulator was outfitted with an 18-inch
steering wheel (fig. 4b). Finally, due to the amount of vibration and off-road driving, trac-
J Agric Saf Health. Author manuscript; available in PMC 2021 May 11.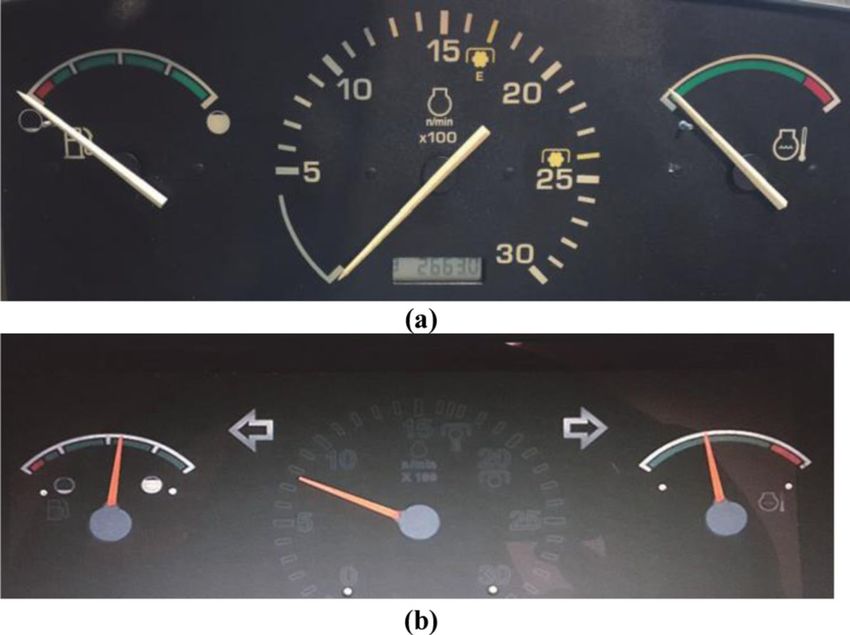
Faust et al.                                                                                              Page 4

                                   tors typically have a suspension seat; therefore, the existing seat was modified for the trac-
Author Manuscript

                                   tor miniSim to include a suspension base from an actual tractor cab (fig. 4c).

                                   Because the tractor miniSim did not use an actual cab, cab features were added to the visual
                                   display on the simulator. These included the tractor hood and exhaust stack (fig. 1). The
                                   pillars of the tractor cab were not simulated as it was determined that the bezels of the TV
                                   monitors sufficiently recreated this effect and that adding the pillars might excessively
                                   obscure the driver’s field of view. The eye point offset, which controls the position of the
                                   virtual cab relative to the driver’s eye point, was raised and adjusted until a reasonable
                                   approximation was attained. This was done to compensate for the height of the tractor
                                   relative to the height of passenger vehicles. The tractor miniSim software was also
                                   repurposed using an existing vehicle dynamics model and visual models used on the
                                   NADS-1 simulator. The NADS-1 simulator is a motion-based ground vehicle driving
                                   simulator that com- bines motion, graphics, audio, control feel, and software to produce an
Author Manuscript

                                   experience very close to real-time driving (https://www.nads-sc.uiowa.edu/sim_nads1.php).

                        Virtual Environment and Scenario Authoring
                                   A virtual environment displayed the ground, sky, buildings, and other static objects (e.g.,
                                   trees, fences, billboards, and road signs) to simulate a driving environment that is typical of
                                   a rural community. This study used an existing virtual environment of rural road- ways and
                                   fields with dynamic objects such as vehicles and pedestrians added into the environment
                                   with controlled vectors (i.e., path and speed) to create scenarios. Vehicles (particularly
                                   pickup trucks) were added sporadically to model ambient traffic. Farm buildings were added
                                   to enhance the rural environment. A user-controlled tractor model was also created to allow
                                   participants to drive within the simulated environment.
Author Manuscript

                        Screening and Recruitment
                                   Participants for this study were recruited from the University of Iowa’s National Advanced
                                   Driving Simulator (NADS) participant registry and by distributing fliers with study
                                   information in agricultural extension offices and applicable retail stores (e.g., farm/tractor
                                   supply stores, co-ops, restaurants) in counties within a 30-mile radius of the NADS study
                                   site. To be eligible for the study, farm equipment operators needed to be at least 25 years old,
                                   have a valid driver’s license, have at least three years of tractor operating experience, have
                                   operated a tractor in the past year, and be able to pass the Callahan six-item Mini Mental
                                   State Examination (Callahan et al., 2002). Additionally, farm equipment operators who had
                                   participated in a previous simulated driving study involving crash events or who had been
                                   dropped due to simulator sickness were considered ineligible for this study. Eligible farm
                                   equipment operators were scheduled for a single appointment, which lasted 60 to 90 minutes
Author Manuscript

                                   depending on time taken at NADS to complete the simulated drive and data collection.

                        Simulated Drive
                                   Participants were given pre-recorded turn-by-turn directions by the miniSim during a 10-
                                   minute simulated drive. The drive began with participants driving the tractor on a farm
                                   driveway on a clear day (i.e., good weather, daylight). Passing a pedestrian near a mailbox,
                                   they made a left turn onto a two-lane rural road with no shoulder. Although the road had a

                                      J Agric Saf Health. Author manuscript; available in PMC 2021 May 11.
Faust et al. Page 5
posted speed limit of 55 mph, the tractor had a maximum speed of 20 mph. After several
Author Manuscript
minutes of uneventful driving with ambient traffic, the participants encountered a rural four-
way intersection without stop signs or stop lights. As the participants approached the
intersection, a simulated semi-truck traveling perpendicular to the tractor also approached
the intersection from the left. After the semi-truck had passed through the intersection,
participants were instructed to make a right turn, placing them behind the semi-truck. After a
few minutes of uneventful driving, the farm equipment operators were instructed to bring the
tractor to a stop and place it into park on the side of the road to end the drive.
Data Collection and Variables
Participants traveled to the NADS in Iowa City for the simulated drive, administration of
informed consent, and data collection. Prior to the simulated drive, all participants
completed a pre-drive questionnaire that collected demographic information (i.e., age and
Author Manuscript
gen- der), farm type (i.e., crop, livestock, or mixed), and information about the tractor that
they drove most frequently (i.e., tractor age and the presence of a ROPS or cab). Tractors
have varied substantially over the years in their size, power, and cab design (https://
americanhistory.si.edu/tractor). Therefore, it was important to understand if the types of
tractors driven by the participants affected their perceived realism of the simulated tractor.
Participants were asked to provide the make, model, and year of the tractor they drove most
frequently. They were also asked if the tractor they drove most frequently had an enclosed
cab or a ROPS. Farm type was categorized as crop, mixed (e.g., crops and livestock), or
other. Participants who did not work or live on a farm (n = 4), who only raised livestock (n =
1), or who lived on non-producing acreage (n = 2) were combined to make the “other”
category due to the concern that they may not have as much experience driving tractors
compared to participants from crop farms and mixed farms.
Author Manuscript
Prior to completing the simulated drive, all participants watched a short PowerPoint
presentation demonstrating how to operate the simulator. Following the simulated drive, a
self-administered realism survey was completed by each participant. The realism survey
consisted of 15 questions using a seven-point Likert scale (where 0 = not at all realistic and
6 = completely realistic) as well as four open-ended questions. The survey was modified
from a previous NADS simulator realism survey to include the new features of the tractor
miniSim (Lee et al., 2013; Schwarz et al., 2003). The survey covered four domains:
appearance, user interface, control, and sound. The five items in the appearance domain
concerned the visual representation of simulated objects and asked participants to rate how
realistic vehicles, pedestrians, and other objects appeared in the simulated environment. The
five items in the user interface domain concerned the tactile feel of the tractor mini- Sim’s
hardware and asked participants to rate how realistically the IVT, brakes, and other hardware
Author Manuscript
responded to their input. The three items in the control domain concerned the response of
the simulated tractor to driver input and asked participants to rate the ability to keep straight
in the lane and the simulator’s response when braking and accelerating. The two questions in
the sound domain concerned the sound of the tractor engine and the sound of other vehicles
in the ambient traffic. The four open-ended questions asked:
1. What about the simulator seemed most unrealistic?
J Agric Saf Health. Author manuscript; available in PMC 2021 May 11.Faust et al. Page 6
2. What could be done to make the simulator more realistic?
Author Manuscript
3. Was anything so unrealistic that it affected the way you drove?
4. Is there anything else you would like to say about our simulator or driving
tractors?
Analysis
Descriptive statistics were calculated for the participant demographics (age and gender),
characteristics of the tractor driven most frequently (tractor age and presence of a cab or
ROPS), and farm type. Age was categorized into older farmers (65+ years) and younger
farmers (25 to 64 years).
Approximately 25% of the participants did not know the age of the tractor they drove most
frequently. However, 76% of them provided sufficient details regarding the tractor make and
Author Manuscript
model that the tractor age could be deduced. Tractors manufactured before 1985 were
categorized as antique tractors, while those manufactured in 1985 or later were categorized
as modern tractors in accordance with the release of a new voluntary safety standard to sell
all new tractors with ROPS (ASABE, 2017).
Mean realism domain scores for each participant were calculated by summing the item
ratings within each domain and dividing that total by the number of item ratings in that
domain (appearance maximum score = 30, user interface maximum score = 30, control
maximum score = 18, and sound maximum score = 12). A total overall score was calculated
for each participant using the sum of all 15 survey items.
The association between participant demographics (age and gender), tractor characteristics
Author Manuscript
(tractor age and ROPS or cab installed), and realism scores were examined using t- tests
when scores were normally distributed (i.e., user interface, control, and total realism) and
using the Wilcoxon rank sum test when scores were not normally distributed (i.e.,
appearance and sound). Analysis of variance (ANOVA) was used to examine the association
between farm type and normally distributed domain scores, and the Kruskal-Wallis test was
used when scores were not normally distributed.
Responses from the four open-ended questions were analyzed using a hybrid of de- ductive
coding for realism domains and inductive coding for subthemes and additional suggestions
(Fereday and Muir-Cochrane, 2006; Linneberg and Korsgaard, 2019). If a participant made
more than one comment on the same theme (e.g., if a participant mentioned that steering
was most unrealistic and also mentioned fixing the steering to make it more realistic), it was
only documented once. Comments were grouped by the four domains. Compliments about
Author Manuscript
the simulator and comments that that did not clearly offer a suggestion for improvement
were combined to form a “no suggested improvements” category.
J Agric Saf Health. Author manuscript; available in PMC 2021 May 11.Faust et al. Page 7
Results
Author Manuscript
Study Population
A total of 156 farm equipment operators were contacted about the study, 118 of whom were
identified through the NADS registry. The remaining 38 reached out to the research team
after seeing a flier or news story. Among all contacted farm equipment operators, 134 (86%)
were screened as eligible to participate. However, 35 of them were unable to find time to
participate in the study, resulting in a final sample size of 99 farm equipment operators and a
participation rate of 74%.
Approximately one-third of the study population was at least 65 years of age (range: 65 to
93, mean: 72 years). The younger farm equipment operators (3 on a scale from 0 to 6) were reported for all individual items and domains,
regardless of age category (Schwarz et al., 2003; Kay et al., 2013). The appearance domain
had the highest overall score (mean = 4.58, SD = 1.03), and the sound domain had the
lowest average score (mean = 3.86, SD = 1.57).
Author Manuscript
The highest-scored individual items for older farm equipment operators were for appearance
of the road (mean = 4.72, SD = 1.25) and appearance of the rural scenery (mean= 4.72, SD =
1.20). Younger farm equipment operators scored the appearance of the instrument panel as
most realistic (mean = 4.61, SD = 1.31), followed by the appearance of other vehicles (mean
= 4.52, SD = 1.26). The lowest-scored individual item for older farm equipment operators
was the response of the steering wheel (mean = 3.13, SD = 1.88), while the response of the
IVT control received the lowest realism score from younger farm equipment operators
(mean = 3.67, SD = 1.45).
Measures of the association between the participant and farm characteristics and the realism
domain scores are presented in table 3. No significant differences were observed between
Author Manuscript
the participant and farm characteristics and the realism domain scores.
Changes Suggested by Participants
Suggestions from the participants for improving the tractor miniSim are presented in table 4.
The most frequently suggested improvement was to tighten the steering in the user interface
domain (n = 27). In the appearance domain, being able to see the tractor’s front tires on the
ground was the most common suggested improvement (n = 19). In addition to tightening the
J Agric Saf Health. Author manuscript; available in PMC 2021 May 11.Faust et al. Page 8
steering in the user interface domain, adding engine size options (n = 15) and adding more
Author Manuscript
gears (n = 11) were frequently mentioned. In the control domain, adding an automatic
transmission was suggested by two participants. There were five comments suggesting that
the simulator be louder. Additionally, there were 18 comments that no improvements were
needed to the simulator realism.
Discussion
Overall, the tractor simulator developed and used for this study received favorable realism
scores, and no significant differences between farm equipment operator characteristics and
the realism domains were observed. Realism scores for the simulator matched or exceeded
scores observed in studies using similar simulators (Lee et al., 2013; Schwarz et al., 2003).
We also received important feedback about how the simulator could be improved.
Author Manuscript
Favorable scores (i.e., >3 on a scale from 0 to 6) were seen for all individual items and
realism domains of the participant survey. The appearance domain was the highest scoring
domain and also contained the highest scoring individual items (e.g., appearance of the
instrument panel, road, and other vehicles) regardless of age group.
The sound domain was the lowest scoring domain. When idling, tractors produce ap-
proximately 80 dB of noise, and can surpass 120 dB when working at full load. The danger
to a person’s hearing at this noise level is immediate. Therefore, to reduce the risk of hearing
loss to the participants in this study, we kept the volume of the tractor simulator to 70 dB.
Additionally, because of the noise produced by tractors, farm equipment operators are
frequently unable to hear sounds produced by other vehicles. Therefore, being able to hear
other vehicles is unrealistic in a tractor and may have contributed to the lower scores in the
sound domain. These anomalies could be corrected by disabling the sounds of other vehicles
Author Manuscript
in the scenario’s program code or by running the simulator at full volume and supplying the
participants with appropriate hearing protection. We also found that older farm equipment
operators had lower sound domain scores than younger farm equipment opera- tors, which
may be due to the higher prevalence of hearing loss in older adults (Cruickshanks et al.,
1998).
The domain realism scores did not vary by age or other characteristics, which suggests that
the perceived realism of the simulator was not influenced significantly by any of the factors
examined. Therefore, modifications made to future generations of the tractor mini- Sim can
focus on the domain scores and suggested improvements, regardless of farm equipment
operator demographics and tractor characteristics.
Author Manuscript
Most of the comments were related to the appearance (n = 37) and user interface (n =60)
domains. Several of the suggested improvements to the tractor miniSim were directly related
to individual items on the realism survey. For example, the most common suggestion was to
tighten the steering wheel on the simulator (n = 27). This likely corresponds to the lowest
scoring individual questionnaire item (“response of the steering wheel”). Tightening the
steering wheel could easily be achieved by increasing the tension of the steering column.
The tractor miniSim was designed with power steering. While the steering wheel may have
J Agric Saf Health. Author manuscript; available in PMC 2021 May 11.Faust et al. Page 9
loosened over the course of the study due to frequent use, it is also possible that participants
Author Manuscript
were biased by the presence of power steering, which many antique and some modern
tractors do not have or may need to have repaired.
The second lowest scoring individual item (“ability to keep straight in your lane”) is
potentially a direct effect of not being able to see the tires while driving, which was the
second most common suggestion made by the participants for improving the simulator. This
is important for tractors, as farm equipment operators frequently use the tires to estimate
lateral distances on the road and in the field. One way to modify the tractor simulator would
be to include additional monitors below the left and right screens or rotate the current
monitors by 90°, which would increase the field of view and allow farm equipment operators
to see the tire position on the road. This may also require adjusting the eye point and linking
the tire rotation speed to the tractor model’s velocity.
Author Manuscript
Several participants suggested adding additional engine sizes and gears to represent a range
of tractors. The engine horsepower for the tractor used in this study was greater than 100 hp.
While beyond the scope of this study, future research should consider incorporating different
sizes of tractor simulators. Separate models of tractors could include those withFaust et al. Page 10
they were comparing the realism of the tractor miniSim in this study to other types of
Author Manuscript
driving simulators that they have driven in the past (e.g., a heavy semi-truck or passenger
vehicle simulator). Future studies may want to screen out farm equipment operators who
have participated in other simulated driving studies to eliminate comparisons between
simulators. Future studies may also want to include multiple simulators and compare realism
scores across simulator types (i.e., passenger vehicle, heavy truck, tractor).
Conclusions
This study demonstrated that the new tractor miniSim is a viable approach to studying farm
equipment operations and events that can lead to tractor-related crashes. We found that farm
equipment operators rated the simulator’s realism favorably (i.e., >3 on a scale from 0 to 6)
for all realism domains (appearance, user interface, control, and sound). We also found no
significant differences in realism scores across farm equipment operator characteristics.
Author Manuscript
Furthermore, in addition to improving participant safety by not using real- world tractors,
use of a driving simulator in behavioral, operator performance, or crash research guarantees
that different participants will experience identical driving conditions regarding the route,
traffic, lighting, weather, visual scene, crash situation, and vehicle response. The tractor
miniSim, with its high realism scores and versatility, is a promising new tool for studying
human factors in tractor operation in real time.
Acknowledgements
We would like to acknowledge Chris Schwarz and Jon Davis for their assistance with data reduction and analysis.
We would also like to acknowledge Andy Veit for assisting in the design and construction of the tractor miniSim,
Shawn Allen for designing the user interface and visual database for the simulation, and Alec La Velle for
programing the driving scenario. This study was funded by the University of Iowa Injury Prevention Research
Center (Grant No. R49 PA-CE001167), Healthier Workforce Center of the Midwest (Grant No. U19 OH008868),
Author Manuscript
Heartland Center for Occupational Health and Safety (Grant No. T42 OH008491) and Great Plains Center for
Agricultural Health (Grant No. U54 OH007548).
Funding: Grant sponsor: The Healthier Workforce Center of the Midwest: Grant no. R49 PA-CE001167; The
University of Iowa Injury Prevention Research Center: Grant No. R49 PA-CE001167; The Heartland Center for
Occupational Health and Safety: Grant No. T42 OH008491; and The Great Plains Center for Agricultural Health:
Grant No. U54 OH007548.
References
ASABE. (2017). S318.18: Safety for agricultural field equipment. St. Joseph, MI: ASABE.
Blana E. (1996). Driving simulator validation studies: A literature review. Working paper. Leeds,UK:
University of Leeds, Institute of Transport Studies.
BLS. (2016). Incidence rates of nonfatal occupational injuries and illnesses by case type
andownership, selected industries. Washington, DC: Bureau of Labor Statistics.
Author Manuscript
BLS. (2017). Number and rate of fatal work injuries by industry sector. Washington, DC: Bureau
ofLabor Statistics.
Callahan CM, Unverzagt FW, Hui SL, Perkins AJ, & Hendrie HC (2002). Six-itemscreener to identify
cognitive impairment among potential subjects for clinical research. Med.Care, 40(9), 771–781.
10.1097/00005650-200209000-00007 [PubMed: 12218768]
Cruickshanks KJ, Wiley TL, Tweed TS, Klein BE, Klein R, Mares-Perlman JA, &Nondahl DM (1998).
Prevalence of hearing loss in older adults in Beaver Dam, Wisconsin: Theepidemiology of hearing
loss study. American J. Epidemiol, 148(9), 879–886. 10.1093/oxfordjournals.aje.a009713
J Agric Saf Health. Author manuscript; available in PMC 2021 May 11.Faust et al. Page 11
Deere. (2017). Simulators. Moline, IL: Deere and Co. Retrieved from https://www.deere.com/en/parts-
and-service/manuals-and-training/simulators/
Author Manuscript
Deere. (2018). Training. Moline, IL: Deere and Co. Retrieved from https://www.deere.com/en/
stellarsupport/training/
de Winter JCF, van Leeuwen P,M, & Happe R. (2012). Advantages and disadvantages of driving
simulators: A discussion. In Spink AJ, Grieco F, Krips OE, Loijens LW, Noldus LP, & Zimmerman
PH (Eds.), Proc. Measuring Behavior 2012 (pp. 47–50). Wagenigen, The Netherlands: Noldus
Information Technology.
Fereday J, & Muir-Cochrane E. (2006). Demonstrating rigor using thematic analysis: A hybrid
approach of inductive and deductive coding and theme development. Intl. J. Qualitative Methods,
5(1), 80–92. 10.1177/160940690600500107
Freeman JS, Watson G, Papelis YE, Lin TC, Tayyab A, Romano RA, & Kuhl JG (1995). The Iowa
driving simulator: An implementation and application overview. Proc. SAE Intl. Congress and
Exposition Warrendale, PA: SAE. 10.4271/950174
Garrott WR, Grygier PA, Chrstos JP, Heydinger GJ, Salaani K, Howe JG, & Guenther DA (1997).
Methodology for validating the National Advanced Driving Simulator’s vehicle dynamics
Author Manuscript
(NADSdyna). Proc. SAE Intl. Congress and Exposition Warrendale, PA: SAE. 10.4271/970562
Görücü S, Cavallo E, & Murphy D. (2014). Perceptions of tilt angles of an agricultural tractor. J.
Agromed, 19(1), 5–14. 10.1080/1059924X.2013.855690
Greenan M, Toussaint M, Peek-Asa C, Rohlman D, & Ramirez MR (2016). The effects of roadway
characteristics on farm equipment crashes: A geographic information systems approach. Injury
Epidemiol, 3(1), 31. 10.1186/s40621-016-0096-1
Gruening J, Bernard J, Clover C, & Hoffmeister K. (1998). Driving simulation. Proc. SAE Intl.
Congress and Exposition Warrendale, PA: SAE. 10.4271/980223
Harland KK, Bedford R, Wu H, & Ramirez M. (2018). Prevalence of alcohol impairment and odds of a
driver injury or fatality in on-road farm equipment crashes. Traffic Inj. Prev, 19(3), 230–234.
10.1080/15389588.2017.1407924 [PubMed: 29211499]
Haug EJ (1990). Feasibility study and conceptual design of a National Advanced Driving Simulator.
Report No. HS-807 596. Washington, DC: National Highway Traffic Safety Administration.
Kamel Salaani M, Grygier PA, & Heydinger GJ (2003a). Evaluation of heavy tractor-trailer model
Author Manuscript
used in the National Advanced Driving Simulator. SAE Trans, 112(6), 1440–1454.
10.4271/2003-01-1324
Kamel Salaani M, Grygier PA, & Heydinger GJ (2003b). Heavy tractor-trailer vehicle dynamics
modeling for the National Advanced Driving Simulator. SAE Trans, 112(6), 1018–1031.
10.4271/2003-01-0965
Kaptein NA, Theeuwes J, & van der Horst R. (1996). Driving simulator validity: Some considerations.
Transp. Res. Rec, 1550(1), 30–36. 10.1177/0361198196155000105
Kay G, Ahmad O, Brown T, & Veit A. (2013). Comparison of the MiniSim and STISim driving
simulators for the detection of impairment: An alcohol validation study. Proc. 2013 Driving
Assessment Conf (pp. 191–197).
Iowa City IA: University of Iowa, Public Policy Center. 10.17077/drivingassessment.1487
Lee J,D, Ward N, Boer E, Brown T,L, Balk S,A, & Ahmad O. (2013). Exploratory advanced research:
Making driving simulators more useful for behavioral research - Simulator characteristics
comparison and model-based transformation. Final report. Springfield, VA: Federal Highway
Administration, Office of Safety Research and Development.
Author Manuscript
Linneberg MS, & Korsgaard S. (2019). Coding qualitative data: A synthesis guiding the novice.
Qualitative Res. J, 19(3), 259–270. 10.1108/QRJ-12-2018-0012
Myers ML, Westneat SC, Myers JR, & Cole HP (2009). Prevalence of ROPS-equipped tractors in U.S.
aquaculture. J. Agric. Saf. Health, 15(2), 185–194. 10.13031/2013.26804 [PubMed: 19496346]
Peek-Asa C, Sprince NL, Whitten PS, Falb SR, Madsen MD, & Zwerling C. (2007). Characteristics of
crashes with farm equipment that increase potential for injury. J. Rural Health, 23(4), 339–347.
10.1111/j.1748-0361.2007.00112.x [PubMed: 17868241]
Prinz L, Kaiser M, Kaiserl KL, & Von Essen S,G (2009). Rural agricultural workers and factors
affecting research recruitment. J. Rural Nurs. Health Care, 9(1), 69–81. 10.14574/ojrnhc.v9i1.106
J Agric Saf Health. Author manuscript; available in PMC 2021 May 11.Faust et al. Page 12
Ranapurwala SI, Cavanaugh JE, Young T, Wu H, Peek-Asa C, & Ramirez MR (2019). Public health
application of predictive modeling: An example from farm vehicle crashes. Injury Epidemiol, 6(1),
Author Manuscript
31. 10.1186/s40621-019-0208-9
Schwarz C, Hench S, Gilmore B, Romig B, Watson G, Dolan J, … Cable S. (2003). Development of
an off-road agricultural virtual proving ground. Proc. Driving Simulation Conf., North America.
Iowa City, IA: University of Iowa.
Sorensen JA, Jenkins P, Bayes B, Clark S, & May JJ (2010). Cost-effectiveness of a ROPS social
marketing campaign. J. Agric. Saf. Health, 16(1), 31–40. 10.13031/2013.29247 [PubMed:
20222269]
Toussaint M, Faust K, Peek-Asa C, & Ramirez M. (2017). Characteristics of farm equipment related
crashes associated with injury in children and adolescents on farm equipment. J. Rural Health,
33(2), 127–134. 10.1111/jrh.12162 [PubMed: 26633235]
Underwood G, Crundall D, & Chapman P. (2011). Driving simulator validation with hazard
perception. Transport. Res. Part F: Traffic Psychol. Behav, 14(6), 435–446. 10.1016/
j.trf.2011.04.008
USDA. (2017). Census of agriculture. Washington, DC: USDA National Agricultural Statistic Service.
Author Manuscript
Wassink I, van Dijk B, Zwiers J, Nijholt A, Kuipers J, & Brugman A. (2006). In The Truman Show:
Generating dynamic scenarios in a driving simulator. IEEE Intell. Syst, 21(5), 28–32. 10.1109/
MIS.2006.97
Weir DH, & Clark AJ (1995). A survey of mid-level driving simulators. SAE Trans, 104, 86–106.
10.4271/950172
Author Manuscript
Author Manuscript
J Agric Saf Health. Author manuscript; available in PMC 2021 May 11.Faust et al. Page 13
Highlights
Author Manuscript
• Describes the creation of a new high-fidelity tractor driving simulator.
• Describes the perceived realism of a tractor driving simulator among 99
Midwestern farm equipment operators.
• Examines how farm equipment operator characteristics affect perceived
realism of a tractor driving simulator.
• Discusses potential improvements for future generations of tractor driving
simulators.
Author Manuscript
Author Manuscript
Author Manuscript
J Agric Saf Health. Author manuscript; available in PMC 2021 May 11.Faust et al. Page 14
Author Manuscript
Author Manuscript
Figure 1.
New tractor miniSim.
Author Manuscript
Author Manuscript
J Agric Saf Health. Author manuscript; available in PMC 2021 May 11.Faust et al. Page 15
Author Manuscript
Author Manuscript
Figure 2.
Instrument panels from (a) an actual John Deere tractor and (b) the simulated instrument
panel designed for the tractor miniSim.
Author Manuscript
Author Manuscript
J Agric Saf Health. Author manuscript; available in PMC 2021 May 11.Faust et al. Page 16
Author Manuscript
Author Manuscript
Author Manuscript
Figure 3.
Author Manuscript
Hand and foot controls: (a) IVT control and hand throttle in an actual tractor, (b) miniSim
IVT control and hand throttle, and (c) miniSim clutch and brake pedals.
J Agric Saf Health. Author manuscript; available in PMC 2021 May 11.Faust et al. Page 17
Author Manuscript
Author Manuscript
Author Manuscript
Figure 4.
Author Manuscript
Steering wheels (a) in an actual John Deere cab and (b) installed on the tractor miniSim, and
(c) seat suspension installed on the tractor miniSim.
J Agric Saf Health. Author manuscript; available in PMC 2021 May 11.Faust et al. Page 18
Table 1.
Farm equipment characteristics (N = 99).
Author Manuscript
Category Value n %
Operator age 65+ 31 31.3Faust et al. Page 19
Table 2.
Realism scores by age group.
Author Manuscript
All Participants Age 65+ AgeFaust et al. Page 20
Table 3.
Realism domains by participant and farm characteristics.
Author Manuscript
Appearance User Interface Control Sound Total Realism
Characteristic Mean SD Mean SD Mean SD Mean SD Mean SD
Operator age
65+ 4.63 0.93 3.99 1.12 3.78 1.1 3.72 1.65 4.12 0.98Faust et al. Page 21
Table 4.
Suggested improvements to the tractor simulator.
Author Manuscript
Appearance Domain (37 User Interface Domain (60 Control Domain (3 Sound Domain (7 Additional Suggestions (25
comments) comments) comments) comments) comments)
See the tires (19) Tighten the steering (27) Add automatic Make tractor louder No changes needed (18)
transmission (2) (5)
Improve the rural Add engine size options (15) Improve the brakes Add a radio (1) Add Compliments for the study or
environment (9) (1) wind simulator (3)
Increase the field of view Add more gears (11) noise (1) Use a real tractor cab (2)
(6)
Improve the tractor (3) Add seat actuator for Paint the hardware (1)
vibration (5)
Tilt steering column (2) Add farm smells (1)
Author Manuscript
Author Manuscript
Author Manuscript
J Agric Saf Health. Author manuscript; available in PMC 2021 May 11.You can also read