J.P. Morgan European Materials Conference - June 7th, 2021 - Lundin Mining ...
←
→
Page content transcription
If your browser does not render page correctly, please read the page content below

J.P. Morgan European Materials Conference
                                                 June 7 th , 2021

TSX: LUN Nasdaq Stockholm: LUMI                                               Candelaria, Atacama Region, Chile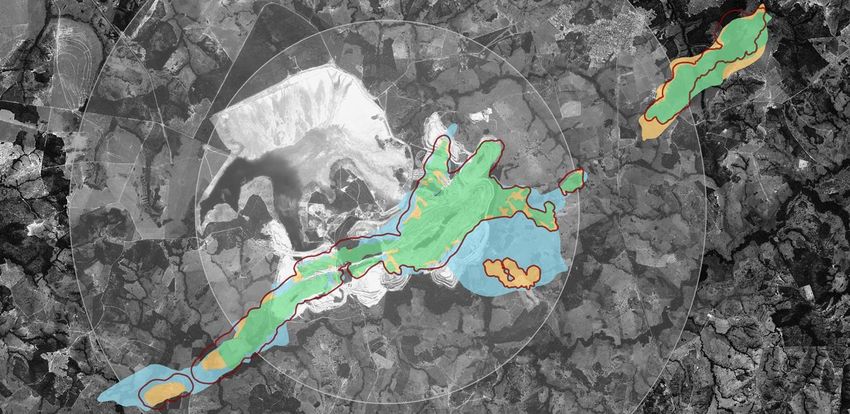
Cautionary Statements
Caution Regarding Forward-Looking Information and Non-GAAP Performance Measures
Certain of the statements made and information contained herein is “forward-looking information” within the meaning of applicable Canadian securities laws. All statements other than statements of historical facts included in this
document constitute forward-looking information, including but not limited to statements regarding the Company’s plans, prospects and business strategies; the Company’s guidance on the timing and amount of future production
and its expectations regarding the results of operations; expected costs; permitting requirements and timelines; timing and possible outcome of pending litigation; the results of any Preliminary Economic Assessment, Feasibility
Study, or Mineral Resource and Mineral Reserve estimations, life of mine estimates, and mine and mine closure plans; anticipated market prices of metals, currency exchange rates, and interest rates; the development and
implementation of the Company’s Responsible Mining Management System; the Company’s ability to comply with contractual and permitting or other regulatory requirements; anticipated exploration and development activities at
the Company’s projects; and the Company’s integration of acquisitions and any anticipated benefits thereof. Words such as “believe”, “expect”, “anticipate”, “contemplate”, “target”, “plan”, “goal”, “aim”, “intend”, “continue”, “budget”,
“estimate”, “may”, “will”, “can”, “could”, “should”, “schedule” and similar expressions identify forward-looking statements.

Forward-looking information is necessarily based upon various estimates and assumptions including, without limitation, the expectations and beliefs of management, including that the Company can access financing, appropriate
equipment and sufficient labor; assumed and future price of copper, nickel, zinc, gold and other metals; anticipated costs; ability to achieve goals; the prompt and effective integration of acquisitions; that the political environment in
which the Company operates will continue to support the development and operation of mining projects; and assumptions related to the factors set forth below. While these factors and assumptions are considered reasonable by
Lundin Mining as at the date of this document in light of management’s experience and perception of current conditions and expected developments, these statements are inherently subject to significant business, economic and
competitive uncertainties and contingencies. Known and unknown factors could cause actual results to differ materially from those projected in the forward-looking statements and undue reliance should not be placed on such
statements and information. Such factors include, but are not limited to: risks inherent in mining including but not limited to risks to the environment, industrial accidents, catastrophic equipment failures, unusual or unexpected
geological formations or unstable ground conditions, and natural phenomena such as earthquakes, flooding or unusually severe weather; uninsurable risks; global financial conditions and inflation; changes in the Company’s share
price, and volatility in the equity markets in general; volatility and fluctuations in metal and commodity prices; the threat associated with outbreaks of viruses and infectious diseases, including the COVID-19 virus; changing taxation
regimes; reliance on a single asset; delays or the inability to obtain, retain or comply with permits; risks related to negative publicity with respect to the Company or the mining industry in general; health and safety risks; exploration,
development or mining results not being consistent with the Company’s expectations; unavailable or inaccessible infrastructure and risks related to ageing infrastructure; actual ore mined and/or metal recoveries varying from
Mineral Resource and Mineral Reserve estimates, estimates of grade, tonnage, dilution, mine plans and metallurgical and other characteristics; risks associated with the estimation of Mineral Resources and Mineral Reserves and the
geology, grade and continuity of mineral deposits including but not limited to models relating thereto; ore processing efficiency; community and stakeholder opposition; information technology and cybersecurity risks; potential for
the allegation of fraud and corruption involving the Company, its customers, suppliers or employees, or the allegation of improper or discriminatory employment practices, or human rights violations; regulatory investigations,
enforcement, sanctions and/or related or other litigation; uncertain political and economic environments, including in Brazil and Chile; risks associated with the structural stability of waste rock dumps or tailings storage facilities;
estimates of future production and operations; estimates of operating, cash and all-in sustaining cost estimates; civil disruption in Chile; the potential for and effects of labor disputes or other unanticipated difficulties with or
shortages of labor or interruptions in production; risks related to the environmental regulation and environmental impact of the Company’s operations and products and management thereof; exchange rate fluctuations; reliance on
third parties and consultants in foreign jurisdictions; climate change; risks relating to attracting and retaining of highly skilled employees; compliance with environmental, health and safety laws; counterparty and credit risks and
customer concentration; litigation; risks inherent in and/or associated with operating in foreign countries and emerging markets; risks related to mine closure activities and closed and historical sites; changes in laws, regulations or
policies including but not limited to those related to mining regimes, permitting and approvals, environmental and tailings management, labor, trade relations, and transportation; internal controls; challenges or defects in title; the
estimation of asset carrying values; historical environmental liabilities and ongoing reclamation obligations; the price and availability of key operating supplies or services; competition; indebtedness; compliance with foreign laws;
existence of significant shareholders; liquidity risks and limited financial resources; funding requirements and availability of financing; enforcing legal rights in foreign jurisdictions; dilution; risks relating to dividends; risks associated
with acquisitions and related integration efforts, including the ability to achieve anticipated benefits, unanticipated difficulties or expenditures relating to integration and diversion of management time on integration; activist
shareholders and proxy solicitation matters; and other risks and uncertainties, including but not limited to those described in the “Risk and Uncertainties” section of the Annual Information Form and the “Managing Risks” section of
the Company’s MD&A for the year ended December 31, 2020, which are available on SEDAR at www.sedar.com under the Company’s profile. All of the forward-looking statements made in this document are qualified by these
cautionary statements. Although the Company has attempted to identify important factors that could cause actual results to differ materially from those contained in forward-looking information, there may be other factors that
cause results not to be as anticipated, estimated, forecast or intended and readers are cautioned that the foregoing list is not exhaustive of all factors and assumptions which may have been used. Should one or more of these risks
and uncertainties materialize, or should underlying assumptions prove incorrect, actual results may vary materially from those described in forward-looking information. Accordingly, there can be no assurance that forward-looking
information will prove to be accurate and forward-looking information is not a guarantee of future performance. Readers are advised not to place undue reliance on forward-looking information. The forward-looking information
contained herein speaks only as of the date of this document. The Company disclaims any intention or obligation to update or revise forward‐looking information or to explain any material difference between such and subsequent
actual events, except as required by applicable law.

This presentation may contain certain financial measures such as adjusted earnings, adjusted loss, EBITDA, net cash, net debt, adjusted operating cash and cash costs which have no standardized meaning within generally accepted
accounting principles under IFRS and therefore amounts presented may not be comparable to similar data presented by other mining companies. This data is intended to provide additional information and should not be
considered in isolation or as a substitute for measures or performance prepared in accordance with IFRS.
                                                                                                                                                                                                                                                  2
Note: All dollar amounts are in US dollars unless otherwise denoted.
Lundin Mining
Our Strategy
Operate, upgrade and grow a base metals
portfolio that provides leading returns for our
shareholders throughout the cycle

  •    copper dominant
  •    competitive cost position
                                                                                       Eagle                                             Zinkgruvan
  •    low-risk mining jurisdictions                                         Nickel-Copper-PGMs in U.S.A.                           Zinc-Lead-Copper in Sweden

  •    pipeline of exploration and
       development projects
  •    low leverage and flexible balance
       sheet
  •    attractive direct shareholder returns

                                                                                                                                        Neves-Corvo
                                                                                                                                    Copper-Zinc-Lead in Portugal

                                                           Candelaria1
                                                       Copper-Gold-Silver in Chile                             Chapada
                                                                                                            Copper-Gold in Brazil

1. Lundin Mining holds an 80% interest in Candelaria
                                                                                                                                                                   3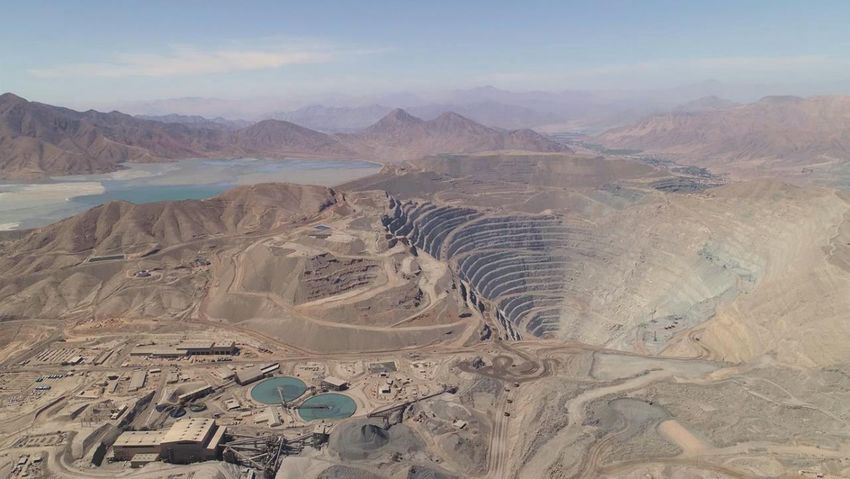
Responsible Mining
•    sustainability strategy provides a framework for identifying focus areas                 Recent Responsible Mining in Action
     that will reduce risks, increase opportunities, and add long-term value
                                                                                          •    formalized Human Rights Standard to complement and enhance prior commitments
•    we have reported on our sustainability performance in a                                   to Human Rights in our core documents
     comprehensive, standalone document since 2011
                                                                                          •    committed to the implementation of the Global Industry Standard on Tailings
•    operations continue to focus on prevention of workplace and                               Management (GISTM)
     community COVID-19 infection
                                                                                          •    updated Diversity & Inclusion Policy to include the specific target that Board and
                                                                                               executive officer positions be comprised of at least 30% women
Total Recordable Injury Frequency
per 200,000 person hours worked                                                           •    actions taken to ensure renewal of people and perspectives on the Board, including
                                                                                               age limits

    3.5
                                                                                          •    strengthened Board on key jurisdiction industry experience, ESG matters and climate
                                                                                               change initiatives with appointment of Ms. Karen Poniachik, a Chilean national

                2.5

                      2.0

          1.6               1.60

                                   0.86
                                          0.64           0.67   0.66
                                                 0.56                   0.55   0.53

                                                                                      1
    2010 2011 2012 2013 2014 2015 2016 2017 2018 2019 2020 2021
                                   1. For the three-month period ended March 31, 2021                                        Candelaria testing replacement of current fleet with 100% electric buses   4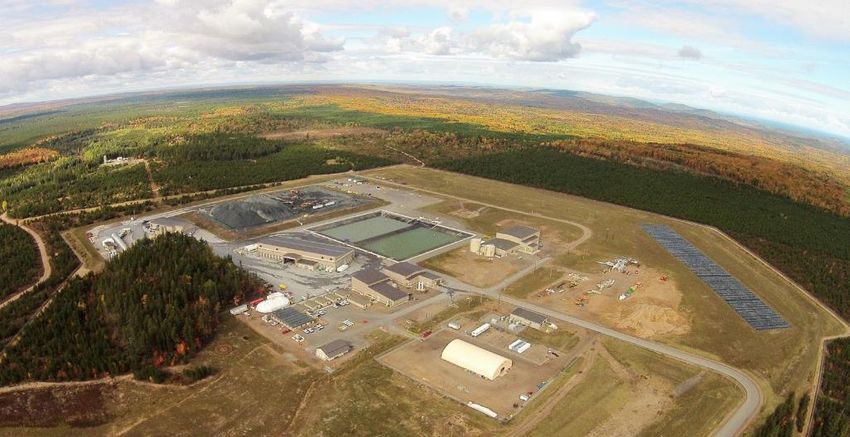
Q1/21 Summary Results
                                                                Production           Payable Sales
                                                                57,354 t of copper   53,780 t of copper

                                                                33,365 t of zinc     27,308 t of zinc

                                                                34,000 oz of gold    33,000 oz of gold

                                                                5,354 t of nickel    4,118 t of nickel

                                                                5,782 t of lead      5,950 t of lead

                                                                           $681M in Sales

                                                                Other                            Sweden
                                                                 6%                                6%

                                                              Gold
                                                               6%                           Portugal
                                                       Zinc                                   12%
                                                       8%

                                                     Nickel                             Brazil            Chile
                                                                        Copper
                                                      10%                               13%               52%
                                                                         70%

                                                                                                 USA
                                                                                                 17%

                   Candelaria 544 Ramp Development
                                                              By Metal                      By Jurisdiction
                                                                                                                  5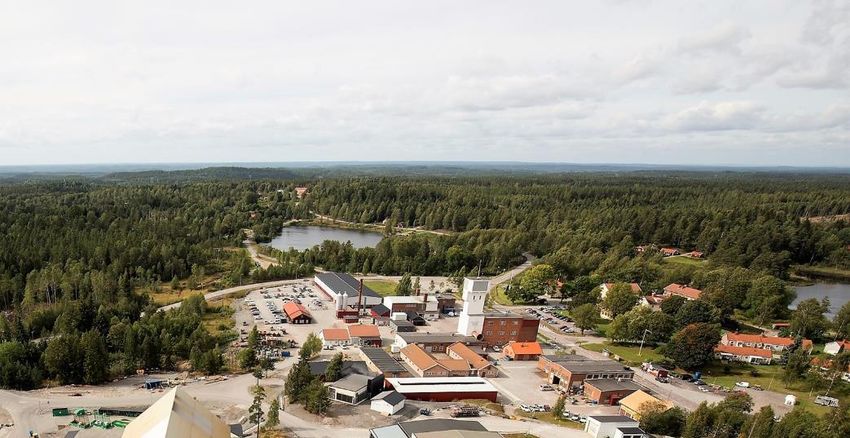
Increasing Production Profile1

                                     Copper                                                                                                          Zinc                                                                                                          Gold2

                                                                                       300 kt                                                                                                  225 kt
                                                                                                                                                        ~65%                                                                                                                                                   175 koz

                                                                                       275 kt                                                                                                  200 kt
                          ~30%

                                                                                                                                                                                                                                                                                                               150 koz
                                                                                       250 kt                                                                                                  175 kt
                                                                                                                                                                                                                                         ~110,000 oz of
                                                                                                                                                                                                                                         unencumbered
                                                                                                                                                                                                                                       production in 2021
                                                                                       225 kt                                                                                                  150 kt

                                                                                                                                                                                                                                                                                                               125 koz

                                                                                       200 kt                                                                                                  125 kt

                                                                                       175 kt                                                                                                  100 kt                                                                                                          100 koz
     2020A                 2021                 2022                 2023                                         2020A                2021               2022                2023                                                2020A               2021               2022               2023

1. Production profile based on certain estimates and assumptions, including but not limited to; Mineral Resource and Mineral Reserve estimates geological formations, grade and continuity of deposits and metallurgical characteristics. The 2021-2023 guidance was originally announced by news release on
   November 30, 2020 and as confirmed and updated for 2021 by news release April 28, 2021.
2. Currently, 68% of Candelaria’s total gold and silver production are subject to a streaming agreement. Chapada’ s gold production is unencumbered.
                                                                                                                                                                                                                                                                                                                 6
Candelaria
Ore Grades to Drive 2021 Production Increase
•   Q1/21 production of 34,203 t of copper and 21,000 oz of gold at a cash cost of $1.65/lb copper             Copper, Gold Production & Cash Costs1 Outlook
                                                                                                                 (100% basis; kt Cu, koz Au & $/lb Cu, net of by-product credits)
•   operation performed well in Q1/21 with tonnes milled, ore grades and metal recovery rates all
    in line with plan, demonstrating return to full production capacity
•   production forecast to increase over remainder of the year on improving feed grades
                                                                                                                                                                        180-190                   180-190
•   Q1/21 cash costs were better than plan and are forecast to improve significantly as metal                                                 172-182
    production increases
•   2021 guidance reiterated
•   long operational life of +20 years with clear exploration potential to further extend
                                                                                                                        127
•   internal feasibility-level studies evaluating expansion of Candeleria underground mines to                                                                                                                110-115
    26,000 tonnes per day advancing
                                                                                                                                                            95-100                    95-100

                                                                                                                                   76

                                                                                                                            $1.45
                                                                                                                                                     $1.35

                                                                                                                          2020A                      2021                      2022                     2023

                                                                                                                                                              Copper               Gold

                                                                                                               1. Currently, 68% of Candelaria’s total gold and silver production are subject to a streaming agreement and as such C1 cash
                                                                Crusher and mill maintenance – February 2021      costs guidance is based on receipt of $416/oz and $4.16/oz in 2021 on the streamed portion of gold and silver sales. The
                                                                                                                  2021-2023 guidance was originally announced by news release entitled "Lundin Mining Provides Operational Outlook &
                                                                                                                  Shareholder Returns Update" dated November 30, 2020.

                                                                                                                                                                                                                                     7
Chapada
Strong Mine & Mill Performance
•       Q1/21 production of 9,841 t of copper and 13,000 oz of gold at a cash cost of $1.33/lb copper               Copper, Gold Production & Cash Costs1 Outlook
                                                                                                                      (100% basis; kt Cu, koz Au & $/lb Cu, net of by-product credits)
•       operation performed well in Q1/21 with tonnes mined and tonnes milled in line with plan,
        demonstrating return to full production capacity
•       5.8 Mt processed is the second greatest quarterly throughput since acquisition
                                                                                                                                              87
•       metal production was impacted by the change in the mill feed blend with heavy rains
        necessitating more ore than first planned to be sourced from stockpile                                                                                       75-80
                                                                                                                                                                                               67-72                      65-70
•       Q1/21 aggregate and per tonne milled operating costs were better than plan, both on a BRL
        and USD basis. Cash costs and financial results impacted by lower sales volumes due to
                                                                                                                                                                                     53-58
        timing, partially offset by a favourable FX rate                                                                                                                                                        50-55
                                                                                                                                    50                    48-53
•       2021 guidance reiterated

Exploration & Expansion Studies Advancing Well
                                                                                                                                                                  $1.10
    •   10,800 m of drilling completed in Q1/21                                                                                        $0.29
        with 60,000 m budgeted for 2021
    •   $14M exploration budget in 2021
        includes drilling and exploration license                                                                                    2020A                       2021                      2022                       2023
        acquisitions
    •   expansion studies ongoing to optimize                                                                                                                         Copper               Gold
        life-of-mine value
    •   acquired 23 highly prospective near-mine                                                                     1.   Chapada cash costs are calculated on a by-product basis and do not include the effects of its copper stream agreements.
                                                                                                                          Effects of the copper stream agreements are reflected in copper revenue and will impact realized price per pound. The
        exploration claims through government                                                                             2021-2023 guidance was originally announced by news release entitled "Lundin Mining Provides Operational Outlook &

        auction in April                                                                                                  Shareholder Returns Update" dated November 30, 2020.
                                                       Reinforcing safety and COVID-19 guidelines and precautions
                                                              with employees and contractors during toolbox talks                                                                                                                         8
Chapada Near-Mine Exploration Drilling

                   6 km
                                                       NM_303: 24.8 m @ 0.65% Cu; 0.21 g/t Au (60 m)
                                                       Including: 8.0 m @ 0.74% Cu; 0.30 g/t Au (73 m)

                                                                                                                              Suruca
                                           3 km

                                                                             Baru NE

                                                                                         PLANT           SU_1085: 27.4 m @ 0.25% Cu; 0.19 g/t Au (35 m)
                                                                                                         Including: 9.6 m @ 0.32% Cu; 0.24 g/t Au (38 m)

                                                                                                         BRT_93: 17.7 m @ 0.26% Cu; 0.20 g/t Au (68 m)
NM_411: 36.8 m @ 0.38% Cu; 0.15 g/t Au (291 m)                                                           Including: 8.0 m @ 0.39% Cu; 0.33 g/t Au (69 m)
Including: 22.0 m @ 0.47% Cu; 0.17 g/t Au (303 m)
                                                                                                         BRT_92: 11.0 m @ 0.30% Cu; 0.22 g/t Au (73 m)
                                                                                                         Including: 4.4 m @ 0.41% Cu; 0.31 g/t Au (79 m)

                                                                                              Buriti
                                                                                                         BRT_67: 22.0 m @ 0.30% Cu; 0.14 g/t Au (50 m)
SC_40: 88.0 m @ 0.31% Cu; 0.12 g/t Au (139 m)
                                                                                                         Including 6.9 m @ 0.49% Cu; 0.22 g/t Au (57 m)
Including: 37.8 m @ 0.42% Cu; 0.18 g/t Au (170 m)

                                                                                                             June 2020 M&I Mineral Resource
                                                    SC_43: 94.0 m @ 0.30% Cu; 0.11 g/t Au (96 m)
                                                    Including 21.0 m @ 0.40% Cu; 0.14 g/t Au (149 m)         June 2020 Inferred Mineral Resource
            Santa Cruz
 1 Km                                                                                                        Exploration Areas

                                                                                                                                                           9
Chapada District Exploration
Mineral Rights                                                                      Formiga
23 New Exploration Licenses                                                         15 km north of Chapada Plant
29 Exisitng Exploration Licenses                                                          Mineralized
                                                                                     4
                                                                                          Zones                            FOR_61: 27.3 m @ 1.74% Cu; 0.21 g/t Au; 5.15 g/t Ag (116 m)
                                                                                                                           Including: 11.7 m @ 2.65% Cu; 0.38 g/t Au; 6.97 g/t Ag (116 m)
                                                                                                                           Including: 2.9 m @ 4.95% Cu; 0.40 g/t Au; 17.82 g/t Ag (140 m)

                                                                                         FOR_66: 19.9 m @ 1.53% Cu; 0.33 g/t Au (217m)
           80%                                                                           Including: 4.0 m @ 2.60% Cu; 0.48 g/t Au (217 m)
                                                                                         Including: 8.3 m @ 2.34% Cu; 0.53 g/t Au (229 m)

 Increase in land position                                                                                                                  open                     Semi Massive
                                                                                                                                                                     Sulfide

                                                                                                                                             Central
                                                                                             West
                                             Plant

                                                                                                                                            FOR_18: 20.2 m @ 0.45% Cu; 1.2 g/t Au (65 m)
                                                                                                                                            Including: 8.7 m @ 0.78% Cu; 2.5 g/t Au (67 m)
                                                                                          open

                                                     Chapada Main Pit
                                   Corpo Sul Pit                                                                      FOR_31: 20.4 m @ 0.76% Cu; 0.98 g/t Au (36 m)
                                                                                                                      Including: 11.0 m @ 0.94% Cu; 1.34 g/t Au (40 m)

                                                                                    Southwest
                                                                        10 km                                        FOR_95: 12.9 m @ 0.41% Cu; 0.17 g/t Au (20 m)
                                                                                                                     Including: 4.8 m @ 0.63% Cu; 0.27 g/t Au (23 m)
                                                                                            open

                 Mining                 Existing Exploration      New Exploration                                                                                     500 m
                 Concession                                       License                  Mineralized zone                High-grade trend (>0.5% CuEq)
                                        License
                                                                                                                                                                                    10
Neves-Corvo
Zinc Expansion Project (ZEP) Advancing On Track
• Q1/21 production of 7,441 t of copper, 14,710 t of zinc and 1,073 t of lead at a cash cost of
$2.61/lb copper Copper, Zinc Production & Cash Costs Outlook1
(kt & $/lb Cu, net of by-product credits)
• zinc production was impacted early in the quarter by plant maintenance and mine
resequencing to complete rehabilitation in Lombador areas
• mine development rates continued to improve in the quarter and focus remains on action 145-155
plans to further improve productivity
• aggregate and per tonne milled operating costs were directly in line with plan both on a 115-125
Euro and USD basis. Q1/21 cash cost was impacted by the production and sales volumes,
partially offset by above plan zinc by-product credits
• 2021 guidance reiterated
70-75
69
35-40 33-38
32 30-35
$2.09 $2.20
2020A 2021 2022 2023
Copper Zinc
1. The 2021-2023 guidance was originally announced by news release entitled "Lundin Mining Provides Operational
Outlook & Shareholder Returns Update" dated November 30, 2020.
New Atlas Copco M2C jumbo drill
11Neves-Corvo – ZEP
Underground Construction Progress Upcoming Works
• restarted materials handling construction and shaft • commence reticulation system construction and service water piping installation
upgrade engineering
• establish shaft shutdown pre-fabrication, pre-assembly, and structural and
• commenced splicing works on conveyors electrical works
• materials handling, reticulation system, service water piping • define shaft shutdown date
and shaft upgrade contracts awarded
• start dumping bay construction works
Underground construction photos – Q1/21
Crusher Chamber Transfer Tower 2 Conveyor Ramp Progress
12Neves-Corvo – ZEP
Surface Construction Progress Upcoming Works
• radial stacker commissioned • commence construction of ZEP paste fill expansion
• SAG mill commissioned with ore and first concentrate in mid-January • finish commissioning of 3rd tailings paste thickener
• SAG mill circuit improvements aligned with plant operations and • restart construction of second and third phases of flotation and
engineering initiated filtration works
Surface construction photos – Q1/21
Radial stacker New SAG Mill 3rd Thickener
13Zinkgruvan
Record Zinc Ore Milled
• Q1/21 production of 18,655 t of zinc, 478 t of copper and 4,709 t of lead at a cash cost of
$0.76/lb zinc Zinc Production & Cash Costs Outlook1
(kt & $/lb Zn, net of by-product credits)
• mine and mill continue to perform well in Q1/21. A new quarterly record set for zinc ore
processed at 334,000 t
• zinc feed grades to increase modestly over the course of this year
• Q1/21 aggregate and per tonne milled operating costs were in line with plan, both on a 76-81
SEK and USD basis
71-76
• 2021 guidance reiterated
74
68-73
Underground
Exploration Advancing
• over 6,300 m of exploration drilling $0.65
completed in Q1/21
• 2021 exploration expenditure $0.52
guidance of $6M with 27,000 m of
drilling planned
• focus is on the extension of Dalby and 2020A 2021 2022 2023
area between Burkland and Nygruvan
orebodies
1. The 2021-2023 guidance was originally announced by news release entitled "Lundin Mining Provides Operational
Zinkgruvan’s electrical energy entirely sourced from Outlook & Shareholder Returns Update" dated November 30, 2020.
renewable resources
14Eagle
Impressive Cash Costs & Cash Generation
• Q1/21 production of 5,354 t of nickel and 5,391 t of copper at a first-quartile cash cost Nickel, Copper Production & Cash Costs Outlook2
of negative $1.62/lb nickel (kt & $/lb Ni, net of by-product credits)
• another excellent quarter operationally. Both the mine and the mill performed slightly
above plan
• aggregate and per tonne milled operating costs were in line with plan. Cash costs 17-20 17-20 17-20
benefited from higher sales and by-product copper credits
19 15-18
• generated over $75M of operating cash flow in the quarter and incurred $3.5M of 17
capex
13-16
12-15
• 2021 nickel production guidance increased from 15,000-18,000 tonnes to 17,000–
20,000 tonnes on strong Q1/21 performance. Copper production reiterated
• 2021 cash cost guidance
improved from $0.50/lb to
negative $0.25/lb nickel on
first quarter performance $0.10
and revised copper price1
forecast
• first-quartile cash costs with ($0.25)
minimal capex anticipated to
continue through 2025 2020A 2021 2022 2023
Nickel Copper
1. 2021 copper price assumption revised to $3.75/lb, from 2. The 2021-2023 guidance was originally announced by news release entitled "Lundin Mining Provides Operational Outlook
$2.95/lb as announced by news release on April 28, 2021. & Shareholder Returns Update" dated November 30, 2020. 2021 nickel production and cash cost guidance is as most
recently updated and announced by news release on April 28, 2021.
Mill maintenance activities - March 2021
152021 Guidance Summary1
Production C1 Cash
(contained metal in conc.) Cost2 Capital Expenditures ($M)
Copper (t) Candelaria (100%) 172,000 - 182,000 $1.353 Sustaining
Chapada 48,000 - 53,000 $1.103 Candelaria (100% basis) 345
Eagle 17,000 - 20,000
Chapada 65
Neves-Corvo 35,000 - 40,000 $2.203
Eagle 20
Zinkgruvan 3,000 - 4,000
Total 275,000 - 299,000 Neves-Corvo 65
Zinkgruvan 50
Zinc (t) Neves-Corvo 70,000 - 75,000 Total Sustaining 545
3
Zinkgruvan 71,000 - 76,000 $0.65
Total 141,000 - 151,000 ZEP (Neves-Corvo) 70
Total Capital Expenditures1,2 $615M
Gold (oz) Candelaria (100%) 95,000 - 100,000
Chapada 75,000 - 80,000
Total 170,000 - 180,000
• $40M to be invested in 2021 exploration programs
Nickel (t) Eagle 17,000 - 20,000 $(0.25) • over 140,000 m of exploration drilling planned with
focus on in and near-mine targets
Total 17,000 - 20,000
1. Guidance as is as most recently updated and announced by news release on April 28, 2021.
2. Cash costs are based on various assumptions and estimates, including but not limited to production volumes, as noted above, commodity prices (Cu: $3.75/lb, Zn: $1.15/lb, Pb: $0.85/lb, and Au: $1,700/oz), foreign exchange rates (€/USD:1.20, USD/SEK:8.20,
CLP/USD:700 and USD/BRL:5.10) and operating costs for the remainder of 2021.
3. 68% of Candelaria's total gold and silver production are subject to a streaming agreement and silver production at Zinkgruvan and Neves-Corvo are also subject to streaming agreements. Cash costs are calculated based on receipt of approximately $416/oz
gold and $4.16/oz to $4.48/oz silver. Chapada cash costs are calculated on a by-product basis and do not include the effects of its copper stream agreements. Effects of the copper stream agreements are reflected in copper revenue and will impact realized
price per pound.
16Lundin Mining
High Quality Meaningful Scale
Financial Strength
Competitive Mines Growth Oriented
• demonstrated operational excellence and • increasing copper, zinc and gold production • proven track record for rigorous investment
culture of continuous improvement profiles approach, focused on value creation
• low-risk mining jurisdictions • exploration upside and high-value • strong balance sheet with low leverage
expansion projects underway
17www.lundinmining.com | TSX: LUN | Nasdaq Stockholm: LUMI
Appendices

             19
Responsible Mining
Tailings Management
• employ a comprehensive and integrated approach to tailings management. This provides confidence that potential environmental and social impacts can
be reliably identified and minimized
• our Responsible Mining Management System includes a specific Tailings Management Technical Standard. This standard requires that each operation
ensure tailings facilities and major water-retention dams are planned, designed, constructed, operated, decommissioned and closed in such a manner that
they are stable. It also ensures that all aspects comply with regulatory requirements, conform to Company standards and accepted international practices
and adhere to any commitments made to local stakeholders
• Lundin Mining is committed to the implementation of the Global Industry Standard on Tailings Management (GISTM), which is the first global
standard on tailings management. Lundin Mining plans for to be in full conformance with the GISTM within five years of August 5, 2020
A full list of tailings facilities that Lundin Mining manages, including information on tailings
Our Facilities management, construction method, maximum dam height and volume, can be found in
our Tailings Management Information Sheet in Our Approach to Tailings Management
• of the five Lundin Mining
operations, Eagle Mine is
the only operation that
does not have a
constructed tailings
impoundment with dams
• the five active tailings
facilities use various
construction techniques for
the main and secondary or
perimeter dams, but none
use upstream construction
• also maintains and
monitors six inactive/closed
tailings facilities
Cerro do Lobo Tailings Facility at Neves-Corvo in Portugal
20Responsible Mining
Climate Change, Energy and CHG Emissions
• recognize the need for effective approaches to managing climate-related responsibilities, especially in consideration of the remote locations in which we operate,
the energy-intensive nature of our industry, and the sometimes-limited availability of renewable energy in national energy supply
• in 2019, we scoped and developed a corporate climate change adaptation and mitigation planning toolkit that will enhance the resilience of our operations by
formalizing site-level, climate-related risk assessments for the development and prioritization of climate adaptation strategies
• Lundin Mining’s GHG emissions broadly correlate with our energy consumption trends. Our market-based Scope 2 emissions continue to benefit from
Zinkgruvan’s investment in a 100% renewable electricity supply since 2017 supported by a Guarantee of Origin. In the future, we will also realize the positive
effect of Candelaria’s contractual agreement with its supplier for an increase in renewables to a minimum of 80% in the energy mix, prioritizing wind and
solar energy, commencing in 2023
• reduction in energy intensity and GHG emissions intensity, per tonne rock mined, from 2016
to 2019. Chapada has the lowest intensity levels arising from the movement of significant
quantities of material over relatively short distances. Candelaria’s low energy intensity levels also
reflect the large tonnage of ore and waste rock excavated. Our remaining underground operations
do not benefit from such efficiencies of scale, especially those located in colder climates that
require additional energy for heating
Retain An Above Average ‘B’ CDP Score
• we report annually to the CDP Climate Change and Forestry programs,
aligned with the Task Force on Climate-related Financial Disclosures
• retained an above average ‘B’ score again in 2019, a significant
achievement within the context of a North America regional average
score of ‘D’ and a metallic mineral mining sector average score of ‘C’
21Responsible Mining
Water Stewardship
• continue to make water stewardship gains, achieving measurable reductions in fresh water use and increases in water re-use in 2019. Total fresh surface
water withdrawal decreased 7% in 2019 compared to 2018
• committed to improvements in water assessment and management practices, evaluating water-use efficiency, initiatives to prevent unnecessary pressure
on shared resources and measures to minimize environmental and social impacts
• all operations continuously seek to improve their site water balances and water management plans, implementing comprehensive water management
planning processes
• future efforts in water management will include an increased focus on the resilience of site water management infrastructure, and processes and
procedures concerning the potential for more frequent and extreme weather events in changing climatic environments
Candelaria’s operational water requirements met entirely
through supply from its sea water desalination facility
• the operation maintains a strong
focus on water use efficiency
• in 2019 overall water withdrawal
was reduced by 2.2 million m3
• use of treated municipal wastewater
ceased 2019, significantly earlier
than the 2027 regulatory
requirement, enabling these
resources to be redirected to other
uses in this water-scarce region
Candelaria desalination facility
www.lundinmining.com/responsible-mining
22Candelaria Complex – Mineral Resources and Mineral Reserves1
Ownership 80%
Location Region III, Chile
Mine life +20 years
2021 exploration budget $14M
P&P Copper Mineral Reserves 3,656 kt contained (684,445 kt at 0.57%)
M&I Copper Mineral Resources 7,574 kt contained (1,179,253 kt at 0.64%)
Inferred Copper Mineral Resources 540 kt contained (77,618 kt at 0.70%)
P&P Gold Mineral Reserves 2.8 Moz contained (684,445 kt at 0.13 g/t)
M&I Gold Mineral Resources 5.6 Moz contained (1,179,253 kt at 0.15 g/t)
Inferred Gold Mineral Resources 0.3 Moz contained (77,618 kt at 0.14 g/t)
P&P Silver Mineral Reserves 39 Moz contained (684,445 kt at 1.8 g/t)
M&I Silver Mineral Resources 77 Moz contained (1,179,253 kt at 2.0 g/t)
Inferred Silver Mineral Resources 3.8 Moz contained (77,618 kt at 1.6 g/t)
1. For more information please refer to the Company’s Technical Report for the Candelaria Copper
Mining Complex, November 28, 2018 and the Company’s news release dated September 8, 2020
entitled “Lundin Mining Announces 2020 Mineral Resource and Reserve Estimates” on the
Company’s website (www.lundinmining.com). See also slide 30.
Candelaria Copper Mining Complex 23Candelaria Copper Production Profile1 (kt)
190 190 192 194
184 182
175 171 175
167
156 160
152 151
146 146
135 136
127
114
96
84
69
45
10
4 4 4
2016A 2017A 2018A 2019A 2020A 2021 2022 2023 2024 2025 2026 2027 2028 2029 2030 2031 2032 2033 2034 2035 2036 2037 2038 2039 2040
December 2018 Technical Report December 2017 Technical Report At Purchase - October 2014 Techncial Report
Contained copper in the Mineral Reserve estimate2 has increased by approximately 130%3 and the production profile significantly improved since acquisition
1. Production shown on 100% basis and is based on the NI 43-101 Technical Reports dated November 28, 2018, November 30, 2017, and October 6, 2014 copies of which is are available on SEDAR under the Company’s profile page. See also slide 29.
2. Refer to news release “Lundin Mining Announces 2020 Mineral Resource and Reserve Estimates” dated September 8, 2020. See also slide 30.
3. Mine depletion included.
4. Bar graphs presents the upper bound of the copper production guidance range for 2021 through 2023 as most recently revised and announced by news release entitled "Lundin Mining Provides Operational Outlook & Shareholder Returns Update" dated November 30, 2020. Bar graph presents NI 43-101 Technical
Report dated November 28, 2018 copper production forecast for 2024 through end of operational life.
24Chapada – Mineral Resources and Mineral Reserves1
Ownership 100%
Location Goiás State, Brazil
Mine life +30 years
2021 exploration budget $8M
P&P Copper Mineral Reserves 1,759 kt contained (759,652 kt at 0.23%)
M&I Copper Mineral Resources 2,639 kt contained (1,132,198 kt at 0.23%)
Inferred Copper Mineral Resources 372kt contained (171,048 kt at 0.22%)
P&P Gold Mineral Reserves 4.6 Moz contained (824,847 kt at 0.18g/t)
M&I Gold Mineral Resources 7.8 Moz contained (1,279,716 kt at 0.19 g/t)
Inferred Gold Mineral Resources 0.6 Moz contained (183,613 kt at 0.10 g/t)
1. For more information please refer to the Company's Technical Report on the Chapada Mine,
Goiás State, Brazil dated October 10, 2019 and the Company’s news release dated September
8, 2020 entitled “Lundin Mining Announces 2020 Mineral Resource and Reserve Estimates” on
the Company’s website (www.lundinmining.com). Mineral Resources are based on the
summation of Chapada and Suruca gold only. See also slide 30.
Source: Google Earth
25Chapada Production Profile1
120
100
Metal Production
80
60
40
20
0 2 3 3 3
2019A
2020A
2021
2026
2027
2028
2033
2034
2035
2040
2041
2042
2047
2048
2049
2022
2023
2024
2025
2029
2030
2031
2032
2036
2037
2038
2039
2043
2044
2045
2046
2050
Copper (kt) Gold (koz)
1. Production shown is based on the NI 43-101 Technical Report dated October 10, 2019, available on the Company’s website and SEDAR under the Company’s profile page. See also slide 30.
2. 2019 production based on period of Lundin Mining’s ownership post closing of acquisition on July 5, 2019 (approximately half year).
3. Bar graphs presents the upper bound of the copper and gold production guidance ranges for 2021 through 2023. Copper and gold production guidance and outlook for 2021 through 2023 was announced by news release entitled "Lundin Mining Provides Operational Outlook & Shareholder Returns Update"
dated November 30, 2020. Bar graph presents NI 43-101 Technical Report, dated October 10, 2019, copper and gold production forecast for 2024 through end of operational life.
26Eagle Mine – Mineral Resources and Mineral Reserves1
Ownership 100%
Location Michigan, USA
Mine life 5 years
P&P Nickel Mineral Reserves 100 kt contained (3,909 kt at 2.6%)
M&I Nickel Mineral Resources 113 kt contained (3,807 kt at 3.0%)
P&P Copper Mineral Reserves 84 kt contained (3,909 kt at 2.1%)
M&I Copper Mineral Resources 95 kt contained (3,807 kt at 2.5%)
Inferred Nickel Mineral Resources - kt contained (21 kt at 0.9%)
Inferred Copper Mineral Resources - kt contained (21 kt at 1.0%)
1. For more information please refer to the Company’s Technical Report on the Eagle Mine dated
April 26, 2017 and the Company’s news release dated September 8, 2020 entitled “Lundin Mining
Announces 2020 Mineral Resource and Reserve Estimates” on the Company’s website
(www.lundinmining.com). See also slide 30.
Eagle Mine
27Neves-Corvo – Mineral Resources and Mineral Reserves1
Ownership 100%
Location Alentejo region, Portugal
Mine life +10 years
2021 exploration budget $4M
P&P Zinc Mineral Reserves 2,200 kt contained (30,114 kt at 7.3%)
M&I Zinc Mineral Resources 4,938 kt contained (71,253 kt at 6.9%)
Inferred Zinc Mineral Resources 214 kt contained (3,677 kt at 5.8%)
P&P Copper Mineral Reserves 596 kt contained (29,693 kt at 2.0%)
M&I Copper Mineral Resources 1,424 kt contained (61,948 kt at 2.3%)
Inferred Copper Mineral Resources 227 kt contained (12,640 kt at 1.8%)
Inferred Semblana Copper Mineral Resources 223 kt contained (7,807 kt at 2.9%)
1. For more information refer to the NI 43-101 Technical Report for the Neves-Corvo Mine,
Portugal dated June 23, 2017 and the Company’s news release dated September 8, 2020 entitled
Schematic of Neves-Corvo Mine highlighting ZEP development and mining areas “Lundin Mining Announces 2020 Mineral Resource and Mineral Reserve Estimates” on the
Company’s website (www.lundinmining.com). See also slide 30.
28Zinkgruvan – Mineral Resources and Mineral Reserves1
Ownership 100%
Location Askersund, Sweden
Mine life +10 years
2021 exploration budget $6M
P&P Zinc Mineral Reserves 690 kt contained (8,786 kt at 7.9%)
M&I Zinc Mineral Resources 1,955 kt contained (22,596 kt at 8.6%)
Inferred Zinc Mineral Resources 1,439 kt contained (18,981 kt at 7.6%)
P&P Copper Mineral Reserves 58 kt contained (3,099 kt at 1.9%)
M&I Copper Mineral Resources 92 kt contained (4,095 kt at 2.2%)
Inferred Copper Mineral Resources 5 kt contained (241 kt at 2.0%)
1. For more information please refer to the Company’s Technical Report entitled NI 43-
101 Technical Report for the Zinkgruvan Mine, Central Sweden dated November 30,
2017 and the Company’s news release dated September 8, 2020 entitled “Lundin
Mining Announces 2020 Mineral Resource and Reserve Estimates” on the Company’s
website (www.lundinmining.com). See also slide 30.
Zinkgruvan Mine
29NI 43-101 Compliance
Unless otherwise indicated, Lundin Mining Corporation (the “Company”) has prepared the technical information in this presentation including Mineral Reserve and Mineral Resource estimates (“Technical
Information”) based on information contained in the technical reports and news releases (collectively the “Disclosure Documents”) available under the Company’s profile on SEDAR at www.sedar.com. Each
Disclosure Document was prepared by or under the supervision of a qualified person (“Qualified Person”) as defined in National Instrument 43-101 – Standards of Disclosure for Mineral Projects of the Canadian
Securities Administrators (“NI 43-101”). For readers to fully understand the information in this presentation, they should read the technical reports identified below in their entirety, including all qualifications,
assumptions and exclusions that relate to the information set out in this presentation which qualifies the Technical Information. Readers are advised that Mineral Resource estimates that are not Mineral Reserves
do not have demonstrated economic viability. The Disclosure Documents are each intended to be read as a whole, and sections should not be read or relied upon out of context. The Technical Information is subject
to the assumptions and qualifications contained in the Disclosure Documents.
The Technical Information in this presentation has been prepared in accordance NI 43-101 and has been reviewed and approved by Stephen Gatley, BSc (Eng), CENG MIMMM, Vice President - Technical Services of
the Company, a "Qualified Person" under NI 43-101. Mr. Gatley has verified the data disclosed in this presentation and no limitations were imposed on his verification process.
Mineral Resource and Mineral Reserve estimates of the Company are shown on a 100 percent basis for each mine. The Measured and Indicated Mineral Resource estimates are inclusive of those Mineral Resource
estimates modified to produce the Mineral Reserve estimates. All estimates of the Company are prepared as at June 30, 2020. Estimates for all operations are prepared by or under the supervision of a Qualified
Person as defined in NI 43-101 or have been audited by independent Qualified Persons on behalf of the Company.
Mineral Reserves for all active mines have been estimated using metal prices of US$3.00/lb copper, US$1.00/lb zinc, US$0.95/lb lead, US$6.50/lb nickel and US$1,300/oz gold. Exchange rates used were EUR/USD
1.25, USD/SEK 7.00, USD/CLP 600 and USD/BRL 4.00. For the Suruca gold deposit Mineral Reserve, the metal prices used were US$3.00/lb copper and US$1,250/oz gold and an exchange rate of USD/BRL 3.95.
Candelaria and La Española open pit Mineral Resource estimates are reported within a conceptual pit shell based on metal prices of US$3.45/lb copper and US$1,300/oz gold with cut-off grades of 0.15% and 0.17%
copper, respectively. Candelaria underground Mineral Resources are estimated at a cut-off grade of 0.45% copper within confining grades shells of 0.4% copper. Mineral Reserves for the Candelaria open pit,
Española open pit and underground for the Candelaria property are estimated at cut-off grades of 0.16%, 0.19% and 0.50% copper, respectively. Underground Mineral Reserves for the Ojos del Salado property,
Santos and Alcaparrosa mines, are estimated at cut-off grades of 0.55% copper and 0.60% copper respectively. Chapada and Suruca SW copper-gold Mineral Resource estimates are reported within a conceptual pit
shell based on metal prices of US$3.45/lb copper and US$1,495/oz gold and at a variable Net Smelter Return (NSR) marginal cut-off averaging US$4.08 per tonne. For the Suruca gold only Mineral Resource estimates,
cut-off grades of 0.16g/t gold for oxides and 0.23g/t for sulphides were used. Mineral Reserves for the Chapada open pit are estimated at a NSR cut-off of US$4.73 per tonne. For the Suruca gold only Mineral Reserve
estimates cutoff grades of 0.19g/t gold for oxides and 0.30g/t for sulphides are used. Eagle Mineral Resources and Reserves are reported above a fixed NSR cut-off of US$108/t. The Eagle East Mineral Resources are
reported above a fixed NSR cut-off of US$142/t and the Mineral Reserves are reported above US$142/t for long-hole stopes and US$150/t for cut-and-fill stopes. The NSR is calculated on a recovered payable basis
considering nickel, copper, cobalt, gold and PGM grades, metallurgical recoveries, prices and realization costs. The Neves-Corvo Mineral Resources are estimated above cut-off grades of 1.0% for copper and 4.5% for
zinc. The Neves-Corvo copper and zinc Mineral Reserve estimates have been calculated using variable NSR values based on area and mining method. The NSR is calculated on a recovered payable basis considering
copper, lead, zinc and silver grades, metallurgical recoveries, prices and realization costs. The Neves-Corvo copper Mineral Reserves are estimated above a site average cut‐off of EUR 42.0/t (grade equivalent to
1.34% copper). For Neves-Corvo zinc Mineral Reserve estimates a site average cut‐off of EUR 46.6/t (grade equivalent to 5.34% zinc) is used. The Mineral Resources at Semblana are estimated above a cut-off grade of
1.0% copper. The Zinkgruvan zinc Mineral Resources are estimates within geological volumes based at a nominal NSR cut-off of SEK 350/t (equivalent to 4.5% zinc) and a minimum mining width of 5 m. The
Zinkgruvan copper Mineral Resource is estimated above a cut-off grade of 1.0% Cu. The Zinkgruvan zinc and copper Mineral Reserves are estimated above a site average NSR cutoff grade of SEK 500/t (equivalent to
6.1% zinc and 1.4% copper respectively). The NSR is calculated on a recovered payable basis considering copper, lead, zinc and silver grades, metallurgical recoveries, prices and realization costs. Refer to the
Company’s news release dated September 8, 2020 entitled “Lundin Mining Announces 2020 Mineral Resource and Reserve Estimates” on the Company’s website at www.lundinmining.com.
For further Technical Information on the Company’s material properties, refer to the following technical reports, each of which is available on the Company’s SEDAR profile at www.sedar.com:
Candelaria: technical report entitled Technical Report for the Candelaria Copper Mining Complex, Atacama Region, Region III, Chile dated November 28, 2018.
Chapada: technical report entitled Technical Report on the Chapada Mine, Goiás State, Brazil dated October 10, 2019
Neves-Corvo: technical report entitled NI 43-101 Technical Report for the Neves-Corvo Mine, Portugal dated June 23, 2017.
Zinkgruvan: technical report entitled NI 43-101 Technical Report for the Zinkgruvan Mine, Central Sweden dated November 30, 2017.
Eagle Mine: technical report entitled Technical Report on the Eagle Mine, Michigan, U.S.A. dated April 26, 2017.
30www.lundinmining.com | TSX: LUN | Nasdaq Stockholm: LUMI
You can also read