CLOSING THE MEDICAL OXYGEN GAP IN SUB-SAHARAN AFRICA - A case for a decentralized hub-spoke network of pressure swing adsorption plants ...
←
→
Page content transcription
If your browser does not render page correctly, please read the page content below
INSTITUTE FOR
                                            TRANSFORMATIVE
                                            TECHNOLOGIES

CLOSING THE MEDICAL OXYGEN
GAP IN SUB-SAHARAN AFRICA
 A case for a decentralized hub-spoke network of
        pressure swing adsorption plants

                  JANUARY 2021
© 2021. Institute for Transformative Technologies (ITT) and Oxygen Hub. All rights reserved.

This report was made possible through generous support from the Skoll Foundation and
ELMA Philanthropies. We'd like to acknowledge valuable contributions from Nicholas
Sukitsch, Nikki Tyler, and Helen Petach. We are also grateful for technical feedback from the
Clinton Health Access Initiative. Any remaining errors are the responsibility of the authors.

Rights and Permissions
This work may be reproduced, in whole or in part, without permission, with attribution.

Attribution
Please cite this work as follows: “Closing the medical oxygen gap in sub-Saharan Africa: A
case for a decentralized hub-spoke network of pressure swing adsorption plants,"
Institute for Transformative Technologies (ITT) and Oxygen Hub, January 2021.

For more information: info@transformativetechnologies.org
www.transformativetechnologies.org | www.oxygenhub.org
INSTITUTE FOR
                                                                                                                              TRANSFORMATIVE
                                                                                                                              TECHNOLOGIES

SUMMARY                                                                 It has also sparked a vibrant debate about
                                                                        optimal mechanisms to increase oxygen
Sub-Saharan Africa (SSA) has                                            supply in SSA—especially about the
historically suffered from an acute                                     relative merits and disadvantages of PSA
shortage of medical oxygen. Most                                        vs. LOX as potential solutions at a large
countries in SSA have less than 10% of                                  scale.
the volume needed to treat high-burden
conditions like pneumonia, chronic                                      A key finding of our analysis is
obstructive pulmonary disease (COPD),                                   that—contrary to conventional belief—the
and neonatal respiratory syndrome.                                      per-unit cost of oxygen3 in SSA is similar
COVID-19 has both exacerbated and                                       across the various methods of production.
highlighted this oxygen supply gap.                                     This is because the cost of producing
                                                                        oxygen is only a small portion of the total
Historically, the most common method of                                 cost of delivering oxygen to patients, and
supply in SSA has been in the form of                                   post-production operations (e.g., cylinder
cylinders filled with oxygen gas from                                   filling, distribution) are virtually the same.
cryogenic distillation plants that produce                              Furthermore, many of the LOX facilities in
liquid oxygen1 (LOX). Most of these                                     SSA are relatively small, and hence do not
factories were built decades back to serve                              benefit from the economies of scale typical
industrial applications—particularly                                    of LOX factories around the world.
extractives. To date, they continue to
focus heavily on those applications and                                 A second observation is that many SSA
have served only a fraction of the existing                             countries currently rely on a nontrivial
need for medical applications.                                          amount of imported oxygen, suggesting
                                                                        that domestic LOX production capacity
More recently, smaller pressure swing                                   enjoys high levels of utilization.
adsorption (PSA)2 plants have emerged as
an alternative to cryogenic plants.                                     Third, the majority of people in SSA live in
However, these systems have often not                                   rural areas, and most patients have access
been adequately maintained, and a                                       only to primary clinics even for conditions
sizable portion of them are not currently                               that need oxygen treatment.
operational. Unsurprisingly, the existing
medical oxygen capacity in SSA has been                                 Finally, adding new LOX production
insufficient to meet the surge needed for                               capacity in SSA explicitly for medical use
COVID-19.                                                               will likely be cost prohibitive.

COVID has increased awareness about the
importance of oxygen and has generated

                                                                   “
strong interest from governments,
funders, and other influential
stakeholders to significantly and
sustainably increase access,
                                                                                 The per-unit cost of oxygen in
including to rural areas.                                                             SSA is similar across the
                                                                                various methods of production.

1
  Cryogenic air separation plants also produce a number of other industrial gases.
2
  More recently, a variation of the PSA process known as vacuum swing adsorption (VSA) has also emerged as a high-potential

3
  option. For the purposes of this discussion, we use “PSA” to refer to both PSA and VSA.
  Per-cylinder cost for oxygen suppliers. Note that market price to buyers of oxygen may not reflect the cost.                      01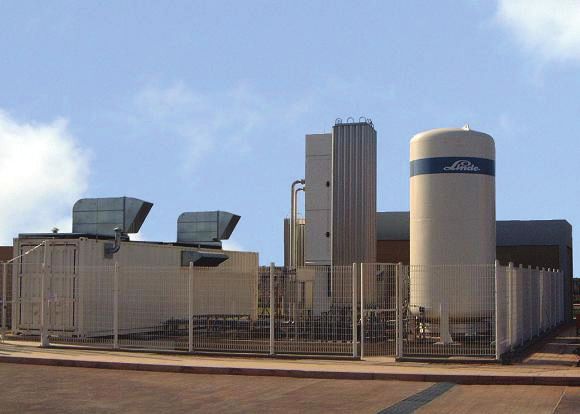
INSTITUTE FOR
                                                                                                 TRANSFORMATIVE
                                                                                                 TECHNOLOGIES

For individual (or a small number of)           There is likely enough surplus LOX capacity
tertiary hospitals especially in                across the global production system to
urban/peri-urban areas, the optimal choice      meaningfully increase the supply of
is onsite LOX tanks, vaporized on demand        medical oxygen to SSA. However, LOX is a
and delivered to patients via piped systems     capital-intensive commodity, and a basic
(the norm in high-income countries). These      economic tendency of capital-intensive
hospitals can serve as “anchor users” and       production industries is to maximize the
be used as hubs for distributing oxygen         utilization of available capacity. As such, it
cylinders to local primary/secondary            is unlikely there is enough surplus LOX to
clinics.                                        solve the problem at the needed
                                                scale—unless new capacity is developed.
Such a solution may be appropriate for
rural tertiary hospitals as well, but only if   At the same time, the operational
the transportation infrastructure allows        complexity of PSA plants with cylinder
easy and regular access for large LOX           filling stations is only incrementally more
trucks. Otherwise, onsite PSA systems may       than that of LOX bulk storage sites with the
be more appropriate.                            same type of filling stations. We believe
                                                this incremental operational complexity
However, to reach a meaningfully large          offsets the logistical complexity of
population, including in rural areas, an        managing a large number of regular
extensive decentralized oxygen                  deliveries by LOX tanks. Importantly, PSA
infrastructure will be needed. The two          plants will ensure much greater local
choices for such a decentralized                control over a critical lifesaving
infrastructure are networks of (a) PSA          commodity.
plants that produce oxygen and fill
cylinders and (b) LOX bulk storage sites        On the margin, therefore, we believe that a
with cylinder filling stations, regularly       decentralized network consisting largely of
replenished via trucks from a central           PSA plants—incorporating LOX stations
production facility.                            based on how much supply can be
                                                guaranteed—offers the most promising
Since the per-unit costs of PSA and LOX         option for a sustainable, self-reliant,
are similar, the choice between PSA and         large-scale solution to SSA’s medical
LOX in developing a large decentralized         oxygen deficit.
infrastructure should be based on the
tradeoff between:
•   for LOX: (i) reliable availability of
    large volumes of LOX, often via
    imports; and (ii) reliability of the
    logistics of regular LOX deliveries
    via insulated cryotank trucks across
    a decentralized system.

•   for PSA: the ability to reliably
    operate and manage the plants.

                                                                                                       02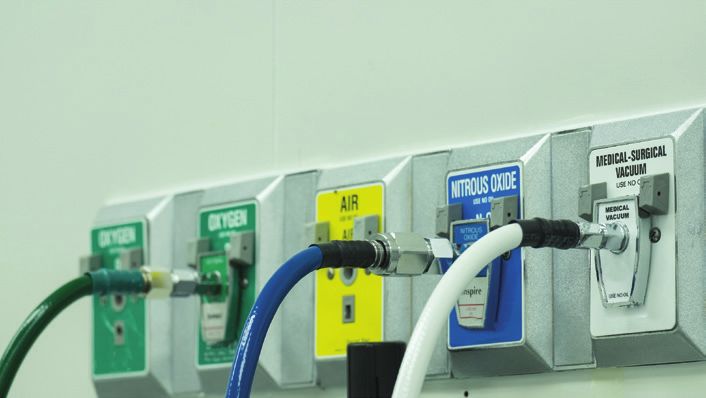
INSTITUTE FOR
                                                                                                                                  TRANSFORMATIVE
                                                                                                                                  TECHNOLOGIES

1. MEDICAL OXYGEN                                                       A LOX factory can last for decades and is
                                                                        typically amortized over a period of 30
PRODUCTION AND                                                          years. The first cryogenic air separation
                                                                        plant for oxygen production was developed
DELIVERY: A BRIEF                                                       by Carl von Linde in Germany in the first
PRIMER                                                                  decade of the 1900s.

                                                                        The technology has now scaled up globally
Dry atmospheric air contains, by volume,
                                                                        and there are thousands of cryogenic
78.09% nitrogen, 20.95% oxygen, 0.93%
                                                                        oxygen plants around the world. There are
argon, 0.04% carbon dioxide, and small
                                                                        a small number of companies that
amounts of other gases. Air also contains
                                                                        own/operate LOX factories, of which
a variable amount of water vapor, on
                                                                        BOC/Linde and Air Liquide are the most
average around 1% at sea level. Medical
                                                                        well known. Both operate plants across
grade oxygen requires
                                                                        SSA.
concentration/purity of at least 82%.4
                                                                        Pressure swing adsorption (PSA) and the
Increasing the concentration of oxygen
                                                                        closely related vacuum swing adsorption
from 21% in the air to above 82% requires
                                                                        (VSA) use an adsorbent material (typically
a process for separating it from the
                                                                        zeolite) that adsorbs oxygen and nitrogen
various other constituent gases. The two
                                                                        at different rates as the pressure changes.
most widely used methods for doing this
                                                                        As pressure increases, relatively more
are cryogenic distillation and pressure
                                                                        nitrogen than oxygen adsorbs onto the
swing adsorption.5
                                                                        zeolite, thus producing an oxygen-rich gas
                                                                        stream from the adsorption bed (Exhibit 2).
Cryogenic air separation (also known as
cryogenic distillation) works by cooling air
                                                                        When the zeolite surface is saturated with
to about –112°C until it is liquified, at
                                                                        nitrogen, the pressure is reduced and the
which point the oxygen can be separated
                                                                        nitrogen is desorbed and released from
from the other components by fractional
                                                                        the zeolite and is purged to the
distillation, because of the different boiling
                                                                        atmosphere. PSA and VSA processes
points of the gases (Exhibit 1). The air is
                                                                        produce 90–95% purity oxygen, also well
purified prior to cooling to remove water
                                                                        above what is needed for medical
vapor. Cryogenic separation produces
                                                                        treatment. PSA/VSA oxygen is used
ultra-pure (>99.5%) liquid oxygen (LOX)
                                                                        primarily for medical purposes.
needed for specific industrial processes in
extractives, metallurgy, etc.
                                                                        A typical PSA facility costs
                                                                        $150,000–250,000 for a plant that
These facilities are highly capital intensive,
                                                                        produces 150,000–500,000 m3 of oxygen
costing tens of millions of [US] dollars.
                                                                        per year (20,000–75,000 cylinders per
Existing facilities vary significantly in
                                                                        year), with a service life of about ten years.
capacity, producing 5 million to 500 million
                                                                        VSA plants are typically larger by an order
m3 of oxygen (the equivalent of 750,000 to
                                                                        of magnitude, with a longer service life.
75 million cylinders) per year.
                                                                        PSA systems for oxygen production were
                                                                        first used in the 1970s, and the first VSA
                                                                        oxygen systems were commercialized in
                                                                        the 1990s.

    Source: “WHO-UNICEF Technical Specifications and Guidance for Oxygen Therapy Devices,” World Health Organization, 2019.
                                                                                                                                         03
4

5
    Other methods—such as membrane gas separation and oxygen generation from chemical feedstock—exist, but are not widely used.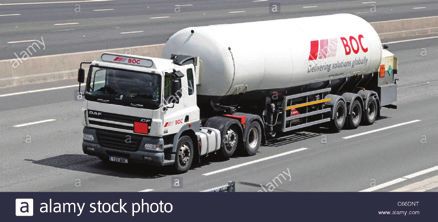
INSTITUTE FOR
                                                                                                                               TRANSFORMATIVE
                                                                                                                               TECHNOLOGIES

                                           Cryogenic liquid oxygen plant

                                                                    Waste

                                                                         Main heat
                                                                         exchanger    Expansion
                                                                                      brake
                                                                                      turbine                       Liquid
                                                                                                                    oxygen
   Air                                                                                                               tank
compressor

                   Air purification unit

                    Air
                  receiver

                              Chiller

                                                                            Column

                                                                             Boiler

              Air preparation                                            Coldbox                              Oxygen storage

  4
   Source: “WHO-UNICEF Technical Specifications and Guidance for Oxygen Therapy Devices,” World Health Organization, 2019.
  5
    Other methods—such as membrane gas separation and oxygen generation from chemical feedstock—exist, but are not widely
  used.

  Exhibit 1: Cryogenic air separation begins by compressing and purifying ambient air,
  followed by liquification and fractional distillation to separate oxygen from other
  components. The resulting liquid oxygen (LOX) is >99.5% pure, well above what is
  needed for medical treatment. The photograph shows a typical LOX plant.

                                                                                                                                      04
INSTITUTE FOR
                                                                                                        TRANSFORMATIVE
                                                                                                        TECHNOLOGIES

                         Pressure swing adsorption oxygen plant
      Air

                                                                                           Oxygen
                                                                                           receiver

                                                              Waste gas
                                                   Silencer
        Air compressor        Adsorption                                  Adsorption
                                    bed                                   bed

     Refrigerated
         dryer

   Air preparation                         Pressure swing adsorption                   Oxygen storage

Exhibit 2: PSA systems typically have two adsorption beds, which alternate between
adsorbing nitrogen from air while allowing oxygen to flow through, and venting the
accumulated nitrogen into the atmosphere. VSA uses the same general principle but
operates at lower (vacuum) pressures. The photograph shows a typical PSA facility
filling cylinders. (Courtesy: Hewatele, Kenya)

                                                                                                               05
INSTITUTE FOR
TRANSFORMATIVE
TECHNOLOGIES
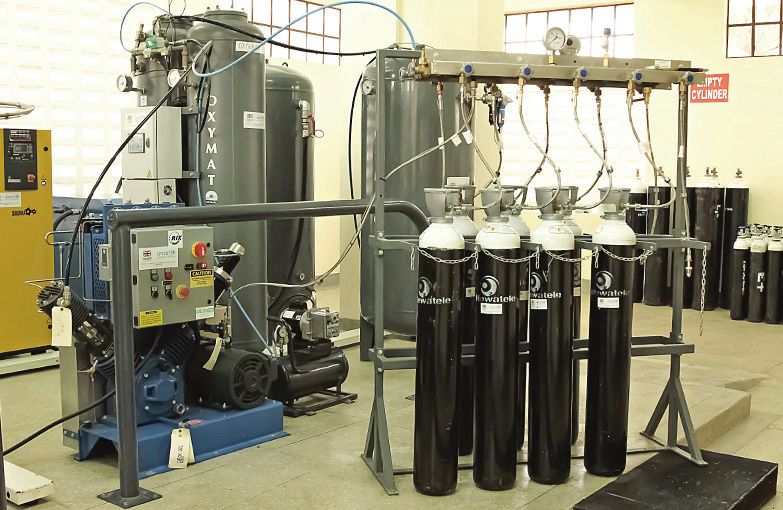
Medical oxygen is typically provided to • Oxygen Concentrators: Small oxygen
patients through one of three methods, concentrators are intended for one (or
depending on patient condition and the type a small number of) patients at a time.
of healthcare facility. The three modes of Concentrators are based on the PSA
supply are: process at a very small scale. They
separate oxygen from ambient air and
• Cylinders: Refillable cylinders that are
therefore can ensure a reliable,
filled with high pressure oxygen and
ongoing—albeit small—source of
transported to treatment sites are the
oxygen. They can also be used in a
easiest to use in smaller or poorly
variety of settings ranging from tertiary
equipped facilities and in homes.
hospitals to primary clinics and homes.
However, they need to be regularly
However, they require reliable
cleaned, inspected, and refilled for each
electrical power and need regular
use. Also, distribution to treatment sites
maintenance, without which they can
can be logistically challenging.
stop functioning within one year.
Cylinders are by far the most widely
deployed delivery mechanism for Oxygen can be delivered into the patient’s
medical oxygen in SSA and can be filled lungs via several types of breathing
with vaporized LOX or oxygen from interfaces based on patient condition and
PSA/VSA plants. While they come in sophistication of the clinical facility. The
different sizes, a standard “J” cylinder simplest and most common is a nasal
contains 6.8 m3 of oxygen, the unit size cannula—which delivers a limited oxygen
used in our analysis. flow close to the patient’s nostrils—and
facemasks. For severe conditions,
• Piped Systems: Piped systems in including advanced COVID-19, oxygen can
tertiary hospitals connect to large LOX be delivered to the lungs via endotracheal
storage tanks or on-site PSA plants, tubes.
delivering oxygen to the bedside. Piped
systems are the simplest mechanism
for hospitals with large numbers of
beds. However, installing them requires
capital investment. As a result, very few
hospitals in SSA have oxygen piping
infrastructure.
06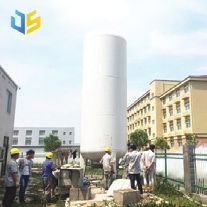
INSTITUTE FOR
                                                                                                                                     TRANSFORMATIVE
                                                                                                                                     TECHNOLOGIES

2. THE CONTEXT FOR                                                         In SSA, these conditions collectively
                                                                           account for an estimated 1.75 million
MEDICAL OXYGEN IN                                                          deaths6 each year (Exhibit 3). Surgery and
                                                                           emergency use of oxygen, not included in
SUB-SAHARAN AFRICA                                                         Exhibit 3, are also large drivers of demand.
                                                                           Table 1 shows the estimated amount of
Oxygen is critical for treating a number of                                oxygen needed to treat a typical patient
life-threatening conditions such as                                        suffering from these and other conditions.
pneumonia, asthma, chronic obstructive
pulmonary disease (COPD), neonatal
respiratory syndrome, and pulmonary
hypertension.

                    Annual deaths across sub-Saharan Africa from various
                               respiratory-related conditions

                                                                                                   460,000

                                                                             700,000
                                                                                                                         1,750,000

                                                      270,000
                                 45,000
          275,000

       Neonatal                Asthma              Pulmonary              Pneumonia                 COPD                Total
      Respiratory                                 Hypertension                                                     (Without COVID)
       Syndrome

    Exhibit 3: Oxygen is critical for treating a number of life-threatening conditions that
    collectively account for 1.75 million deaths in SSA annually. Beyond these conditions,
    surgery, emergency use, etc. drive additional demand. Note that oxygen may not, by
    itself, prevent fatality without complementary interventions.

6
  Sources: (1) B. Dadonaite, OurWorldInData.org, 2018. (2) R. Ahmed et al., “The epidemiology of noncommunicable respiratory
disease in SSA, the Middle East, and North Africa,” Forum of International Respiratory Societies, 2017. (3) Forum of International
Respiratory Societies, “The Global Impact of Respiratory Disease,” European Respiratory Society, 2017. (4) J.B. Griffin et al.,
“Evaluating WHO-Recommended Interventions for Preterm Birth: A Mathematical Model of the Potential Reduction of Preterm
Mortality in Sub-Saharan Africa,” World Health Organization, 2019.
                                                                                                                                            07
INSTITUTE FOR
TRANSFORMATIVE
TECHNOLOGIES
Total O2 required Cylinders per patient7
Condition Avg treatment time
COPD (adult) 7 days 40, 320 liters 5.9
Pulmonary oedema 5 days 21, 600 liters 3.2
Pneumonia (adult; severe) 2 days 11, 520 liters 1.7
Pulmonary hypertension 2 days 11, 520 liters 1.7
Pneumonia (infant; severe) 2 days 5, 760 liters 0.8
Asthma (adult) 1 day 7,200 liters 1.1
Neonatal respiratory syndrome 1 day 720 liters 0.1
Table 1: Amount of oxygen needed for various high-mortality conditions.
7
Assuming standard 6.8 m3 cylinders. 08INSTITUTE FOR
TRANSFORMATIVE
TECHNOLOGIES
The incidence of each of these conditions As Exhibit 4 shows, average per capita
varies by country, depending on consumption of medical oxygen in the US
demographics, underlying risk factors, and and EU is more than ten times that of SSA
access to preventative measures. (1.35 m3 vs. less than 0.1 m3 per year)8.
In order to treat these conditions, wealthier Oxygen is also one of the most effective
countries have access to abundant medical treatments for COVID-19. As the global
oxygen affordable to the majority of their medical community has wrestled with the
patients. On the other hand, lower-income learning curve of dealing with COVID, the
countries suffer severe shortages and exact amount of oxygen needed per patient
often have to ration oxygen to patients who has been unclear, but the aggregate need
either need it the most, or—more appears to be stretching the supply of even
often—who can afford it. wealthy countries like the US.9 In SSA, it
has exposed the dire urgency of the gap.10
Average per capita medical oxygen consumption (cubic meters per year)
>10x
1.35
0.1
US/EU SSA
Exhibit 4: Even before COVID-19, SSA has had an acute shortage of oxygen. COVID
has exacerbated the situation.
8
Sources: (1) Gómez-Chaparro et al., “Analytical Determination of Medical Gases Consumption and Their Impact on Hospital
Sustainability,” Sustainability, August 2018. (2) J. Raquet, “Covid-19 versus oxygen supply—the status on supply and demand,”
Gasworld, April 2020. (3) Ministry of Health, Uganda. (4) Ministry of Health, Ethiopia. (5) Expert interviews.
9
Source: R.-G. Lin et al., “Oxygen supply shortages bedevil hospitals already overwhelmed by COVID-19 patients,” LA Times,
December 2020.
Source: E. Onyeji, “How the scramble to save Femi Odekunle’s life yielded over 170 oxygen cylinders,” Premium Times, January
09
10
2021.INSTITUTE FOR
TRANSFORMATIVE
TECHNOLOGIES
As COVID has brought this gap into focus, In Kenya, about 70% of current medical
it has prompted a debate about the oxygen supply is from about 70 PSA plants
optimal means of achieving significant across the country. Recent surveys
increases in the supply of medical suggest that about half of them are not
oxygen—specifically about the relative functional. The majority of PSA plants in
merits and challenges of LOX and PSA Kenya are public, operated by the
with respect to cost and operational/ government. The other 30% is LOX, most of
logistical considerations. which is produced by the country’s single
cryogenic air separation plant (Exhibit 5). A
This article attempts such an analysis, small amount of LOX is imported.11
using cost drivers from Kenya as an
illustrative example. Note that we use
Kenya as the example because it is among
the more mature markets in SSA, and
because of our experience there. We
recognize that not all of the analysis can
be extrapolated to the rest of SSA.
Total supply of medical oxygen in Kenya
PSA: LOX:
• One plant dedicatingINSTITUTE FOR
TRANSFORMATIVE
TECHNOLOGIES
3. COST ANALYSIS: However, many liquid oxygen plants in SSA
are at the smaller end of the scale, with
LIQUID OXYGEN relatively high per-unit capital cost.12 For
example, the BOC and Air Liquide factories
Across SSA there are over 50 cryogenic in Kenya and Nigeria—and Tanzania’s
air separation plants producing LOX. Most factory operated by TOL—all produce less
of the capacity of these plants is dedicated than 50,000 m3 per day.
to industrial applications such as mining,
petroleum, metallurgy, and chemical Note that while these factories are less
industries. efficient than the optimal size, they are not
necessarily bad business investments.
Given their capital cost, it is unlikely LOX Presumably, these companies made the
plants will be constructed in SSA for optimal investment choice based on
medical needs alone. LOX plants are projected market demand. The limited
typically large, as the process has local production capacity means that
significant economies of scale beyond a industrial customers often import LOX
certain size (Exhibit 6). Plants with a when demand exceeds local supply.
production capacity greater than Indeed, as Exhibit 7 shows, many countries
300,000 m3 per day are capable of with local LOX facilities still rely on
producing global lowest-cost oxygen. imports.13
Liquid oxygen: Capital investment vs. capacity
BOC Kenya
TOL Tanzania (23,000 m3/day)
(13,000 m3/day)
BOC Port Harcourt (23,000 m3/day)
Air Liquide Namibia (340,000
Air Liquide Port Harcourt (30,000 m3/day) m3/day)
800
BOC Lagos (30,000 m3/day)
700
US$50m+ required to
gain significant scale
Cost ($/t/y and million $)
600
efficiencies
500
400
Per-unit capital cost ($US/ton/yr)
300
200
100
Total capital cost ($US million)
0
0 100,000 200,000 300,000 400,000 500,000
O2 production capacity (m per day)
3
Exhibit 6: Liquid oxygen plants enjoy significant economies of scale, but many in SSA
are small, with relatively high per-unit capital cost.
12
Sources: (1) Ebrahimi et al., 2015. “Energetic, exergetic and economic assessment of oxygen production from two columns
cryogenic air separation unit” Energy 90(2):1298-1316. (2) Industry websites.
13
Source: World Bank, 2020.
11INSTITUTE FOR
TRANSFORMATIVE
TECHNOLOGIES
Oxygen imports
Senegal
The Gambia Nigeria
Ethiopia
CAR
Benin Uganda
Côte D’Ivoire
Kenya
Ghana Togo
Rwanda
Tanzania
Malawi
Angola
Zambia
Zimbabwe
3-5 million m3
Namibia Madagascar
1-3 million m3
0.5-1 million m3INSTITUTE FOR
TRANSFORMATIVE
TECHNOLOGIES
As such, it can be assumed that existing Because industries that produce
surplus LOX capacity in many countries will capital-intensive commodities tend to
be insufficient to reliably meet the entire maximize their capacity utilization, it is
local medical need. reasonable to believe that there is
insufficient surplus capacity across
For example, in 2019, the main LOX plant in relevant LOX production facilities to meet
Kenya dedicated about 83% of its liquid the scale of need in SSA.
oxygen capacity for industrial applications
and 9% for medical needs; 8% of capacity While it is entirely possible that new LOX
went unused. If this 8% were fully diverted facilities can be constructed, they will
to medical needs, it would boost overall likely be for industrial customers rather
national oxygen supply by 25% (Exhibit 8).14 than exclusively for medical demand.
While not trivial, it is a far cry from the 10x
increase required to meet the full national
medical need.
Medical oxygen in Kenya (cubic meters per year)
343,000
1,015,000
1,743,000
1,400,000
385,000
Current liquid Current PSA Current total Unutilized capacity Potential total
medical O2 supply medical O2 supply medical O2 supply in liquid O2 plant medical O2 supply
Exhibit 8: Liquid oxygen supplies a minority of Kenya’s current medical oxygen, and
full utilization of existing cryogenic capacity would augment national supply by only
25%.
Analysis based on (1) PATH, “Assessment and recommendations to increase access to oxygen and pulse oximetry in Kenya,” March
13
14
2018. (2) BOC Kenya, "Annual Report", 2018 and 2019.INSTITUTE FOR
TRANSFORMATIVE
TECHNOLOGIES
To understand and compare the unit cost of Exhibit 9 shows that the projected per-unit
oxygen from different types of plants and cost of LOX immediately after it is
distribution pathways, we have developed a produced, prior to being stored or
bottom-up cost model. The unit of volume otherwise deployed, is $2.10.15 Note that
in our analysis is 6.8 cubic meters of our cost modeling is based on small-scale
oxygen (i.e., a standard “J” cylinder). LOX plants located in SSA, with relatively
high per-unit capital cost.
As mentioned earlier, our analysis is based
on cost estimates in Kenya (for electricity, The cost of LOX produced at larger
labor, land, etc.), and will therefore need to facilities will be lower (by up to 15–20%),
be adjusted for other countries. but that oxygen will likely need to be
transported across greater distances,
potentially negating the cost advantages of
scale.
Liquid oxygen production cost, per 6.8 m3
$0.80
$0.35
$2.10
$0.35
$0.60
Production facility Maintenance Electricity Labor Production cost
CapEx (amortized) of liquid O2
Exhibit 9: Production cost of liquid oxygen in Kenya is about $2.10 for 6.8 m3 (the
volume in one “J” cylinder, but excluding the cost of cylinder filling). Note that
amortized CapEx is modeled for small-scale LOX plants located in SSA, with
relatively high per-unit capital cost.
15
Key assumptions include: (1) Amortized CapEx cost includes machinery, civil works, and land lease associated with a relatively
small (17 tons/day capacity) cryogenic plant. Service life is assumed to be 30 years, with 85% utilization of 24x7x365 capacity.
(2) Maintenance costs estimated at 2% of capital cost per year, including labor and components. (3) Electricity, at a rate of 200kWh per
ton of oxygen (corresponding to 2,950 kWh per day), and a price of $0.20 per kWh including backup power. (4) Labor, based on 20
workers per plant, each earning $24,000 per year.
14INSTITUTE FOR
TRANSFORMATIVE
TECHNOLOGIES
Producing oxygen in a factory is only the ii. Large liquid tanks direct to hospital: In
beginning. Getting the oxygen to clinics and another pathway, liquid oxygen is taken
patients can be a logistically complex and directly to hospitals, where it is stored
expensive process. Broadly, there are three in large tanks and vaporized on
main pathways for the distribution of liquid demand and distributed to patients via
oxygen (Exhibit 10), as well as hybrids such pipes. This pathway has the lowest cost
as hospital-attached systems with on-site but requires the hospitals to have
cylinder filling stations. installed appropriate piping.
iii. Hub-spoke network of storage/filling
i. Centralized cylinder filling & distribution:
stations: A third pathway is a
The most common pathway in SSA is a
hub-spoke network: liquid oxygen is
centralized system where cylinders are
delivered to storage/filling stations,
filled at the cryogenic plant, followed by
where it is vaporized and compressed
truck distribution of the cylinders to
into cylinders and sent by truck to local
clinics and hospitals. This method is the
clinics and hospitals. This is relatively
most expensive of the three per unit of
cost-effective but requires a
delivered oxygen, and becomes more
decentralized infrastructure and
expensive as the delivery distance
associated operational complexity.
grows.
Distribution pathways for cryogenic liquid oxygen
b. Cylinders delivered to
a. Central cylinder filling: conversion of liquid to gas hospitals and clinics via
followed by compression into cylinders trucks
1. Centralized
cylinder filling
& distribution
b. Delivery via piped system: local storage of
Production of a. Transport large liquid
2. Large liquid oxygen, conversion to gas and piping to
liquid oxygen tanks to hospitals
liquid tanks patient beds
direct to
hospitals
3. Hub-spoke
a. Transport large liquid b. Decentralized storage & filling: conversion to c. Transport to hospitals &
network of tanks to filling stations gas followed by compression into cylinders clinics via trucks
storage/
filling
stations
Exhibit 10: There are three main pathways for distributing liquid oxygen to patients
in hospitals and clinics. Hybrids of these models are also possible.
15INSTITUTE FOR
TRANSFORMATIVE
TECHNOLOGIES
The first model of deployment (centralized As Exhibit 11 shows, the total cost of
cylinder filling and distribution) includes delivery (TCOD) of an oxygen-filled cylinder
the incremental cost of cylinder filling is $15.40, more than 7x the cost of
(cylinders, and a booster for compressing production.
gaseous oxygen into the cylinders), labor
required for sales and distribution, delivery
trucks, fuel, a management team, and
miscellaneous other costs of doing
business.16
Cost of each filled 6.8 m3 oxygen cylinder at point-of-use in clinics or hospitals
$2.00
$1.40
$3.50
$15.40
$4.50
$1.90
$2.10
Production of Cylinder Sales & Mgmt Cost of Misc Cost per
liquid O2 filling distribution overhead capital 6.8 m3 cylinder
Exhibit 11: Projected total cost of delivery (TCOD) is about $15.40 for each 6.8 m3
cylinder of oxygen produced at a LOX cryogenic plant and delivered to health
facilities at a delivery distance of 100 km. This is a substantial increase from its
production cost of about $2 at the cryogenic plant. The specific cost of power, labor,
and so on are estimated for Kenya.
16
Key assumptions: (1) The booster compressor uses 2.4 kWh of electricity per cylinder, and has a service life of ten years.
(2) Cylinders cost $160 each and have a service life of ten years. (This is a conservative estimate as cylinders can last for decades if
inspected regularly for safety.) (3) The operational labor of one worker is included. (4) Sales and distribution efforts include a diesel
truck distributing 100 tanks per run, over a round-trip distance of 100 km with a fuel cost of $1 per liter. (5) Cost of delivery, marketing
and sales personnel included. (6) Management overhead is based on oxygen allocation of overhead in the existing Kenyan cryogenic
gas business as stated in the annual report. (7) Cost of capital is 10%. (8) Miscellaneous costs include losses, regulatory expenses, and
so on.
16INSTITUTE FOR
TRANSFORMATIVE
TECHNOLOGIES
Cost of each filled oxygen cylinder (6.8 m3) at point-of-use
$16.40
$16.30
$16.20
$16.10
$16.00
$15.90
$15.80
$15.70
$15.60
$15.50
$15.40
$15.30
$15.20
$15.10
$15.00
$14.90
$14.70 $14.80
$14.60
$14.50
10 20 30 40 50 60 70 80 90 100 110 120 130 140 150 160 170 180 190 200
Delivery distance (km)
Exhibit 12: Cylinder delivery distance is an important factor in the cost of medical
oxygen at point-of-use. Our main analysis considers a round-trip delivery distance of
100 km by diesel truck. Beyond a certain distance, the oxygen becomes cost
prohibitive. As such, this centralized model is unsuitable for broad, nationwide
coverage.
In the second distribution pathway (large Further, barely 10% of hospitals have
liquid tanks direct to hospital), liquid piping systems installed. Therefore,
oxygen is taken directly to hospitals, where existing piped oxygen systems are
it is stored in large tanks, vaporized on accessible to only 1% of patients (Exhibit
demand, and distributed to patients via 14).18 While it is cost-effective in the long
hospital piping.17 run to have piped systems, most
hospitals cannot (or choose not to) make
In contrast to transport of oxygen gas the capital investment.
compressed into cylinders (the focus of
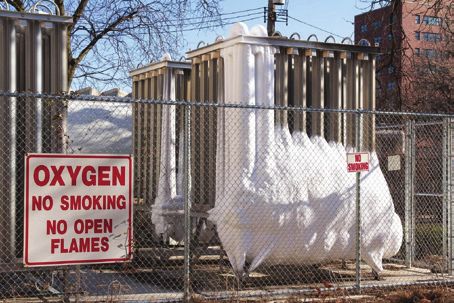
Exhibit 12), transport of liquid oxygen is • LOX cryotanks are well insulated, but the
cost-effective over longer distances, due to temperature gradient between the tank’s
the much-higher density of liquid oxygen contents and warmer ambient air
compared to gaseous oxygen. As Exhibit 13 (particularly in tropical countries) drives
shows, this pathway has the lowest cost of heat flow that warms the LOX. To
the three options. However, the pathway maintain heat and pressure balances,
faces two important constraints: some of the liquid oxygen “boils off” and
is vented from the cryotanks. We
• A very small portion (10%) of the estimate this venting causes a loss of
population in SSA currently has access to about 15% per filling cycle for a cryotank
tertiary hospitals. refilled every three weeks.
17
Key assumptions: (1) Transport cost of $400 per round trip for cryotank containing 17,000 m3 of oxygen. (2) Cost of hospital piping is
$70,000 per facility amortized over 20 years.
18
Analysis based on: “Survey says 90 percent of hospitals countrywide lack piped oxygen,” Sunday Nation, July 2020. 17INSTITUTE FOR
TRANSFORMATIVE
TECHNOLOGIES
Cost of 6.8 m3 of oxygen via piped system (i.e., without cylinders)
$2.00
$0.80
$3.50 $8.90
$0.20
$0.30
$2.10
Production of Tank Hospital Mgmt Cost of Misc Cost per
liquid O2 transport piping overhead capital 6.8 m3 of O2
(amortized) (cylinder
equivalent no. in vol)
Exhibit 13: Transporting liquid oxygen in cryotanks to hospitals, followed by onsite
vaporization and delivery to patients via hospital piping, yields a projected TCOD of
about $9. This exhibit is based on units of 6.8 m3 of oxygen—a volume equivalent to a
standard cylinder—though no cylinders are used in this distribution mechanism.
Patients with access to piped systems
Secondary
25%
With
10% Tertiary 9% 1%
piping
65%
Primary
only No piping
% of patients with access to Tertiary hospitals with versus
different levels of health facilities without piping systems
Exhibit 14: Only 1% of Kenya’s population has access to hospitals with piped oxygen
systems.
18INSTITUTE FOR
TRANSFORMATIVE
TECHNOLOGIES
In the third distribution pathway This option is cost-effective, and a
(hub-spoke network of storage/filling hub-spoke network of decentralized filling
stations), liquid oxygen is delivered from stations can deliver oxygen nationwide at
the central cryogenic plant to decentralized about $15 per delivered cylinder (Exhibit
storage/filling stations. At these stations, 15).19 Such a decentralized filling
the oxygen is vaporized and compressed infrastructure does not currently exist
into cylinders. The cylinders are then anywhere in SSA at any scale, but it can be
delivered to local clinics and hospitals over developed with a moderate investment.
a shorter distribution distance than in the
centralized pathway shown in Exhibit 11.
Cost of each filled 6.8 m3 oxygen cylinder at point-of-use in clinics or hospitals
$2.00
$1.25
$3.50
$15.05
$4.00
$1.90
$0.30
$2.10
Production of Tank Cylinder Sales & Mgmt Cost of Misc Cost per
liquid O2 transport filling distribution overhead capital 6.8 m3 cylinder
Exhibit 15: A hub-and-spoke model with delivery of liquid oxygen to distributed
storage filling stations, followed by cylinder filling and final truck delivery to
point-of-use, yields a projected TCOD of about $15.
Key assumptions: (1) Transport costs are $400 per round trip for a cryotank containing 17,000 m3 of oxygen. (2) Stations are refilled
19
19
every three weeks. (3) Each filling station costs $100,000 and has a service life of ten years.INSTITUTE FOR
TRANSFORMATIVE
TECHNOLOGIES
4. COST ANALYSIS: PSA On the other hand, due to the intrinsic
nature of the PSA adsorption process,
AND VSA OXYGEN individual plants do not scale beyond a
certain limit. As a result, PSA plants do not
Pressure swing adsorption plants are enjoy the economies of scale that LOX
significantly smaller in scale than LOX plants have. That said, since many of SSA’s
plants. PSA plants at the larger end of the LOX plants are relatively small (see
scale produce some 12,000 m3 per day. (By Exhibit 6), their economies of scale are not
contrast, large LOX plants can easily necessarily more favorable than that of
produce 5,000,000 m3 per day.) On the one PSA.
hand, the smaller size of PSA plants means
that local oxygen production
infrastructures can be developed
incrementally without the need for massive
initial capital expenditure (CapEx)
(Exhibit 16).
PSA oxygen plant: Capital investment vs capacity
800
Per-unit capital cost of
700 small liquid O2 plants in
SSA:(>=US$700/ton/yr)
Cost ($/t/y and thousand $)
600
Scale efficiencies can be reached with a
capital investment of US$100,000 (750
500 m3/day), which is the size of a typical PSA
plant in SSA
Total capital cost (US$ thousands)
400
Per-unit capital cost (US$/ton/yr)
300
200
100
0
0 1,000 2,000 3,000 4,000 5,000 6,000 7,000 8,000
O2 production capacity (m3 per day)
Exhibit 16: The PSA process lends itself to a much smaller scale than cryogenic
separation. Therefore, constructing new plants does not require much CapEx. On the
other hand, the PSA process does not benefit from the economies of scale that
cryogenic separation does. However, the per-unit CapEx for a typical PSA plant in
SSA is less than that for smaller LOX plants like the one in Kenya (illustrated by the
blue arrow on the y-axis).
20INSTITUTE FOR
TRANSFORMATIVE
TECHNOLOGIES
PSA technology is relatively immature in A competitive plant is available for less
the SSA market, and this has led to than half the price from an India-based
substantially higher capital costs than manufacturer that has some market
necessary. Our research has shown that presence in SSA, but is not widely known.
CapEx can be reduced by more than 50% The cost advantage is largely driven by
by optimizing the supply chain. Exhibit 17 lower fabrication costs in India. The Indian
compares the CapEx for nominally plant quality appears to be comparable to
equivalent PSA plants from two different that of the market leader.
suppliers. Each plant has an operational
capacity of about one ton of oxygen per
day.20 The more expensive plant is
manufactured by the market leader, which
has a worldwide reputation and numerous
installations in SSA.
PSA system CapEx from different suppliers
>-55%
$290,000
$126,000
Current market leader Alternative
Exhibit 17: There is a wide variation in the capital cost of nominally equivalent PSA
plants from different suppliers, suggesting that there is considerable room for
reducing cost compared to the status quo in SSA.
20
Based on quotes from equipment suppliers and interviews with equipment customers. 21INSTITUTE FOR
TRANSFORMATIVE
TECHNOLOGIES
Vacuum Swing Adsorption (VSA) is a Exhibit 18 shows the per-unit cost of 6.8 m3
relatively newer configuration of the same of oxygen gas from different production
adsorption process as PSA, and it is processes, not including compression into
currently cost-competitive at scales cylinders or any other form of packaging or
intermediate between PSA and LOX. Like delivery. By far, the biggest differentiator in
PSA, VSA delivers oxygen purity levels of the production cost of oxygen across the
90–95% by volume. VSA plants are different processes is electricity. On a
typically larger-scale than PSA plants per-unit basis, the PSA process needs
(producing from 750 to 200,000 m3 of slightly less than double the electricity of
oxygen per day) and have higher CapEx but the VSA process, and more than four times
lower operating expenditure (OpEx) that of the LOX process.
compared to PSA, driven by lower energy
requirements.
As a newer technology, VSA has very
limited presence in SSA. On the other
hand, its relative nascence is leading to a
number of promising innovations. VSA
may also have advantages over PSA at
high altitude and in high-temperature
locations.
By far, the biggest differentiator in the production cost of
oxygen across the different processes is electricity.
22INSTITUTE FOR
TRANSFORMATIVE
TECHNOLOGIES
One notable observation is that the We estimate that labor costs are slightly
per-unit CapEx for PSA and VSA21 are lower for the PSA/VSA systems since they
lower than for small-scale LOX plants. As are relatively simple compared to LOX
mentioned earlier, this cost would be plants, at the scale considered in the
considerably lower for larger-scale plants, analysis. Adding these various costs, PSA
but since many of the LOX factories in SSA oxygen costs 20% more than LOX, but VSA
are at the smaller end of the spectrum, we costs essentially the same as LOX on a
considered it a more appropriate per-unit basis.
comparison.
Oxygen production cost, per 6.8 m3
$2.55 +20%
$2.15 +2%
Labor $0.65
$2.10
$0.75 $0.80
Electricity $1.50 $0.35
$0.85
$0.35
$0.10
Maintenance $0.08
$0.60
$0.45
Production facility $0.33
CapEx (amortized)
PSA VSA Liquid
Exhibit 18: On a per-unit basis, the production cost of PSA oxygen is 20% higher than
that of LOX and VSA. The largest driver of cost is electricity. Note that this only
describes production cost, not the total cost of delivery to patients (which is much
higher). Also, per-unit CapEx for PSA and VSA compare favorably to LOX because we
use the example of the smaller LOX plants common in SSA.
VSA estimate is based on quotes from one well-known supplier. We will expand this analysis over time but do not expect meaningful
23
21
changes.INSTITUTE FOR
TRANSFORMATIVE
TECHNOLOGIES
Distribution pathways for PSA and VSA oxygen
b. Cylinders delivered to hospitals
a. Production unit connected to onsite compressor that fills cylinders and clinics via trucks
1. Cylinder
distribution
a. Production unit at hospital site attached to piping system connected to patient beds
2. Hospital
attached
Exhibit 19: There are two main mechanisms for distributing PSA/VSA oxygen to
patients in hospitals and clinics.
Analogous to the distribution pathways for ii. Hospital-attached: A hospital-attached
LOX shown in Exhibit 10, there are two system that distributes oxygen to
primary distribution pathways for PSA and patients via piping. This has lower cost
VSA systems, each with its own challenges and simpler logistics, but requires
(Exhibit 19). As with LOX, hybrid models clinical infrastructure. As noted earlier,
for PSA/VSA are possible—e.g., only a small fraction of healthcare
hospital-attached systems with onsite facilities in SSA have oxygen piping.
cylinder filling stations.
i. Centralized cylinder filling & distribution:
Compression of oxygen into cylinders at
the point of manufacture, followed by
truck distribution of the cylinders to
clinics and hospitals. This pathway is
the most common but gets more
expensive as delivery distances grow.
INSTITUTE FOR
TRANSFORMATIVE
TECHNOLOGIES
24INSTITUTE FOR
TRANSFORMATIVE
TECHNOLOGIES
Exhibit 20 shows the total cost of delivery • management overhead—while it could
of one 6.8 m3 cylinder of oxygen for PSA be argued that management overhead
and VSA, and compares it to the cost of offers economies of scale for LOX, it is
LOX. Conventionally, the unit cost of LOX is also a significantly more complex
often described as being much lower than operation with many more in-house
oxygen from PSA/VSA. However, as functions;
post-production costs (cylinder filling,
sales and distribution, management • cost of capital—there is no reason to
overhead, cost of capital, and so on) are believe this will be a function of the
added, the total costs of the three underlying process, although larger
processes converge. companies can negotiate better
financing terms;
Note that we are making the simplifying
assumption that all other costs (beyond • miscellaneous—these are various or
production) are the same for three unforeseen costs associated with the
processes. This is because: cylinder distribution process (e.g.,
losses, accessory repairs, etc.) and not
• the cylinder filling process is exactly the dependent on the underlying process.
same for all three processes;
sales and distribution are more a
function of (a) how fragmented the
customer base is and (b) how much an
individual organization chooses to
invest in sales/distribution capabilities,
rather than of the underlying production
process;
Cost of each filled 6.8 m3 oxygen cylinder at point-of-use in clinics or hospitals
+3%
$15.90
$15.45 $15.40
Misc $2.00
$2.00 $2.00
Cost of capital $1.45
$1.40 $1.40
Mgmt overhead $3.50
$3.50 $3.50
Sales & distribution $4.50
$4.50 $4.50
Cylinder filling $1.90
$1.90 $1.90
O2 production $2.55 $2.15 $2.10
PSA VSA Liquid
Exhibit 20: The TCOD of a cylinder of oxygen at the point-of-use is virtually the same
whether sourced from PSA, VSA, or LOX plants.
25INSTITUTE FOR
TRANSFORMATIVE
TECHNOLOGIES
Exhibit 21 shows the cost of PSA/VSA for Of course, the problem still remains that
hospital-attached systems, compared to there aren’t enough accessible health
LOX. Again, taking into account the various facilities with piping infrastructure.
post-production costs (which, following
the earlier argument, will be similar for
each of the processes), the unit costs of
PSA/VSA and liquid oxygen are very close
to each other.
Cost of 6.8 m3 of oxygen via piped systems (i.e., without cylinders)
$2.00
$0.80
$8.75 - $9.05 $8.90
$3.50
$0.20
$2.15 - $2.55
PSA/VSA Hospital piping Mgmt overhead Cost of capital Misc Cost per 6.8 m3 of Cost of
production (amortized) PSA/VSA O2 liquid O2
(cylinder equivalent vol)
Exhibit 21: The TCOD of distributing oxygen via hospital piping is virtually the same,
about $9, whether the oxygen is generated onsite in PSA or VSA plants or vaporized
onsite from delivered liquid oxygen.
26INSTITUTE FOR
TRANSFORMATIVE
TECHNOLOGIES
5. A DECISION-MAKING However, it is reasonable to believe
there is enough surplus to achieve
FRAMEWORK some meaningful impact, especially in
targeted locations ripe for investment
As the above analysis shows, the unit costs in medical oxygen (e.g., if a particular
of LOX and PSA/VSA oxygen are close national or provincial government
enough to each other that they are within makes it a policy priority).
the margin of optimization of all the other
costs across the delivery system. There • Potential for new capacity: The global
are, however, a number of important LOX industry grew between 2015 and
differences between the processes. The 2019 at a compound annual rate of
following summarizes the state of play for 6.1%.22 It is reasonable to believe that
LOX: such growth will continue, especially
driven by economic development in
i. Industry maturity: Cryogenic air emerging economies. This means new
separation is a mature industry in SSA capacity will come online, although it is
thanks to the long history of extractive unlikely such investment will be made
industries in the region. Industry-leading exclusively for medical purposes.
multinational companies have had a Independent of LOX supply, an
presence for decades in many countries extensive cylinder filling
across SSA, with sophisticated infrastructure—needed to serve rural
capabilities and relatively optimized areas—will take several years.
operations.
• Ease/complexity of operations: LOX
ii. Existing capacity: There is likely not producers have the operational and
enough local production in most SSA logistical capabilities to transport large
countries to meet the entirety of local liquid tanks as well as small oxygen
demand. However, importing/exporting cylinders. With cylinders, there are no
oxygen is a common practice, with complex downstream operations
established processes and protocols. involved. Likewise, with hospital-
The open question is whether there is attached systems, there is limited
enough surplus capacity within ongoing maintenance required once
reasonable shipping distance of the the storage and piping infrastructure
target sites to make importing feasible. has been installed. However, cylinder
Since cryogenic air separation is an filling operations are somewhat
extremely capital intensive industry, the involved, requiring air compressors
economics of LOX production will work and regular maintenance of other
only if capacity is maximally utilized. accessories.
Therefore, it is unlikely that there is
enough surplus LOX in the relevant
production ecosystem to solve the
problem at the needed scale across SSA.
22
Source: “Global Oxygen (Medical & Industrial) Market Report,” Global Newswire, 2020. 27INSTITUTE FOR
TRANSFORMATIVE
TECHNOLOGIES
The state of play for PSA/VSA is: • Potential for new capacity: New PSA
• Industry maturity: The PSA/VSA industry plants can be installed as
is far less mature in SSA, compared to pre-assembled (skid-mounted)
LOX. There are no local manufacturers, systems, available from many sources.
and the supply chain for maintenance However, considering the time
and repair is also limited. However, required to assemble, ship, and install
there is a vibrant supply chain in India the systems, any massive ramp-up will
and other countries with low take several years. Cylinder filling
system-manufacturing costs. stations are typically co-located with
the PSA plants.
The skills required for manufacturing
PSA/VSA systems are not substantially • Ease/complexity of operations: Most of
different from those required for many the nonfunctional PSA plants in SSA
other mechanical engineering industries are donor funded, with limited
experiencing rapid growth in emerging investment in ensuring long-term
economies. As such, we believe it is operational viability. While some effort
feasible—indeed, important—to develop is involved in maintenance/repair of
local maintenance and repair these plants, we believe these plants
capabilities in SSA. could be viable with well-managed
operations.
In the medium term, there is every
reason to believe manufacturing Importantly, the level of effort to
capabilities can also be developed in maintain PSA/VSA plants is only
regional hubs with rapidly emerging marginally incremental to what is
engineering industries. needed to maintain cylinder filling
stations.
• Existing capacity: Current capacity is
negligible compared to what is needed,
and many of the existing plants are not
functional—potentially beyond feasible
repair. A minor additional supply of
medical oxygen may be achieved in
some regions by repairing and
maintaining some existing equipment.
28INSTITUTE FOR
TRANSFORMATIVE
TECHNOLOGIES
For individual (or a small number of) Based on the above assessment, we
tertiary hospitals especially in conclude that the benefits of local control
urban/peri-urban areas, the optimal and predictable supply offered by PSA
choice is onsite LOX tanks, vaporized on plants offset the incremental operational
demand and delivered to patients via complexity involved—particularly
piped systems. These hospitals can serve considering the logistical complexity of
as “anchor users” and serve as hubs for ensuring large numbers of regular
distributing oxygen cylinders to local deliveries by LOX tanks.
primary/secondary clinics. Such a solution
may be appropriate for rural tertiary A PSA-led infrastructure can also
hospitals as well, but only if the strategically incorporate LOX sites in
transportation infrastructure allows appropriate locations based on supply
easy/regular access for large LOX trucks. levels. On the margin, therefore, we
Otherwise, onsite PSA systems may be believe that a decentralized network
more appropriate. consisting largely of PSA plants offers the
most promising option for a sustainable,
However, to reach a meaningfully large self-reliant, large-scale solution to SSA’s
population, including in rural areas, an medical oxygen deficit.
extensive decentralized oxygen
infrastructure will be needed, with
networks of PSA plants or LOX bulk
storage sites replenished regularly via
trucks from a central LOX production
facility. Both types of facilities will also
need cylinder filling stations.
To reach a meaningfully large population, including in rural areas,
an extensive decentralized oxygen infrastructure will be needed,
with networks of PSA plants or LOX bulk storage sites replenished
regularly via trucks from a central LOX production facility.
29INSTITUTE FOR TRANSFORMATIVE TECHNOLOGIES
You can also read