Using QALYs versus DALYs to measure cost-effectiveness: How much does it matter?
←
→
Page content transcription
If your browser does not render page correctly, please read the page content below
International Journal of                             Using QALYs versus DALYs to measure cost-
       Technology Assessment in
       Health Care                                          effectiveness: How much does it matter?
       cambridge.org/thc                                    Xue Feng, David D. Kim, Joshua T. Cohen, Peter J. Neumann
                                                            and Daniel A. Ollendorf
                                                            Center for the Evaluation of Value and Risk in Health, Institute for Clinical Research and Health Policy Studies,
                                                            Tufts Medical Center, Boston, MA, USA
       Method
       Cite this article: Feng X, Kim DD, Cohen JT,           Objectives. Quality-adjusted life-years (QALYs) and disability-adjusted life-years (DALYs)
       Neumann PJ, Ollendorf DA (2020). Using QALYs           are commonly used in cost-effectiveness analysis (CEA) to measure health benefits. We
       versus DALYs to measure cost-effectiveness:            sought to quantify and explain differences between QALY- and DALY-based cost-effective-
       How much does it matter? International
                                                              ness ratios, and explore whether using one versus the other would materially affect conclu-
       Journal of Technology Assessment in Health
       Care 36, 96–103. https://doi.org/10.1017/              sions about an intervention’s cost-effectiveness.
       S0266462320000124                                      Methods. We identified CEAs using both QALYs and DALYs from the Tufts Medical Center
                                                              CEA Registry and Global Health CEA Registry, with a supplemental search to ensure compre-
       Received: 23 May 2019                                  hensive literature coverage. We calculated absolute and relative differences between the QALY-
       Revised: 17 December 2019
       Accepted: 19 February 2020                             and DALY-based ratios, and compared ratios to common benchmarks (e.g., 1× gross domestic
                                                              product per capita). We converted reported costs into US dollars.
       Key words:                                             Results. Among eleven published CEAs reporting both QALYs and DALYs, seven focused on
       QALY; DALY; Cost-effectiveness analysis;               pharmaceuticals and infectious disease, and five were conducted in high-income countries.
       Medical-decision
                                                              Four studies concluded that the intervention was “dominant” (cost-saving). Among the
                                                              QALY- and DALY-based ratios reported from the remaining seven studies, absolute differ-
                                                              ences ranged from approximately $2 to $15,000 per unit of benefit, and relative differences
                                                              from 6–120 percent, but most differences were modest in comparison with the ratio value
                                                              itself. The values assigned to utility and disability weights explained most observed differences.
                                                              In comparison with cost-effectiveness thresholds, conclusions were consistent regardless of the
                                                              ratio type in ten of eleven cases.
                                                              Conclusions. Our results suggest that although QALY- and DALY-based ratios for the same
                                                              intervention can differ, differences tend to be modest and do not materially affect compari-
                                                              sons to common cost-effectiveness thresholds.

                                                            Cost-per-quality-adjusted life-year gained (QALY) and cost-per-disability-adjusted life-year
                                                            averted (DALY) studies have become commonly used measures in the current practice of
                                                            cost-effectiveness analysis (CEA) (1;2). In recent decades, childhood and adult mortality
                                                            rates have continued to decline worldwide (3), whereas morbidity, or time lived with health
                                                            loss, has become a more serious concern in high-income countries (HICs) and low- and
                                                            middle-income countries (LMICs) alike. Consequently, QALYs and DALYs are being used
                                                            increasingly frequently to assess the cost-effectiveness of interventions that affect quality as
                                                            well as length of life. Because of this, a practical question for researchers and decision makers
                                                            is which measure should be applied to a given intervention in a specific setting, whether
                                                            defined by disease, geography, a country’s per capita income, or another characteristic. The
                                                            QALY-based measure has been recommended by many health technology assessment agencies
                                                            in HICs, whereas the DALY-based measure is generally preferred in LMICs (4;5). Indeed,
                                                            the number of published cost-per-DALY studies has substantially increased in LMICs over
                                                            the past decade (2). One possible reason is that the freely and publicly available disability
                                                            weights, which required for DALY calculations, can significantly reduce the cost of conducting
                                                            CEA in resource-constrained settings. In contrast, cost-per-QALY studies, which use utility
                                                            estimates for specific states and capabilities, may require more time and resources to collect
                                                            or assemble (6).

       © Cambridge University Press 2020. This is an
       Open Access article, distributed under the
                                                            QALYs and DALYs: Similarities and Differences
       terms of the Creative Commons Attribution
       licence (http://creativecommons.org/licenses/        Conceptual Approach
       by/4.0/), which permits unrestricted re-use,
       distribution, and reproduction in any medium,        Although the intent in using QALYs or DALYs in CEAs is similar, the theoretical and tech-
       provided the original work is properly cited.        nical underpinnings of the two metrics differ (1). The concept of the QALY was developed in
                                                            the 1960s; it represents the products of years lived and the associated utility values, ranging
                                                            from 0 (dead) to 1 (perfect health). Utility estimates represent the perspective of an individ-
                                                            ual’s values or preferences, based on the central tenet of “welfarist” economics—that individ-
                                                            uals are the best judges of their own welfare, and improved societal welfare as the ultimate goal

Downloaded from https://www.cambridge.org/core. IP address: 176.9.8.24, on 02 Oct 2020 at 03:31:35, subject to the Cambridge Core terms of use, available at https://www.cambridge.org/core/terms.
https://doi.org/10.1017/S0266462320000124
International Journal of Technology Assessment in Health Care 97
is based on the sum of these individual utilities. However, QALYs Methods
also integrate so-called “extra-welfarist” elements to utility assess-
Inclusion Criteria
ment, such as the contribution of particular states of health,
functioning, and patient preferences to utility estimation (7;8). Studies included English-language CEA articles that reported
The primary application of QALYs has been the same ever results using both cost-per-QALY and cost-per-DALY measures,
since their initial use—to compare the benefits and risks of medical published from 1996 through 2018.
interventions (9).
In contrast, the DALY was developed in the 1990s by the
Data Sources
Global Burden of Diseases, Injuries, and Risk Factors (GBD) ini-
tiative to assess burden of disease at a population level, to under- We utilized two databases maintained by the Center for the
stand leading causes of health loss worldwide, and to compare Evaluation of Value and Risk in Health at Tufts Medical Center
population health across geographic settings (10). DALYs reflect in Boston, Massachusetts: the CEA Registry (http://www.cearegis-
the sum of years of life lost due to premature mortality and try.org), with information on 7,287 cost-per-QALY studies col-
years lived with disability. The disability weights used for lected from 1976 to 2017, and the Global Health (GH) CEA
DALYs are inverse to that of utility weights, with “0” referring Registry (http://www.ghcearegistry.org), which summarizes 620
to no disability and “1” representing the dead state. DALYs also cost-per-DALY studies from 1996 to 2017. The search strategies,
do not explicitly integrate extra-welfarist concepts; for example, data collection process, and review methods are similar for the
disability weights are defined not based on surveys of individuals two registries and have been described previously (1;17;18). We
but based on expert opinion, as in the view of its developers a sin- used the title and PubMed ID of the article to identify whether
gle set of weights anchored to specific diseases better facilitated there were studies contained by both registries. If so, the identified
cross-cultural comparisons than did some form of self-assessment study was deemed eligible based on our inclusion criteria, as both
(9). In addition, non-health effects are limited to age and sex QALY- and DALY-based ratios were reported in the same article
alone. In recent years, GBD has refined its disability weights to for the same intervention(s).
attempt to isolate health loss from welfare loss and social context We also performed a supplemental search to identify
(11); these weights are intended to be universal and invariant to articles published since 2018 using databases of PubMed,
setting or population but are still undergoing further testing. EMBASE, and Econlit to identify articles reporting results by
both measures. We followed the same steps as mentioned above
and used keywords of “QALYs,” “quality-adjusted,” “DALYs,”
and “disability-adjusted,” to identify candidate papers.
Empirical Comparisons
A number of other studies have discussed the theoretical differ-
Variables and Analysis of Data
ences between QALYs and DALYs (9;12–16), and have generally
concluded that both measures have proven serviceable for We extracted information from the selected articles, including
resource allocation and priority-setting, but do differ in terms year of publication, intervention type, study region, disease area,
of estimation. For example, Sassi et al found that numeric differ- study funder, study perspective, cost discount rate, DALY and
ences between utility and disability weights may lead to further QALY discount rate, age-weighting use, sources of disability
divergence between the QALYs and DALYs (12). Age weighting weights, sources of utilities, cost-per-QALY gained and
was also considered a major difference between the two measures cost-per-DALY averted results in the base case, the use of a cost-
(9), although the GBD no longer recommends such weighting. effectiveness “threshold” for decision making as mentioned by the
Airoldi et al. found that QALY gained is consistently larger authors, and the conclusions of the study.
than DALY averted because of the reference age used; differences We quantified the differences between ratios by QALY and
tend to become larger for older ages (13). Given that an interven- DALY measures based on their absolute and relative difference.
tion may have differential impacts on population subgroups Relative difference was defined as the absolute difference divided
defined by age, the choice to adopt one measure over the other by the QALY-based ratio. Magnitudes of both types of differences
may further affect the process of healthcare decision making were compared. We also counted the number of cases for which
when considering potential interventions to fund. A recent the cost-per-DALY was higher than the cost-per-QALY for each
study by Augustovski et al. used two models from empirical stud- intervention studied. All costs estimated in non-U.S. currency
ies to evaluate the impact of using QALY- and DALY-based were converted to United States (U.S.) dollars based on the pre-
methods (16). The authors concluded that differences between sent value year used in each article as we intended to evaluate
the two approaches (e.g., the effects of discounting) could affect differences within rather than between studies. In addition, we
the magnitude of QALY and DALY estimates, and therefore influ- compared the QALY- and DALY-based ratios to commonly
ence policy decisions. However, the structural uncertainty intro- used cost-effectiveness thresholds, including those reported by
duced by use of the QALY versus DALY was similar to that the articles such as one time gross domestic product (GDP) per
associated with other key model assumptions. Despite these anal- capita, as well as any country-specific thresholds mentioned in
yses, there remains a lack of empirical studies directly comparing the articles. Because our sample size was expected to be small, pri-
the two measures to assess their relationship and explore whether mary analyses were descriptive in nature.
the choice of one versus another affects decision making in prac- Furthermore, we estimated the net monetary benefit (NMB)
tice. Hence, the objective of this study was to quantify differences based on QALY and DALY measures, respectively (NMB =
between CEA using DALYs versus QALYs, and to assess the rea- ΔQALY [DALY] × threshold − ΔCost) so the results from both
sons for differences. We also evaluated whether using one versus measures could be expressed in the same unit of U.S. dollars
the other measure would affect conclusions about the favorability for further comparison. When calculating the NMB, we applied
of an intervention’s cost-effectiveness. the threshold reported in each article, whether based on a
Downloaded from https://www.cambridge.org/core. IP address: 176.9.8.24, on 02 Oct 2020 at 03:31:35, subject to the Cambridge Core terms of use, available at https://www.cambridge.org/core/terms.
https://doi.org/10.1017/S026646232000012498 Feng et al.
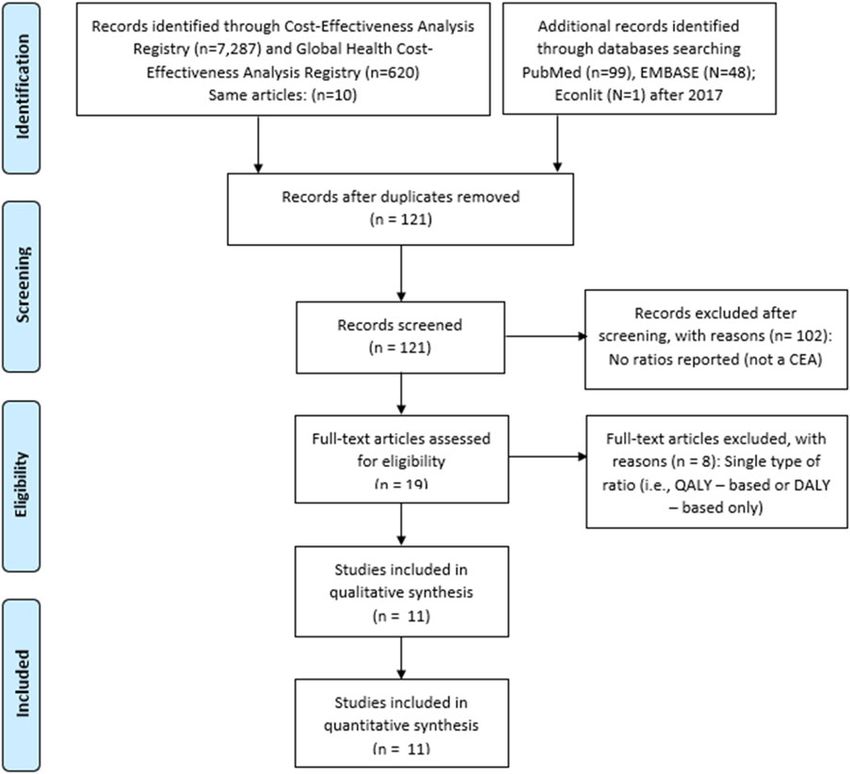
Fig. 1. Search strategy.
commonly used benchmark (e.g., 1× GDP per capita) or a perspectives of the healthcare sector (36 percent, 4/11) or health-
country-specific estimate. Costs were presented in 2018 U.S. dol- care payer (36 percent), or with a limited societal perspective (27
lars for this analysis. The Pearson correlation coefficient was used percent, 3/11). Most studies applied a discount rate of 3 percent
to examine the relationship between the relative differences as for costs, QALYs, and DALYs. One study reported using age-
assessed by NMB and the relative differences based on ratios. weighting for the DALY measure. Cost-effectiveness threshold
benchmarks of 1× or 3× GDP per capita were mentioned in all
studies from LMICs, whereas country-specific thresholds (e.g.,
Results
Australia: 50,000 AU$; The Netherlands: 20,000 euros)
In total, we obtained eleven articles—ten articles from the two were used in the HICs. Disability weights from GBD sources
Tufts Medical Center registries and another 2018 article identified were cited in eight articles (73 percent, 8/11), and utilities were
through the literature search (Figure 1) (19–29). Among the obtained from a variety of sources, often not specific to the
eleven articles in Table 1, seven (64 percent) focused on infectious study setting. For example, utilities in a Zambia-based interven-
diseases (i.e., HIV, TB, hepatitis B, hepatitis C, and rotavirus tion cited a previous study in another African country (19); a
infections). Most of the articles (82 percent, 9/11) were published Malawi study applied utilities from an Indian setting (29); and
from 2015 to 2018. Five (45 percent) of the studies were from high a Gambia study used utilities from multiple countries (26).
income settings. Pharmaceutical interventions were assessed in Most of the included studies (64 percent, 7/11) applied a
seven studies (64 percent, 7/11); other types of interventions Markov model; other modeling techniques included decision-tree,
included immunization, care delivery, surgery, health education stochastic simulation, and metapopulation and compartment
and behavior, legislation, and nutrition. Studies received funding modeling. Only two studies stated they used primary data from
from various sources such as government, foundations, academic specific clinical trials (26;28) to inform effectiveness calculations.
institutions, healthcare organizations, the pharmaceutical indus- Four articles reported that the intervention of interest was
try, and other agencies. Studies were conducted using the “cost-saving” relative to the comparator (i.e., no cost-effectiveness
Downloaded from https://www.cambridge.org/core. IP address: 176.9.8.24, on 02 Oct 2020 at 03:31:35, subject to the Cambridge Core terms of use, available at https://www.cambridge.org/core/terms.
https://doi.org/10.1017/S0266462320000124https://doi.org/10.1017/S0266462320000124
Downloaded from https://www.cambridge.org/core. IP address: 176.9.8.24, on 02 Oct 2020 at 03:31:35, subject to the Cambridge Core terms of use, available at https://www.cambridge.org/core/terms.
International Journal of Technology Assessment in Health Care
Table 1. Study characteristics and methodology (N = 11)
Study Source for
perspective Threshold Discount disability
Article Setting Disease area Intervention type Study funder by reader mentioned rate (%) weights
1 Ryan et al. (19) Zambia HIV infection Pharmaceutical Government Healthcare 1× GDP per 3 GBD
payer capita
2 Mangen et al. (20) The Rotavirus Immunization Not determined Limited €20k 3 The
Netherlands infection societal Netherlands
3 Mihalopoulos et al. (21) Australia PTSD Care delivery; health Government, non-profit Healthcare AU$50,000 3 Australia
education and organization sector
behavior;
pharmaceutical;
legislation
4 Long et al. (22) USA Obesity Nutrition; legislation Government, Limited NA 3 NA
foundation societal
5 Diel et al. (23) UK TB Pharmaceutical Not determined Limited €10k 3 GBD
societal
6 Wolfson et al. (24) Germany TB Pharmaceutical Pharmaceutical Healthcare NA 3.5 GBD
industry payer
7 Nguyen et al. (25) Papua New TB Care delivery, Academic institutions Healthcare 1× GDP per 3 GBD
Guinea, Pharmaceutical, payer capita
Australia screening AU$35,000–
120,000
AU$40,000–
80,000
8 Nayagam et al. (26) Gambia Hepatitis B Screening, Political and economic Healthcare 1× GDP per 3 GBD
pharmaceutical organization sector capita
$240 per
DALY
3× GDP per
capita
9 Aggarwal et al. (27) India Hepatitis C Pharmaceutical None Healthcare 3× GDP per 3 GBD
payer capita
10 Löfgren et al. (28) Uganda Groin hernia Surgery Government, Healthcare 1× GDP per NA GBD
foundation, academic sector capita
institutions, healthcare
organizations,
pharmaceutical
industry, other
11 Vetrini et al. (29) Malawi Diabetic Screening, medical Foundation Healthcare 1× GDP per 3 GBD
retinopathy procedure sector capita, 3×
and macular GDP per
edema capita
AU, Australian; GBD, global burden of diseases, injuries, and risk factors; GDP, gross domestic product; NA, not applicable; PTSD, post-traumatic stress disorder; TB, tuberculosis; UK, the United Kingdom; USA, the United States.
99100 Feng et al.
Table 2. Differences between cost-per-QALY and cost-per-DALY (N = 11)
ICER ($/unit of benefit [DALY
or QALY])
Absolute Relative difference QALY-based ratio >
Article QALY-based DALY-based difference (%) DALY-based ratio
1 Ryan et al. (19) 94 53 41 43.6 Yes
2 Mangen et al. (20)
Rotarix® ≈69,803 55,842 ≈13,961 ≈20.0 Yes
RotaTeq® ≈76,356 61,540 ≈14,815 ≈19.4 Yes
3 Mihalopoulos et al. (21)
Adults 16,967 14,288 2,679 15.8 Yes
Children 7,948 7,144 804 10.1 Yes
4 Long et al. (22) Cost-saving
5 Diel et al. (23) Cost-saving
6 Wolfson et al. (24) Cost-saving
7 Nguyen et al. (25)
Papua New Guinea— 3.5 5.3 1.8 52.0 No
South Fly
Australia—Torres Straits 6,077 8,462 2,385 39.2 No
Islands
8 Nayagam et al. (26) 511 540 29 5.7 No
9 Aggarwal et al. (27) Cost-saving
10 Löfgren et al. (28)
Low-cost mesh 7.6 16.8 9.2 121.5 No
Commercial mesh 33.3 58.2 24.9 74.7 No
11 Vetrini et al. (29) 400 766 366 91.5 No
DALYs, disability-adjusted life-years; QALYs, quality-adjusted life-years.
ratio was calculated) (Table 2). Among the seven remaining stud- estimated using the cost-per-DALY measures (relative differences:
ies with the eleven intervention-specific QALY- and DALY-based 122 and 75 percent for low-cost and commercial mesh, respec-
ratios, cost-per-DALY results were higher than cost-per-QALY in tively); the authors posited that the GBD algorithm may have
six cases, whereas the reverse was seen in the other five instances. underestimated the magnitude of disability associated with groin
The magnitude of difference between the two measures also var- hernia in the study country (Uganda). This may also explain the
ied across studies. The relative differences between the two mea- comparatively large relative difference (91.5 percent) seen in a
sures ranged from 6 to 122 percent, and absolute differences from study of screening and laser treatment for diabetic retinopathy
approximately $2 to $15,000. However, the magnitude of differ- and macular edema in Malawi (29). On the other hand, much
ence was consistently modest, even in cases with seemingly smaller relative differences were observed in articles with disability
large differences (Figure 2). For example, the study reporting an weights and utilities from the same or similar contexts. For exam-
absolute difference of $15,000 between ratios for rotavirus vaccines ple, the relative differences between ratios were approximately 10
in The Netherlands (20), had ratios that were both relatively high; percent in an Australian analysis of a multi-component interven-
as a result, the relative difference between ratios was only 19 per- tion for post-traumatic stress disorder, which featured utilities
cent. In contrast, the seemingly large relative difference of 122 per- and disability weights that were both Australia-derived (20).
cent was from a study of low-cost surgical mesh in a LMIC, with an In Figure 2, we present the ratios of cost-per-QALY and
absolute difference of only $9 between ratios (28). We were able to cost-per-DALY compared with a set of threshold benchmarks
conduct our secondary analysis of NMB on seven interventions. In for decision making for LMICs and HICs separately. Among
general, relative differences using these estimates were consistent eleven pairs of QALY- and DALY-based ratios, we identified
with those directly employing the QALY- and DALY-based ratios only one instance of a change in favorability of results when com-
(Pearson correlation coefficient = .67; Supplementary Table). pared to a cost-effectiveness threshold (29). For the remaining ten
In many (73 percent) of these studies, global disability weights pairs with consistent conclusions, two pairs from the same study
from the GBD studies were employed for DALY estimation, ver- were not considered to be “cost-effective” interventions using
sus locally derived utility weights for QALYs. Few authors elabo- the country-specific threshold or 1× GDP per capita (20), for
rated the possible reasons for the differences. For example, in the both QALY- or DALY-based ratios. Both ratios for another inter-
study of surgical mesh (28), the authors found that the estimate of vention were slightly above the threshold of 1× GDP per capita in
the cost-per-QALY ratios were approximately half of the ratios the study country (26).
Downloaded from https://www.cambridge.org/core. IP address: 176.9.8.24, on 02 Oct 2020 at 03:31:35, subject to the Cambridge Core terms of use, available at https://www.cambridge.org/core/terms.
https://doi.org/10.1017/S0266462320000124International Journal of Technology Assessment in Health Care 101
Fig. 2. Cost-per-QALY, cost-per-DALY, and thresholds: (a)
LMICs and (b) HICs.
Note: Study-report: Australia: 50,000 AU$ in 2005 for
Mihalopoulos et al.; The Netherlands: 20,000 euros for
Mangen et al.; 40,000 AU$ in 2015 for Nguyen et al.; 679
US$ for Vetrini et al.; 240 US$ for Nayagam et al.
DALYs, disability-adjusted life-years; QALYs, quality-adjusted
life-years; GDP, gross domestic product.
Discussion possible reasons for these differences. Our findings suggest that
differences were modest in relation to each ratio’s magnitude in
Our study represents an attempt to quantify differences in esti- most cases. Perhaps more importantly, in the vast majority of
mates of cost-effectiveness based on QALY- and DALY measures cases, these differences would not affect CEA conclusions or deci-
when both were used in the same evaluation, and to explore sions based on commonly used thresholds for cost-effectiveness.
Downloaded from https://www.cambridge.org/core. IP address: 176.9.8.24, on 02 Oct 2020 at 03:31:35, subject to the Cambridge Core terms of use, available at https://www.cambridge.org/core/terms.
https://doi.org/10.1017/S0266462320000124102 Feng et al.
On the other hand, these modest differences may still have the makers’ willingness to divert funds from other healthcare interven-
potential to affect decisions to fund or not fund the health inter- tions and/or consumption outside the healthcare sector. Whether or
ventions; decision making can be influenced by many factors (e.g., not decisions would differ for QALY- and DALY-based estimates
the opportunity cost of other interventions) that vary within the using specific thresholds needs further exploration.
specific contexts of each country. In addition, the motivation to We acknowledge several limitations in our study. First, given
use the two measures for the same intervention was not clearly likely differences in model structure, estimation, and programing
stated in the included articles. For example, two studies men- language, among others, for the same intervention among different
tioned that the two measures were the most commonly used met- CEAs, it is likely not feasible to adjust for these differences or
rics (21;25), and another posited that the use of the two measures directly compare the cost-per-QALY and cost-per-DALY results
may increase the robustness of the analyses (21). We cannot rule generated from different studies. Our exclusion of such studies lim-
out the possibility of self-selection, however, potentially mani- ited the number of articles to those that used both measures in the
fested here by focus on models, treatments, and conditions that same evaluation, which in turn limited our sample size and pre-
would have ensured concordance of results between the two cluded the use of hypothesis testing. Second, we cannot rule out
measures. the possibility that the observed consistency between QALY- and
One of the major issues is that many of the included studies DALY-based measures may be due in part to publication bias, man-
did not provide sufficient details on model specification to explain ifested by a predisposition to publish studies with consistent results,
the factors associated with ratio-based differences. It is likely, whether favorable or unfavorable. Moreover, the calculation of the
however, that source of utilities and disability weights were a differences between the two ratios and the use of a single threshold
major driver. This may be a particular issue in LMICs, because for decision making recommendations is based on an assumption
respondents used as the basis of global estimates of disability that the QALY and the DALY reflect comparable constructs. As
weights were primarily from high-income settings in GBD studies described previously, these measures reflect somewhat different
(30–32), and because utility data often must be obtained from set- domains of health and may not be readily exchangeable
tings other than the location of interest for the study. In addition, (11;30;35). If this holds true, then different thresholds are likely
comparatively small absolute differences in cost/QALY and cost/ required to inform decision making. On the other hand, the differ-
DALY ratios were often observed in studies targeted for LMICs, ences in construction and interpretation of DALYs and QALYs are
which reflects the relatively low costs of the interventions in not likely to affect the interpretation of our findings from the per-
these studies. For instance, the total cost of the intervention of spective of the current application of CEA to decision making; how-
low-cost mesh for groin hernia repair was only $49 (28). In ever, as decision making thresholds for cost-effectiveness have
such situations, differences in the method used to measure health remained relatively constant over time. Although we acknowledge
gain may be less important given that the major driver of results is this limitation, we are unaware of any empirical research to quantify
the low incremental cost itself. Still, this small absolute difference differences in QALY- and DALY-based ratios, and so the full impli-
may impose substantial cost for the payers when considering bud- cations of our assumptions are not known. We note that findings
get planning for the covered population, particularly if the inter- were similar when QALY- and DALY-based results were presented
vention will affect large numbers of individuals. Likewise, using common units in our NMB calculations.
depending on population size, absolute differences in CEA esti- Despite these limitations, this is the first study using published
mates using DALYs versus QALYs may have an effect on price CEAs to assess the potential relationship between QALYs and
negotiations that could have quite considerable implications. DALYs and to compare cost-effectiveness ratios with different
Our findings are consistent with those of previous studies, thresholds. We find that, although nominal differences in results
which concluded that the weight (disability weight vs. utility) are observed, conclusions of the CEAs are not likely to change
used and age-weighting functions are major drivers of differences based on the use of QALYs versus DALYs to measure health
between QALY and DALY measures (9;13). However, age- gain, when the commonly used thresholds for CE are applied.
weighting was used in only one of the included studies, suggesting Our findings should be of interest to policy makers and research-
that recent studies have adopted the 2010 guidance to remove these ers in LMICs, particularly those who may be limited to
weighting functions. The cessation of use of age-weighting was in DALY-based analyses because of constraints of resource and
response to criticisms that the practice was potentially unethical data collection costs, as well as those who do have the ability to
and discriminatory (9;33), given that age-weighting assigns higher estimate QALYs, but are concerned about the challenge of
values to young- and middle-aged adults because of their higher doing so in a climate dominated by DALY-based research.
potential for productivity. Therefore, differences in the utility
and disability weights, as well as the sources of those estimates,
Conclusions
are likely the major explanatory factors in our sample.
The conclusion about the interventions’ “acceptable” cost- Our results suggest that although QALY- and DALY-based ratios
effectiveness was only affected by the type of ratio used in one for the same intervention can differ, differences tend to be modest
case. In that case, a study-reported threshold of $679 (per QALY and are unlikely to materially affect resource allocation recom-
gained or DALY averted) was used; however, if a more common mendations. On the other hand, the modest differences may
threshold such as one time GDP per capita ($333 in this case) still affect decision making process when considered from a
had been used, the intervention would have been found to be broader perspective, including opportunity cost of other health-
cost-ineffective regardless of the type of ratio employed. With regard care interventions, budgets for healthcare spending, and price
to policy making, country- and context-specific thresholds have negotiation. Although both QALYs and DALYs can produce cost-
been suggested to decide whether an intervention is considered a effectiveness estimates that assist in healthcare decision making,
priority in healthcare planning (34). These thresholds may be further studies are warranted to better improve the methodologies
more informative in the process of decision making when one and applications of these measures to address local health needs
also considers the budget for healthcare spending, and decision and concerns.
Downloaded from https://www.cambridge.org/core. IP address: 176.9.8.24, on 02 Oct 2020 at 03:31:35, subject to the Cambridge Core terms of use, available at https://www.cambridge.org/core/terms.
https://doi.org/10.1017/S0266462320000124International Journal of Technology Assessment in Health Care 103
Supplementary Material. The supplementary material for this article can 14. Airoldi M, Morton A. Adjusting life for quality or disability: Stylistic dif-
be found at https://doi.org/10.1017/S0266462320000124. ference or substantial dispute? Health Econ. 2009;18:1237–47.
15. Diel R, Lampenius N. Cost-effectiveness analysis of interventions for
Financial Support. This study was funded by the Bill and Melinda Gates tuberculosis control: DALYs versus QALYs. Pharmacoeconomics.
Foundation (grant no. OPP1171680). 2014;32:617–26.
16. Augustovski F, Colantonio LD, Galante J, Bardach A, Caporale JE,
Conflict of Interest. Dr. Feng reports no conflict of interest. Dr. Kim reports
Zárate V, et al. Measuring the benefits of healthcare: DALYs and
grants from the Bill and Melinda Gates Foundation, during the conduct of the
QALYs–does the choice of measure matter? A case study of two preventive
study. Dr. Cohen reports grants from the Bill and Melinda Gates Foundation, interventions. Int J Health Policy Manag. 2018;7:120.
during the conduct of the study; personal fees from Precision Health
17. Neumann PJ, Thorat T, Zhong Y, Anderson J, Farquhar M, Salem M,
Economics, personal fees from Sage Therapeutics, personal fees from Merck et al. A systematic review of cost-effectiveness studies reporting
Corporation, personal fees from Abbvie, personal fees from Indivior, personal cost-per-DALY averted. PLoS One. 2016;11:e0168512.
fees from Sarepta Pharmaceuticals, outside the submitted work. Dr. Neumann
18. Neumann PJ, Thorat T, Shi J, Saret CJ, Cohen JT. The changing face of
reports advisory boards or consulting from Abbvie, Amgen, Avexis, Bayer, the cost-utility literature, 1990–2012. Value Health. 2015;18:271–7.
Congressional Budget Office, Vertex, Veritech, Janssen, Merck, Novartis,
19. Ryan M, Griffin S, Chitah B, Walker AS, Mulenga V, Kalolo D, et al.
Novo Nordisk, Precision Health Economics, funding from The CEA
The cost-effectiveness of cotrimoxazole prophylaxis in HIV-infected
Registry Sponsors by various pharmaceutical and medical device companies; children in Zambia. AIDS. 2008;22:749–57.
grants from Amgen, Lundbeck, Bill and Melinda Gates Foundation, NPC,
20. Mangen MJ, van Duynhoven YT, Vennema H, van Pelt W, Havelaar
and Alzheimer’s Association, NIH. Dr. Ollendorf reports grants from the AH, de Melker HE. Is it cost-effective to introduce rotavirus vaccination
Bill and Melinda Gates Foundation, during the conduct of the study; personal
in the Dutch national immunization program? Vaccine. 2010;28:2624–35.
fees and other from Sarepta Therapeutics, LLC, personal fees from DBV
21. Mihalopoulos C, Magnus A, Lal A, Dell L, Forbes D, Phelps A. Is imple-
Technologies, Inc., personal fees from EMD Serono, other from Gerson mentation of the 2013 Australian treatment guidelines for posttraumatic
Lehman Group, other from The CEA Registry Sponsors, personal fees from
stress disorder cost-effective compared to current practice? A cost-utility
Autolus, Inc., outside the submitted work. analysis using QALYs and DALYs. Aust N Z J Psychiatry. 2015;49:360–76.
22. Long MW, Gortmaker SL, Ward ZJ, Resch SC, Moodie ML, Sacks G,
et al. Cost effectiveness of a sugar-sweetened beverage excise tax in the
References US. Am J Prev Med. 2015;49:112–23.
1. Neumann PJ, Anderson JE, Panzer AD, Pope EF, D'Cruz BN, Kim DD, 23. Diel R, Hittel N, Schaberg T. Cost effectiveness of treating multi-drug
Cohen JT. Comparing the cost-per-QALYs gained and cost-per-DALYs resistant tuberculosis by adding Deltyba™ to background regimens in
averted literatures. Gates Open Res. 2018;2:5 (https://doi.org/10.12688/gateso- Germany. Respir Med. 202015;109:632–41.
penres.12786.2) 24. Wolfson LJ, Walker A, Hettle R, Lu X, Kambili C, Murungi A, Knerer G.
2. Center for Evaluation of Value and Risk in Health (CEVR). Global health Cost-effectiveness of adding bedaquiline to drug regimens for the treatment
cost effectiveness analysis registry. Boston, MA: CEVR, Tufts Medical of multidrug-resistant tuberculosis in the UK. PLoS One. 2015;10:e0120763.
Center, 2019. Available from: http://healtheconomics.tuftsmedicalcenter.org/ 25. Nguyen HT, Hickson RI, Kompas T, Mercer GN, Lokuge KM.
ghcearegistry/. Accessed by March 15, 2019. Strengthening tuberculosis control overseas: Who benefits? Value
3. Dicker D, Nguyen G, Abate D, Abate KH, Abay SM, Abbafati C, et al. Health. 2015;18:180–8.
Global, regional, and national age-sex-specific mortality and life expectancy, 26. Nayagam S, Conteh L, Sicuri E, Shimakawa Y, Suso P, Tamba S, et al.
1950–2017: A systematic analysis for the Global Burden of Disease Study Cost-effectiveness of community-based screening and treatment for
2017. Lancet. 2016;392:1684–735. chronic hepatitis B in The Gambia: An economic modelling analysis.
4. National Institute for Health and Care Excellence (NICE) international. Lancet Glob Health. 2016;4:e568–78.
Bill and Melinda Gates Foundation Methods for Economic Evaluation 27. Aggarwal R, Chen Q, Goel A, Seguy N, Pendse R, Ayer T, Chhatwal J.
Project. 2014. Available from: https://www.nice.org.uk/Media/Default/ Cost-effectiveness of hepatitis C treatment using generic direct-acting anti-
About/what-we-do/NICE-International/projects/Gates-Reference-case- virals available in India. PLoS One. 2017;12:e0176503.
what-it-is-how-to-use-it.pdf. Accessed by March 15, 2019. 28. Löfgren J, Matovu A, Wladis A, Ibingira C, Nordin P, Galiwango E,
5. Wilkinson T, Sculpher MJ, Claxton K, Revill P, Briggs A, Cairns JA. Forsberg BC. Cost-effectiveness of groin hernia repair from a randomized
The international decision support initiative reference case for economic clinical trial comparing commercial versus low-cost mesh in a low-income
evaluation: An aid to thought. Value Health. 2016;19:921–8. country. Br J Surg. 2017;104:695–703.
6. Chapman RH, Berger M, Weinstein MC, Weeks JC, Goldie S, 29. Vetrini D, Kiire CA, Burgess PI, Harding SP, Kayange PC, Kalua K, et al.
Neumann PJ. When does quality-adjusting life-years matter in cost- Incremental cost-effectiveness of screening and laser treatment for diabetic
effectiveness analysis? Health Econ. 2004;13:429–36. retinopathy and macular edema in Malawi. PLoS One. 2018;13:e0190742.
7. Brouwer WB, Culyer AJ, van Exel NJ. Welfarism vs. extra-welfarism. J 30. Voigt K, King NB. Disability weights in the global burden of disease 2010
Health Econ. 2008;27:325–38. study: Two steps forward, one step back? Bull World Health Organ.
8. Coast J, Smith RD, Lorgelly P. Welfarism, extra-welfarism and capability: 2014;92:226–8.
The spread of ideas in health economics. Soc Sci Med. 2008;67:1190–8. 31. Nord E. Uncertainties about disability weights for the Global Burden of
9. Gold MR, Stevenson D, Fryback DG. HALYs and QALYs and DALYs, oh Disease study. Lancet Glob Health. 2015;3:e661–2.
my: Similarities and differences in summary measures of population 32. Kim DD, Bacon RL, Neumann PJ Chapter 6: Assessing transferability
health. Annu Rev Public Health. 2002;23:115–34. of economic evaluations: A decision framework. In: Culyer A et al.,
10. Murray CJ, Acharya AK. Understanding DALYs. J Health Econ. editors. Non-communicable disease prevention: Best buys, wasted buys,
1997;16:703–30. and contestable buys. Open Book Publishers; 2019;91–117.
11. Salomon JA, Vos T, Hogan DR, Gagnon M, Naghavi M, Mokdad A, 33. Anand S, Hanson K. Disability-adjusted life years: A critical review.
et al. Common values in assessing health outcomes from disease and J Health Econ. 1997;16:685–702.
injury: Disability weights measurement study for the Global Burden of 34. Leech AA, Kim DD, Cohen JT, Neumann PJ. Use and misuse of cost-
Disease Study 2010. Lancet. 2012;380:2129–43. effectiveness analysis thresholds in low- and middle-income countries:
12. Robberstad B. QALYs vs DALYs vs LYs gained: What are the differences, Trends in cost-per-DALY studies. Value Health. 2018;21:759–61.
and what difference do they make for health care priority setting? Norsk 35. Arnold M, Griffin S, Ochalek J, Revill P, Walker S. A one stop shop for
Epidemiologi. 2005;15. https://doi.org/10.5324/nje.v15i2.217 cost-effectiveness evidence? Recommendations for improving disease con-
13. Sassi F. Calculating QALYs, comparing QALY and DALY calculations. trol priorities. Cost Eff Resour Alloc. 2019;17:7. doi: 10.1186/s12962-019-
Health Policy Plan. 2006;21:402–8. 0175-6. eCollection 2019
Downloaded from https://www.cambridge.org/core. IP address: 176.9.8.24, on 02 Oct 2020 at 03:31:35, subject to the Cambridge Core terms of use, available at https://www.cambridge.org/core/terms.
https://doi.org/10.1017/S0266462320000124You can also read