Investor Presentation November 15, 2019 - www.centerragold.com - Centerra Gold
←
→
Page content transcription
If your browser does not render page correctly, please read the page content below
Investor Presentation
November 15, 2019       TSX: CG
                        www.centerragold.com
Caution Regarding Forward-Looking Information
Information contained in this document which are not statements of historical facts, and the documents incorporated by reference herein, may be “forward-looking information” for the purposes of Canadian securities laws. Such
forward-looking information involves risks, uncertainties and other factors that could cause actual results, performance, prospects and opportunities to differ materially from those expressed or implied by such forward looking
information. The words “believe”, “expect”, “anticipate”, “contemplate”, “plan”, “intends”, “continue”, “budget”, “estimate”, “may”, “will”, “schedule”, “understand” and similar expressions identify forward-looking information.
These forward-looking statements relate to, among other things: assumptions used in the Mount Milligan impairment test, and expectations that the Kyrgyz Government will continue to comply with the terms of the Strategic
Agreement; the Company’s plans and timing for developing and submitting requests to implement a long term solution to the Mount Milligan water sufficiency issues, including consultations with potentially affected Indigenous
groups and regulators; expectations regarding the construction progress at the Öksüt Project and timing of first gold pour; the Company’s planned exploration activities for the remainder of 2019, the Company’s cash at hand,
working capital, future cash flows and existing credit facilities being sufficient to fund anticipated operating cash requirements and statements found under the heading “2019 Outlook”, including forecast 2019 production figures
and costs, capital spending (growth and sustaining) and exploration expenditures and taxes; expectations about bringing online ground water wells in December 2019 and not needing to slow production at Mount Milligan in the
first quarter of 2020 to conserve water; the continuation of higher costs at Mount Milligan over the short and medium-term and expectations that the long-term recoveries at Mount Milligan will be lower than anticipated; and the
timing of completing a mine optimization study at Mount Milligan and possible plant expansions and for publishing an updated NI 43-101 technical report for Mount Milligan; and our expectation that Mount Milligan’s mineral
reserves and resources will be materially reduced following completion of the updated NI 43-101 technical report.
Forward-looking information is necessarily based upon a number of estimates and assumptions that, while considered reasonable by Centerra, are inherently subject to significant political, business, economic and competitive
uncertainties and contingencies. Known and unknown factors could cause actual results to differ materially from those projected in the forward-looking information. Factors that could cause actual results or events to differ
materially from current expectations include, among other things: (A) strategic, legal, planning and other risks, including: political risks associated with the Company’s operations in the Kyrgyz Republic, Turkey and Canada; risks of
a decision by the Kyrgyz General Prosecutor’s Office, or its successor the Anti-Corruption Service of the State Committee for National Security, to re-open at any time civil or criminal proceedings against Centerra, its subsidiaries or
other stakeholders; the failure of the Government to comply with its continuing obligations under the Strategic Agreement, including the requirement that it comply at all times with its obligations under the Kumtor Project
Agreements, allow for the continued operation of the Kumtor Mine by KGC and KOC and not take any expropriatory action; actions by the Government or any state agency or the General Prosecutor's Office that serve to restrict or
otherwise interfere with the payment of funds by KGC and KOC to Centerra; resource nationalism including the management of external stakeholder expectations; the impact of changes in, or to the more aggressive enforcement
of, laws, regulations and government practices, including with respect to the environment, in the jurisdictions in which the Company operates including any delays or refusals to grant required permits and licenses, unjustified civil
or criminal action against the Company, its affiliates or its current or former employees; risks that community activism may result in increased contributory demands or business interruptions; the impact of any actions taken by the
Kyrgyz Government and Parliament relating to the Kumtor Project Agreements which are inconsistent with the rights of Centerra and KGC under the Kumtor Project Agreements; the risks related to other outstanding litigation
affecting the Company’s operations in the Kyrgyz Republic and elsewhere; the impact of the delay by relevant government agencies to provide required approvals, expertises and permits; potential impact on the Kumtor Project of
investigations by Kyrgyz Republic instrumentalities; the impact of constitutional changes in Turkey; the impact of any sanctions imposed by Canada, the United States or other jurisdictions against various Russian and Turkish
individuals and entities; potential defects of title in the Company’s properties that are not known as of the date hereof; the inability of the Company and its subsidiaries to enforce their legal rights in certain circumstances; the
presence of a significant shareholder that is a state-owned company of the Kyrgyz Republic; risks related to anti-corruption legislation; risks related to the concentration of assets in Central Asia; Centerra’s future exploration and
development activities not being successful; Centerra not being able to replace mineral reserves; Indigenous claims and consultative issues relating to the Company’s properties which are in proximity to Indigenous communities;
and potential risks related to kidnapping or acts of terrorism; (B) risks relating to financial matters, including: sensitivity of the Company’s business to the volatility of gold, copper and other mineral prices, the use of provisionally-
priced sales contracts for production at Mount Milligan, reliance on a few key customers for the gold-copper concentrate at Mount Milligan, use of commodity derivatives, the imprecision of the Company’s mineral reserves and
resources estimates and the assumptions they rely on, the accuracy of the Company’s production and cost estimates, the impact of restrictive covenants in the Company’s credit facilities which may, among other things, restrict the
Company from pursuing certain business activities or making distributions from its subsidiaries, the Company’s ability to obtain future financing, the impact of global financial conditions, the impact of currency fluctuations, the
effect of market conditions on the Company’s short-term investments, the Company’s ability to make payments including any payments of principal and interest on the Company’s debt facilities depends on the cash flow of its
subsidiaries; and (C) risks related to operational matters and geotechnical issues and the Company’s continued ability to successfully manage such matters, including the movement of the Davidov Glacier, waste and ice movement
and continued performance of the buttress at the Kumtor Project; the occurrence of further ground movements at the Kumtor Project and mechanical availability; the risk of having sufficient water to continue operations at Mount
Milligan and achieve expected mill throughput; the success of the Company’s future exploration and development activities, including the financial and political risks inherent in carrying out exploration activities; inherent risks
associated with the use of sodium cyanide in the mining operations; the adequacy of the Company’s insurance to mitigate operational risks; mechanical breakdowns; the Company’s ability to replace its mineral reserves; the
occurrence of any labour unrest or disturbance and the ability of the Company to successfully re-negotiate collective agreements when required; the risk that Centerra’s workforce may be exposed to widespread epidemic; seismic
activity in the vicinity of the Company’s properties; long lead times required for equipment and supplies given the remote location of some of the Company’s operating properties; reliance on a limited number of suppliers for
certain consumables, equipment and components; the Company’s ability to accurately predict decommissioning and reclamation costs; the Company’s ability to attract and retain qualified personnel; competition for mineral
acquisition opportunities; and risks associated with the conduct of joint ventures/partnerships; the Company’s ability to manage its projects effectively and to mitigate the potential lack of availability of contractors, budget and
timing overruns and project resources; risks that changes in circumstances affect the key assumptions used in, and findings of, the impairment test, including but not limited to higher than anticipated costs over the short to
medium-term and lower than anticipated recoveries at the Mount Milligan Mine; and risks that the comprehensive technical review being conducted at Mount Milligan will materially reduce the mineral reserves and resources of
Mount Milligan. See section titled “Risks that can affect our business” in the Company’s most recently filed Annual Information Form available on SEDAR at www.sedar.com.
Furthermore, market price fluctuations in gold and copper, as well as increased capital or production costs or reduced recovery rates may render ore reserves containing lower grades of mineralization uneconomic and may
ultimately result in a restatement of reserves. The extent to which resources may ultimately be reclassified as proven or probable reserves is dependent upon the demonstration of their profitable recovery. Economic and
technological factors which may change over time always influence the evaluation of reserves or resources. Centerra has not adjusted mineral resource figures in consideration of these risks and, therefore, Centerra can give no
assurances that any mineral resource estimate will ultimately be reclassified as proven and probable reserves.
There can be no assurances that forward-looking information and statements will prove to be accurate, as many factors and future events, both known and unknown could cause actual results, performance or achievements to vary
or differ materially, from the results, performance or achievements that are or may be expressed or implied by such forward-looking statements contained herein or incorporated by reference. Accordingly, all such factors should be
considered carefully when making decisions with respect to Centerra, and prospective investors should not place undue reliance on forward looking information. Forward-looking information is as of November 15, 2019. Centerra
assumes no obligation to update or revise forward looking information to reflect changes in assumptions, changes in circumstances or any other events affecting such forward-looking information, except as required by applicable
law. Except as otherwise noted herein, Gordon Reid, Professional Engineer and Centerra’s Vice President and Chief Operating Officer, has reviewed and approved the scientific and technical information contained in this
presentation. Mr. Reid is a Qualified Person within the meaning of NI 43-101. For more information, please refer to the properties technical reports, which are available on SEDAR. All figures are in United States dollars unless
otherwise stated.
November 2019                                                                                                                                                                                                                                 2
Centerra: Built For Success
                                       Corporate Highlights                                                                                           Consensus Asset NAV Breakdown
                                                                                                                                                                                     U.S.
                  2018 actual gold production 730koz, copper production                                                                                                              2%
                                                                                                                                                                   Turkey
                  47Mlbs, at AISC1 of $754 per ounce                                                                                                                10%

                  2018 Portfolio optimization2:
                  • Sold royalty assets for $155MM;
                  • Sold silver stream on Kemess Project for $45MM
                  • Sold Mongolian business unit for $35MM                                                                                                                                                          Canada
                                                                                                                                                        Kyrgyz
                                                                                                                                                                                                                     54%
                                                                                                                                                       Republic
                                                                                                                                                         34%
                  2019 estimated gold production up to 765koz, copper
                  production up to 75Mlbs, AISC1 of $713-to-$743 per ounce

                  Öksüt construction 79% complete                                                                                                     Profitably Growing Gold Production
                  First gold pour expected January, 2020

                  Progressing two advanced stage growth projects in Canada
                                                                                                                                              1,000
                                                                                                                             Ounces (000’s)

                  Cash balance3 of $81MM

                  Total liquidity3 of $655MM
                                                                                                                                                 0
                                                                                                                                                      Kumtor      Mt Milligan        Oksut         Kemess UG        Greenstone        Total
 1.   All-in sustaining costs per ounce sold (AISC) is a non-GAAP measure discussed under “Non-GAAP Measures” in the Company’s most recent MD&A & News Release October 30, 2019. 2018 AISC: Kumtor $694/oz, Mount Milligan $764/oz.
      2019e AISC: Kumtor $635 to $685/oz, Mount Milligan $727 to $821/oz see MD&A and News Release October 30, 2019.
 2.   Refer to Company’s news releases May 17, 2018, June 27, 2018 and October 12, 2018.
 3.   As at September 30, 2019.

November 2019                                                                                                                                                                                                                                 3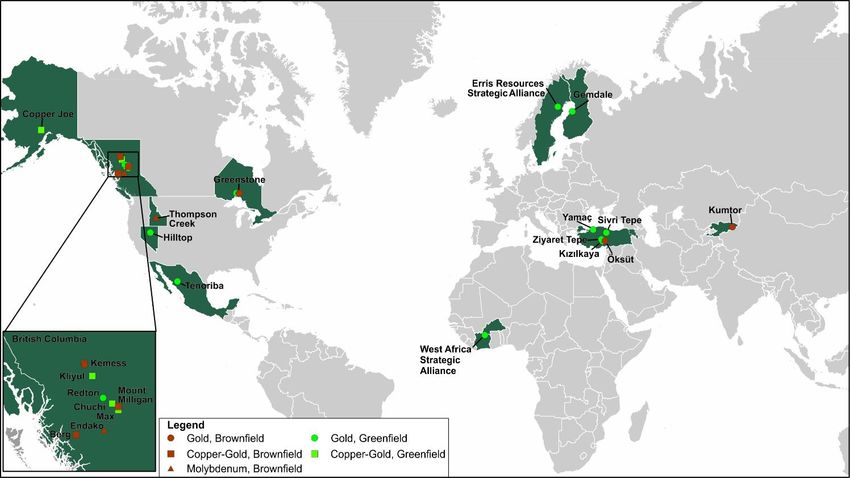
Centerra: Q3-2019 ESG Operations Update

                                Highlights

                Operations achieved lost time injury free milestones

                Continued focus on safety leadership training/awareness

                Maintained and strengthened our “Social Licence to
                Operate” at all operations with no interruptions for ~75
                months

                No reportable environmental incidents

                                                                            Total Recordable Injury Frequency Rate
                OMAS (Öksüt) successfully completed audit in September
                2019 maintaining full compliance with European Bank for
                Reconstruction and Development (EBRD) and                           0.47
                International Finance Corporation (IFC) E&S requirements

                                                                                                       0.28
                Committed to Company-wide conformance to the World
                Gold Council’s Responsible Gold Mining Principles

                Commenced a 2019 ESG Issues Assessment – a key part
                of our 2020 sustainability strategy and reporting process
                                                                                   YTD 2018           YTD 2019

November 2019                                                                                                        4
Centerra: Committed to Responsible Gold Mining

        •       Centerra will be implementing the World Gold
                Council’s Responsible Gold Mining Principles
                (RGMP) across our operations

        •       RGMP was designed to provide confidence to
                our investors and supply chain participants that
                our gold has been produced responsibly

        •       In April 2019, Kumtor participated in a ‘pilot
                walk through’ of the RGMP

                  •   No major gaps or non-compliances were
                      identified during the ‘soft’ assurance
                      process

        •       In 2019, Centerra will form a working group at
                Kumtor to set-out a path towards full RGMP
                compliance

        •       In 2020, Centerra will develop working plans
                across all operating sites to achieve RGMP
                compliance company-wide

November 2019                                                      5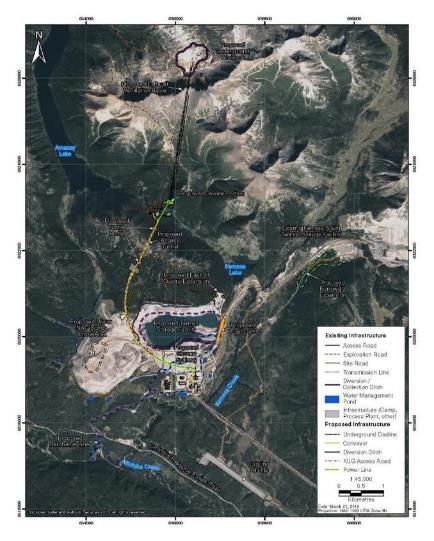
Centerra: Q3-2019 Corporate Highlights
Safety – Öksüt and Mount Milligan Achieved 1 million Work Hours LTI Free, and Kumtor Achieved
1-year and Endako Achieved 6-years Without a Lost Time Injury
Completed KR Strategic Agreement August 26, 2019 (Cash Payment of $62.6MM)
Construction of Öksüt Project Approximately 79% Complete, First Gold Expected January 2020
Q3 2019 Consolidated Gold Production of 205,660 Ounces and
Copper Production of 21.2 Million Pounds
Centerra’s Q3 2019 All-In Sustaining Cost1 on a By-product Basis $666 Per Ounce Sold
Reduced Carrying Value of Mount Milligan to $523MM (Impairment Charge of $231MM)
Q3 2019 Net Loss of $165MM or Adjusted Earnings1 of $75MM or $0.26 Per Share (basic)
Cash Provided by Operations of $32MM ($0.11 per share)
Adjusted Cash Provided by Operations1 of $95MM ($0.32 per share)
Adjusted Free Cash Flow1 $10MM (Includes $42MM from Kumtor and $31MM from Mt. Milligan)
September 30, 2019 Cash Balance $81MM and Total Liquidity $655MM
Increased 2019 Gold Production Guidance by 3% to 748,000 Ounces (mid-point) and
Gold Sales Guidance by 5% to 765,000 Ounces (mid-point)
1. Non-GAAP measure and is discussed under “Non-GAAP Measures” in the Company’s MD&A and News Release October 30, 2019.
November 2019 6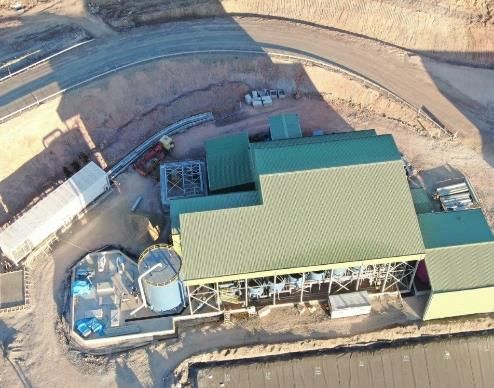
Centerra: Delivering Results Operations vs. Guidance
Centerra has a strong track record of beating both production and AISC2 guidance
Operating Statistics vs. Guidance (mid-point) (koz Au)
795 785
748
730
715
691 685
660
625 621
Guidance (mid-point) 537 540 551
520
Revised Guidance (mid-point)
Actual Production
1
2013 2014 2015 2016 2017 2018 2019F
Gold Production
Guidance (mid-point) (koz) 660 625 520 540 795 685 748
Actual (koz) 691 621 537 551 785 730 NA
Difference 4.7% -0.6% 3.3% 2.0% -1.3% 6.6% NA
All-In Sustaining Cost2
Guidance (mid-point) (US$/oz Au) 878 863 851 744 723 805 728
Actual (US$/oz Au) 818 852 814 692 688 754 NA
Difference (6.8%) (1.3%) (4.3%) (7.0%) (4.8%) (6.3%) NA
(1) 2016 statistics and guidance excludes Mount Milligan (transaction closed in October 2016).
(2) Non-GAAP measure discussed under “Non-GAAP Measures” in the Company’s MD&A and News Release October 30, 2019.
November 2019 7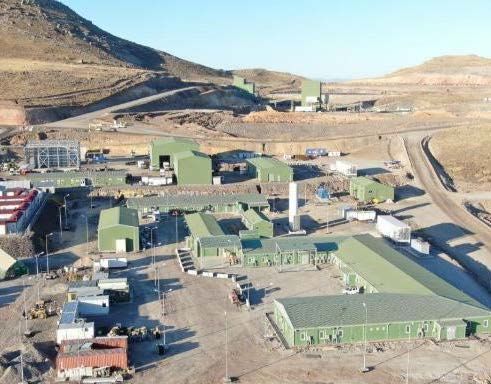
Centerra: Q3-2019 Corporate Update
YTD 2019 Cash Flow (US$MM’s) Liquidity Profile Sept. 30, 2019 (US$MM’s)
450
249 90
400 500
350
63
300
58
250
US$655MM
200 109
152
150
100 81
81 74
50
0 1 1
2018 YE Cash Kumtor + 5 Debt KR Settlement Oksut Spend Dev Projects, Q3 2019 Cash
2 3 3
MTM Adj FCF Repayments Expense G&A & Other Cash Reserves Corporate Credit Facility Oksut Credit Facility
Cash and Debt Profile4 (US$MM’s) Retained Earnings Profile (US$)
600
1,600 2,000
505
500 1,400
409 417 1,600
1,200
400
Gold Price (US$/oz)
US$ Millions
298 1,000 1,200
300
US$ Millions
800
193 180
200 152 171 600 800
140
103 104
81 400
100 400
200
0 2 0 0
Dec31 2016 Dec31 2017 Dec31 2018 Mar31 2019 Jun30 2019 Sep30 2019 2004 2005 2006 2007 2008 2009 2010 2011 2012 2013 2014 2015 2016 2017 2018 Q3
2019
Total Debt Cash Retained Earnings Cumulative Dividends Gold Price
1
Includes cash and cash equivalents, short-term investments and excludes $27.5MM restricted cash at December 31, 2018 and $28.6MM restricted cash at September 30, 2019.
2
Represents the Company’s cash position at September30, 2019, excluding $28.6MM restricted cash.
3
Undrawn amounts of the $150MM Öksüt credit facility & the $500MM corporate credit facility as at September 30, 2019.
4
Excludes leases.
November 2019 5
Non-GAAP measure see MD&A and news release October 30, 2019. 8
Centerra: AISC1 Comparison
                             H1 2019 AISC1 (US$/oz)                                                                                        YoY Change in AISC1 (%)

          Kirkland Lake                                    $597                                                                Centerra           (27%)

                   Alacer                                       $692                                                      Kirkland Lake            (25%)

                Centerra                                         $705                                                             Alacer                    (11%)

             Endeavour                                                 $826                                                   New Gold                       (10%)

                  B2Gold                                                 $882                                                    Alamos                            (3%)

                  Kinross                                                  $925                                                 Yamana                             (2%)

                Yamana                                                      $936                                            SSR Mining                               (1%)

               Centamin                                                     $940                                                 Kinross                             (0%)

                 Alamos                                                     $941                                              Centamin                                         1%

                Eldorado                                                      $977                                               Detour                                            2%

            OceanaGold                                                             $1,073                                     IAMGOLD                                                   10%

               New Gold                                                            $1,085                                      Eldorado                                                 10%

                  Detour                                                           $1,093                                    Endeavour                                                   13%

              IAMGOLD                                                                $1,109                                      B2Gold                                                       20%

             SSR Mining                                                              $1,111                                OceanaGold                                                               44%

Source: Corporate disclosure
1 AISC is presented on a co-product basis where applicable and is a Non-GAAP measure refer to “Non-GAAP Measures” in the Company’s MD&A and News Release dated October 30, 2019.
November 2019                                                                                                                                                                                             9
Centerra: Low-Cost Asset Base
Positioned to generate free cash flow through the price cycles
AISC Industry Curve (By-P roduct Basis)
$2,500
25% 50% 75% 100%
$2,250
$2,000
Centerra Gold
AISC, net (US$/oz Au)
$1,750 (US$713-743/oz Au)
Kemess Underground
$1,500 (US$244/oz)(1)
Kumtor
$1,250 (US$635-685/oz)
Mount Milligan
(US$727-821/oz)
$1,000 Greenstone
(US$600/oz)(3)
$750 Öksüt
(US$490/oz)(2)
$500
$250
$0
730 9,100 16,008 23,666 30,082 36,417 39,898 42,962
Source: SNL Metals. Cumulative Gold Production (koz Au)
Notes: Centerra AISC figures (Non-GAAP measure) based on 2019 cost guidance, unless noted below, see MD&A and News Release October 30, 2019.
1. Kemess Underground AISC based on LOM plan as per National Instrument 43-101 technical report dated July 12, 2017 for Kemess Underground and Kemess East available in the AuRico Metals filings on SEDAR.
2. Öksüt AISC based on LOM plan as per the NI 43-101 Technical Report On The Öksüt Gold Project, Turkey dated September 3, 2015.
3. Greenstone AISC based on LOM plan as per the NI 43-101 Technical Report on the Hardrock Project dated December 21, 2016.
November 2019 10Centerra: Compelling Valuation
P / NAVPS (x) P / 2019E CFPS (x) P / 2019E Earnings (x)
Kirkland Lake 2.04x Centamin 11.4x Eldorado 49.2x
B2Gold 1.23x Kirkland Lake 11.3x
Yamana 34.9x
Yamana 1.17x SSR Mining 10.3x
Endeavour 30.7x
SSR Mining 1.17x Coeur 9.7x
Detour 29.5x
Centamin 1.12x Detour 8.4x
Endeavour 1.12x Pretium 8.4x OceanaGold 27.2x
Coeur 1.08x Alamos 8.0x
Alamos 26.0x
Centerra 0.96x Eldorado 7.4x
Centamin 24.2x
OceanaGold 0.96x B2Gold 7.3x
SSR Mining 22.3x
Pretium 0.88x OceanaGold 7.2x
New Gold 0.86x Endeavour 6.8x Pretium 18.4x
Detour 0.82x IAMGOLD 6.3x
Kirkland Lake 17.5x
Torex 0.73x Yamana 6.2x
Torex 16.1x
Alamos 0.70x Centerra 5.6x
B2Gold 16.0x
Eldorado 0.66x Torex 4.3x
IAMGOLD 0.64x New Gold 2.8x Centerra 14.0x
Source: Bloomberg; Capital IQ; Street consensus
Note: As at September 30, 2019
November 2019 11Centerra: Leading Capital Efficiency and Profitability
L3Y Return on Invested Capital (%) L3Y Return on Capital (%) L3Y Return on Equity (%)
Kirkland Lake 18% Kirkland Lake 20% Kirkland Lake 21%
Centamin 13% Centamin 13% Centerra 10%
Centerra 9% Centerra 9% OceanaGold 10%
OceanaGold 9% OceanaGold 8% B2Gold 7%
B2Gold 6% SSR Mining 6% Alacer 7%
Alacer 5% B2Gold 6% SSR Mining 6%
SSR Mining 5% Alacer 5% Kinross 4%
Detour 4% Kinross 4% Centamin 4%
Kinross 3% Detour 4% Detour 3%
Yamana 2% Endeavour 3% Yamana 2%
Endeavour 2% New Gold 2% Endeavour 2%
New Gold 2% Yamana 2% New Gold 1%
Alamos 1% IAMGOLD 1% IAMGOLD 1%
IAMGOLD 1% Alamos 1% Alamos 1%
Eldorado (0%) Eldorado (0%) Eldorado 0%
Source: Bloomberg as per latest financials
November 2019 12Kumtor: World Class Open Pit Gold Mine
2019E
2016 2017 2018 Revised
Guidance
Gold Production (koz) 551 563 535 575-590
All-In Sustaining Costs
$640 $698 $694 $635-$685
($/oz) (1)
Sustaining Capital ($MM)(1) $61 $61 $44 $45
Growth Capital ($MM)(1) $15 $18 $17 $20
Reserves(2) (Moz) 4.0
Au Grade (g/t) 2.4
Resources M&I(2) (Moz) 3.0
Au Grade (g/t) 2.9
World Class Cornerstone Asset Significant Open Pit Gold Production
Strategic Agreement – Completed August 26, 2019 650,000 4.50
4.00
YTD 2019 generated $199MM adjusted free cash flow1
3.50
240 240 500,000
Revised gold production guidanceU/Gtominers
575-590U/Gkoz
miners
3.00
grade g/t
Ounces
207 2.50
22 years YE
oftarget
uninterrupted
of profitable production
U/G miners
350,000
4,000tpd
2.00
170opportunity (inferred 3.4Moz @ 7.3 g/t)2
Underground
U/G miners 1.50
200,000 1.00
Strong stable platform to grow Centerra
2014 2015 2016 2017 2018 2019 2020 2021 2022
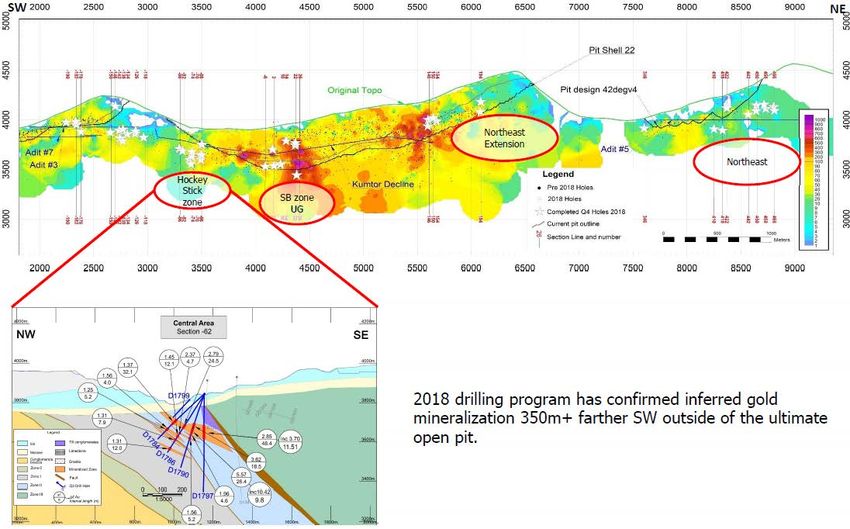
November 20191) Non-GAAP measure and is discussed under “Non-GAAP Measures” in the Company’s MD&A and News Release October 30, 2019. (2) Refer to February 22, 2019 mineral reserves and resources news release.13Kumtor: 2019 Exploration
Boris Kotlyar, a Member with the American Institute of Professional Geologists, is Centerra’s qualified person for the purpose of National Instrument 43-101.
November 2019 14Mount Milligan: Long Life, Low Cost Gold Copper Mine
2019E
2016 2017 2018
Guidance
Gold Production (koz) 205 223 195 155-175
Copper Production (Mlbs) 59 54 47 65-75
All-In Sustaining Costs
$509 $505 $764 $727-$821
(US$/oz)(1)
Sustaining Capital ($MM)(1) NA $30 $43 $45
Gold Copper
35% @ 18.75% @ 15% of
Royal Gold Stream
US$435/oz spot Cu price
Significant Open Pit Gold and Copper Production Significant Gold and Copper Production
Low cost, long life production 250 80
223 70
205 70
195 59
1 200
YTD 2019 generated $51MM free cash flow 54 60
Gold ounces (000’s)
165
47
M lbs
150 50
Stable, mining-friendly jurisdiction 40
Copper
100 30
Exploration potential 20
50
10
Tax loss pools, no cash taxes until 2022/2023 0 0
2016 2017 2018 2019E 2016 2017 2018 2019E
GOLD COPPER
(1) Non-GAAP measure and is discussed under “Non-GAAP Measures” in the Company’s MD&A and News Release October 30, 2019. 2016 AISC is for the period Oct.20 to Dec.31, 2016.
November 2019 15Öksüt: 2019 Construction Update
Admin Offices and Crushing Area Keltepe Pit Mining Heap Leach Pads 1A and 1B
Heap Leach Pad Piping Heap Leach Pad 1A+1B Overliner ADR Plant
November 2019 16Öksüt: Funded High Margin Gold Production
Project Highlights
Mine Type Open Pit, Heap Leach
Avg. LOM Annual Production 110koz Au
Avg. LOM AISC(1) (US$/oz) $490
Development Capex (US$MM) $200
P&P Reserves(2)(Moz) 1.3
Öksüt Gold
Au grade (g/t)(2) 1.4 Project
Life of Mine Strip Ratio (w:o) 2:1
Construction Completion 79%
First Gold Pour January-2020
Catalyst Schedule Profitably Growing Gold Production
Construction on track for January 2020 gold pour
Total construction capital $200MM
1,000
EIA approval received in November 2015
Ounces (000’s)
Forestry Permit & GSM License received July 2016
Pastureland Permit & Investment Incentive Certificate
received in January & February 2018
Bought back Stratex and Teck royalties in 2015 & 2016
0
US$150MM low-cost financing in-place Kumtor Mt Milligan Oksut Kemess UG Greenstone Total
(1) Non-GAAP measure see “Non-GAAP Measures” in the Company’s MD&A and News Release of October 30, 2019.
November 2019 (2) Refer to February 8, 2018 news release and Technical Report on Öksüt Gold Project dated September 3, 2015. 17Kemess: C$1Billion of Infrastructure
Fly-in, Fly-out Work Camp Permitted Open Pit Tailings Storage Facility
Metallurgical Facility Kemess Proximity to Mount Milligan
Kwadacha Kemess Project
(Fort Ware)
Kemess Omineca Resource
Project Tsay Keh Access Road
Forest Service Road
0 100 200
Kilometres
Dawson Creek
Takla
Landing Mackenzie
Mount Milligan
Terrace Smithers
Fort
St. James
Prince Endako Prince George
Rupert
November 2019 18Kemess: Large, Low-Cost Production
Kemess Underground – 2016 Feasibility Highlights(1) Kemess East– 2017 PEA Highlights(1)
Mine Type Underground Block Cave Mine Type Underground Panel Cave
Avg. LOM Gold Production (koz) 106 Avg. LOM Gold Production (koz) 80
Avg. LOM By-Product AISC (US$/oz)(2) $244 Avg. LOM By-Product AISC (US$/oz)(2) ($69)
Development Capex (C$MM)(3) C$604 Development Capex (C$MM) C$327
P&P Au Reserves (Moz)(4) 1.9 M&I Au Resource (Moz)(5) 2.3
P&P Au Reserve Grade (g/t) 0.5 M&I Au Grade (g/t) 0.4
P&P Cu Reserves (Mlbs)(4) 630 M&I Cu Resource (Mlbs)(5) 1,410
P&P Cu Reserve Grade (%) 0.266% M&I Cu Grade (%) 0.360%
After-tax NPV5% (C$MM) C$258 After-tax NPV5% (C$MM) C$375
KUG Gold and Copper Production(1) KE Gold and Copper Production(1)
160 80 160 80
Copper (Mlbs)
120 60 Copper (Mlbs)
120 60
Gold (koz)
Gold (koz)
80 40 80 40
40 20 40 20
-- -- -- 0
Y-2 Y-1 Y1 Y2 Y3 Y4 Y5 Y6 Y7 Y8 Y9 Y10 Y11 Y12 Y13 Y4 Y5 Y6 Y7 Y8 Y9 Y10 Y11 Y12 Y13 Y14 Y15 Y16 Y17
Project Schedule Year Project Schedule Year
Au Cu Au Cu
(1) Refer to National Instrument 43-101 technical report dated July 12, 2017 Technical Report for the Kemess Underground and Kemess East Project, British Columbia, Canada, available in the AuRico Metals filings on SEDAR.
A preliminary economic assessment (PEA) is preliminary in nature and includes inferred mineral resources that are considered too speculative geologically to have the economic considerations applied to them that would
enable them to be categorized as mineral reserves, and there is no certainty that the PEA will be realized.
(2) AISC is a Non-GAAP measure, see MD&A and News Release October 30, 2019
(3) Includes pre-commercial net revenue and capitalized pre-production operating expenditures.
(4) Kemess Underground reserves are estimated using a gold price of $1,250 per ounce, copper price of $3.00 per pound, an exchange rate of 1USD:1.25CAD and an NSR cut-off of C$17.30 per tonne.
(5) Kemess East resources are estimated using a gold price of $1,475 per ounce, copper price of $3.50 per pound, an exchange rate of 1USD:1.25CAD and an NSR cut-off of C$17.30 per tonne.
November 2019 19Greenstone: One of Canada’s Largest Undeveloped Open Pit Gold Mines
Cornerstone Canadian Development Project Ontario: Top Tier Mining Jurisdiction
50:50 development partnership with Premier Gold
Greenstone Development Project
Open pit reserves(1) 4.7Moz Au @ 1.02 g/t (100%) Location: Ontario, Canada
Significant historic gold production of 4.12M oz (~1934-1970)
Large land package covers 337km2, good infrastructure
Brookbank Deposit
Significant exploration and underground resource potential
Greenstone Gold Geraldton
Property
2017 final EIS/EA filed, mine permitting and IBA work underway Hardrock Deposit
Beardmore
Beardmore – Geraldton Greenstone Belt +110 km
2018/2019 Federal and Provincial EA approval, 2 IBA’s signed
2016 Feasibility Highlights (100%) Projected Gold Production (100%)
Mine Type Open Pit, CIP Mill
Mill Throughput design 27,000 tpd
Avg. LOM Annual Production 288koz Au
Avg. LOM AISC(2) (US$/oz) $600
Development Capex (US$MM) $962
P&P Reserves(1)(Moz) 4.7
Au grade (g/t) 1.02
Life of Mine Recovery 90%
Life of Mine Strip Ratio (w:o) 3.87:1
NPV(5%) - after tax (US$MM) $545
IRR - after tax 14.4%
November 2019 (1) See Technical Report on the Hardrock Project dated December 21, 2016. (2) Non-GAAP measure, see “Non-GAAP Measures” in Company’s MD&A and News Release October 30, 2019. 20Centerra: Potential Upside Optionality - Molybdenum
Molybdenum Price Movement Thompson Creek Mine
● Located in Idaho, is the world’s fourth largest open-pit primary
14.0 molybdenum mine
13.0
● Operations began in 1983, using conventional open-pit mining and a on-
12.0 site 25,500 tpd mill
11.0
● In December, 2014 placed on care and maintenance
10.0 $10.55
Endako Mine
$ USD per Pound
9.0
8.0
● Endako Mine is a fully integrated molybdenum facility located in BC
$7.02
7.0 ● TCM is the operator and 75% owner; Sojitz owns 25%
6.0 ● Endako consists of three adjoined pits and a fully integrated operation
5.0 with on-site mill and multiple hearth roasting facility
4.0 ● New 55,000 tpd processing facility was completed in 2012 for~US$500MM
Jan-19
Jan-17
Jan-18
Sep-17
Sep-18
Sep-19
Nov-18
Mar-19
May-19
Nov-16
Mar-17
May-17
Nov-17
Mar-18
May-18
Oct-16
Aug-17
Oct-17
Aug-18
Oct-18
Aug-19
Oct-19
Jul-18
Dec-18
Apr-19
Jul-19
Dec-16
Apr-17
Jul-17
Dec-17
Apr-18
Feb-19
Jun-19
Feb-17
Jun-17
Feb-18
Jun-18
● In July 2015 placed on care and maintenance
Historical Molybdenum Segment EBITDA(1) Langeloth Metallurgical Facility
(US$MM) ● Located 40 km west of Pittsburgh, Pennsylvania
$444
● Operates both as a toll processor and as a purchaser of molybdenum
$269 $265 concentrates from third parties, producing a suite of premium
$126 $126 $124
molybdenum products
$18 ● Cash flows from the Langeloth operations are not sufficient to cover the
($21) $13 to $15 million in care and maintenance expenses associated with the
2008 2009 2010 2011 2012 2013 2014 2015
molybdenum mines
(1) Prior to intersegment eliminations. Historical EBITDA not reported, therefore calculated based on historical segment disclosure from Thompson Creek Metals Company Inc. public filings.
November 2019 21Appendix TSX: CG
www.centerragold.comCenterra: 2019 Exploration - Map of Projects
2016A 2017A 2018A 2019E
Exploration spending ($MM) $11 $13 $21 $30
November 2019 23Centerra: 2019 Production, AISC1, and Other Guidance3
September 2019 FY 2019 FY 2019
Consolidated
YTD Actuals New Guidance Prior Guidance
Gold Production in Koz 589 Koz 730 - 765 Koz 705 - 750 Koz
Kumtor 452 Koz 575 - 590 Koz 550 - 575 Koz
MTM 137 Koz 155 - 175 Koz 155 - 175 Koz
Copper Production in Mlb 53 Mlb 65 - 75 Mlb 65 - 75 Mlb
Gold Sales in Koz 611 Koz 745 - 785 Koz 705 - 750 Koz
Kumtor 464 Koz 590 - 610 Koz 550 - 575 Koz
MTM 147 Koz 155 - 175 Koz 155 - 175 Koz
AISC per ounce sold (by-product basis) (1) $683/Oz $713 - $743 $713 - $743
Kumtor 581/Oz 635 - 685 635 - 685
MTM 763/Oz 727 - 821 727 - 821
Molybdenum Business Unit ($M) (2)
Care and Maintenance 10 13 - 15 13 - 15
Financing Cost ($M) 11 16 - 18 16 - 18
Assumptions
Gold Price - $/oz 1,344 1,375 1,300
Copper Price - $/lbs 2.80 2.60 2.70
Molybdenum Price - $/lbs 11.93 12.00 12.00
1. Non-GAAP measure and is discussed under “Non-GAAP Measures” in the Company’s MD&A and News Release October 30, 2019.
2. Guidance of $3.0 million for Selling & Administration and $10 million for Depreciation.
3. See Assumptions and Risks and Caution Regarding Forward-Looking Information in the Company’s MD&A and News Release October 30, 2019.
November 2019 24Centerra: 2019 Capex and Depreciation Guidance1
Sept. 2019 FY 2019 FY 2019
(US $MM)
YTD Actuals New Guidance Prior Guidance
Total Capital, excluding capitalized stripping $172 $260 $275
Sustaining Capex 62 100 100
Kumtor 31 45 45
Mount Milligan 27 45 45
Others (Thompson Creek Mine, Endako Mine (75%),
4 10 10
Langeloth facility and Corporate)
Growth Capex 110 160 175
Kumtor 13 20 20
Öksüt - Capitalized Costs 59 85 100
Kemess UG 26 35 35
Greenstone - Capitalized Costs 12 20 20
Capitalized Stripping (Kumtor) 62 125 140
Cash 48 100 110
Non-Cash 14 25 30
Depreciation, Depletion, and Amortization 180 240 - 260 240 - 260
Kumtor 135 190 - 200 190 - 200
Mount Milligan 42 38 - 45 38 - 45
Langeloth and other properties 3 12 - 15 12 - 15
1. See Assumptions and Risks and Caution Regarding Forward-Looking Information in the Company’s MD&A and News Release October 30, 2019.
November 2019 25Centerra: Q3-2019 Operating Highlights
Significant safety milestones achieved at the various operating sites
Q3 2019 gold production - Kumtor 150,305 ounces, Mount Milligan 55,355 ounces
Q3 2019 copper production - Mount Milligan 21,229,000 pounds
Mount Milligan throughput 55,727 tonnes per calendar day (60,455 tonnes per operating day)
On track for throughput to average 55,000 tonnes per calendar day in second half of year
Kumtor increased gold production guidance to 575,000 – 590,000 ounces
Company-wide gold production guidance increased to 730,000 – 765,000 ounces
Öksüt Project construction advancing; approximately 79% complete
First gold pour on track for January 2020
Mount Milligan reduced carrying value to $523 million (Q3 2019 impairment of $230.5 million)
Q3 2019 Q3 2018
Gold ounces produced(1) 205,660 181,243
Copper produced (000’s payable lbs)(1) 21,229 12,704
Kumtor All-in Sustaining Costs per ounce sold(2) $626 $662
Mount Milligan All-in Sustaining Costs on a by-product basis per ounce sold(1),(2) $557 $677
Consolidated All-in Sustaining Costs on a by-product basis per ounce sold(1),(2) $666 $698
1. Includes Mount Milligan production on a 100% basis.
2. Non-GAAP measure and is discussed under “Non-GAAP Measures” in the Company’s MD&A and News Release dated October 30, 2019.
November 2019 26Centerra: Q3-2019 Financial Highlights1
Quarter Ended Quarter Ended
(in thousands, except ounces, per share amounts, and average realized price2) Sept.30, 2019 Sept.30, 2018
Revenue $388,276 $259,099
Total gold ounces sold 216,023 166,716
Total copper pounds sold (000’s) 21,907 13,605
Cash provided by operations $31,854 $37,569
Adjusted cash provided by operations(2) $94,500 $37,569
Net earnings (loss) $(165,111) $5,992
Adjusted earnings(2) $75,400 $14,500
Adjusted earnings per share(2), basic $0.26 $0.05
Average realized gold price per ounce(2) $1,374 $1,125
Average realized copper price per pound(2) $1.89 $2.01
1. U.S. dollars
2. Non-GAAP measure and is discussed under “Non-GAAP Measures” in the Company’s MD&A and News Release dated October 30, 2019.
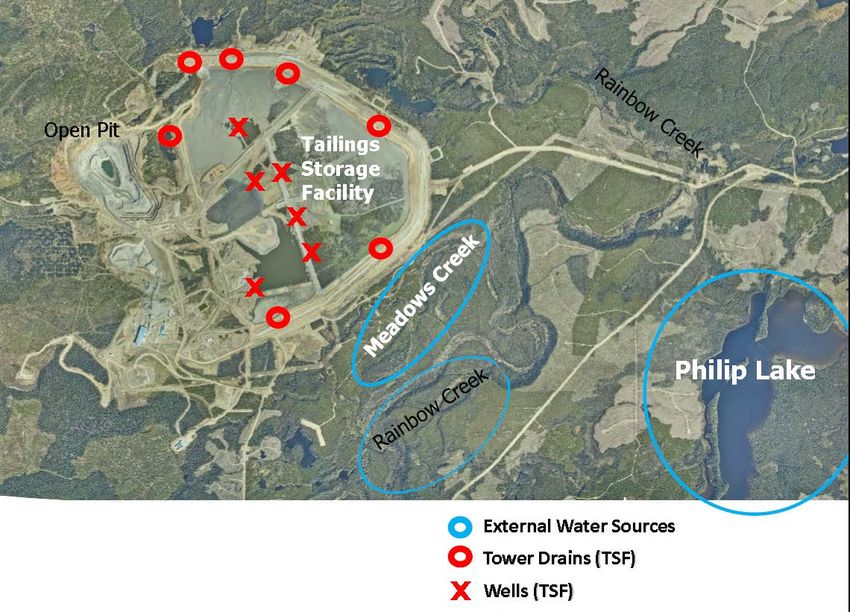
November 2019 27Mount Milligan: Short & Medium-term Water Sources November 2019 28
Kemess: De-Risked Brownfield Project(1)
  •        Established mining jurisdiction
                                                                                                                                                                  Kwadacha                              Kemess Project
  •
                                                                                                                                                                  (Fort Ware)
           Advanced-stage                                                                                                              Kemess                                                           Omineca Resource
                                                                                                                                       Project                        Tsay Keh                          Access Road
            − EA Approved, IBA in hand, Amended Mines Act                                                                                                                                               Forest Service Road
               Permit (construction permit) received, Effluent                                                                                                                                      0           100        200
               Discharge and Air Emissions Permit received, FS                                                                                                                                               Kilometers
                                                                                                                                                                                                                Dawson Creek
               complete                                                                                                                                Takla
                                                                                                                                                       Landing                          Mackenzie

  •        Low-risk brownfield development
                                                                                                                                                                 Mount Milligan

                                                                                                                                  Terrace
  •
                                                                                                                                            Smithers
           C$1 billion of existing infrastructure                                                                                                                               Fort
                                                                                                                                                                                St. James
                                                                                                                         Prince                   Endako                                     Prince George
            − 25,000 tpd mill, road, power, tailings, rail load-out,                                                     Rupert

               camp, airstrip
  •        Sizeable resource1
            − Kemess Underground(2): P&P of 1.9Moz gold and
                0.6Blbs copper and M&I (including P&P) of 3.6Moz
                gold and 1.3Blbs copper                                                                                                         Expected Catalyst Schedule
            − Kemess East(3): M&I of 2.3Moz Au and 1.4Blbs Cu                                                          Kemess Underground EA Approval                                           Received – Q1 2017
                                                                                                                       First Nations IBA                                                        Received – Q2 2017
  •        Long life
                                                                                                                       Kemess Underground Permit                                               Received – July 2018
            − 12 years at Kemess Underground plus a further
               12 years at Kemess East, with exploration upside                                                        Effluent Discharge Permit                                            Received – September 2018
                                                                                                                       Air Emissions Permit                                                    Received – April 2019
  •        Highly marketable clean concentrate
(1)   Refer to National Instrument 43-101 technical report dated July 12, 2017 Technical Report for the Kemess Underground and Kemess East Project, British Columbia, Canada, available in the AuRico Metals filings on SEDAR.
      Kemess East Project (KE) preliminary economic assessment (PEA) is preliminary in nature and includes inferred mineral resources that are considered too speculative geologically to have the economic considerations applied
      to them that would enable them to be categorized as mineral reserves, and there is no certainty that the PEA will be realized.
(2)   Kemess Underground P&P reserves are estimated using a gold price of $1,250 per ounce, copper price of $3.00 per pound, an exchange rate of 1USD:1.25CAD and an NSR cut-off of C$17.30 per tonne.
      M&I resources are estimated using a gold price of $1,450 per ounce, copper price of $3.50 per pound, an exchange rate of 1USD:1.25CAD and an NSR cut-off of C$15.00 per tonne.
(3)   Kemess East resources are estimated using a gold price of $1,450 per ounce, copper price of $3.50 per pound, an exchange rate of 1USD:1.25CAD and an NSR cut-off of C$17.30 per tonne.
November 2019                                                                                                                                                                                                                    29
Kemess: Overview
Kemess Underground (Feasibility – 2016)(1)
• Reserves of 1.9Moz Au and 0.6Blbs Cu(2)
• LOM of 12 years at 106koz Au/p.a. and 47Mlbs/p.a. at
AISC(3) of $244/oz on a by-product basis
• Environmental approvals and IBA received
• Received Mines Act Permit (construction permit)
• Received Effluent Discharge Permit
• Received Air Emissions Permit
Kemess East (PEA – May 2017)(1)
• M&I resources of 1.7Moz and 1.4Blbs Cu(2)
• LOM of 12 years at 80koz Au/p.a. and 57Mlbs/p.a. at
AISC(3) of (US$69/oz) on a by-product basis
Kemess South (Past Producer: 1998 – 2011)
• ~C$1 billion of infrastructure in-place (including a 25,000
tpd mill, grid power, road, maintenance shop, etc.)
• Past production of 3.0Moz Au and 750Mlbs Cu
− Brownfields opportunity significantly reduces risk
(1) Refer to National Instrument 43-101 technical report dated July 12, 2017 Technical Report for the Kemess Underground and Kemess East Project, British Columbia, Canada, available in the AuRico Metals filings on SEDAR.
A preliminary economic assessment (PEA) is preliminary in nature and includes inferred mineral resources that are considered too speculative geologically to have the economic considerations applied to them that would
enable them to be categorized as mineral reserves, and there is no certainty that the PEA will be realized.
(2) Refer to February 22, 2019 mineral reserves and resources news release.
(3) AISC is a Non-GAAP measure, see “Non-GAAP Measures” in Company’s MD&A and News Release October 30, 2019.
November 2019 30Centerra: Investor Relations Highlights
Research Coverage
Top Ten (10) Institutional Shareholders
Brokerage Firms Rating Target
Institution/Firm Sept. 30-2019
1. BofA Merrill Lynch Buy C$14.50
1. Van Eck Associates 9.59%
2. Canaccord Genuity Buy C$12.50
3. CIBC World Markets Hold C$12.25 2. Blackrock 7.94%
4. Cormark Securities Buy C$17.00 3. Ruffer LLP 4.43%
5. Credit Suisse Outperform C$13.00 4. Dimensional Fund Advisors 3.94%
6. Global Mining Research Buy C$14.40 5. Kopernik Global 1.97%
7. Halyk Finance Buy C$13.73
6. Vanguard Group 1.95%
8. National Bank Financial Outperform C$15.00
7. Franklin Advisors 1.73%
9. Raymond James Outperform C$14.50
8. Wellington Management 1.71%
10. RBC Capital Markets Sector Perform C$11.50
9. Connor Clark & Lunn 1.67%
11. Scotiabank Outperform C$14.00
12. TD Securities Hold C$14.00 10. Capital Research Global Investors 1.00%
Average C$13.87 TOTAL 35.93%
November 2019 31Centerra: Directors
Board of Directors Background
MICHAEL S. PARRETT Chairman Appointed Director of Centerra’s Board, May 2014
BRUCE V. WALTER Vice Chair Appointed Director of Centerra’s Board, May 2008
SCOTT G. PERRY Director Appointed Director of Centerra’s Board, January 2016
RICHARD W. CONNOR Director Appointed Director of Centerra’s Board, June 2012
DUSHEN KASENOV Director Appointed Director of Centerra’s Board, May 2019
MASKAT KOBONBAEV Director Appointed Director of Centerra’s Board, May 2019
STEPHEN A. LANG Director Appointed Director of Centerra’s Board, June 2008
ASKAR OSKOMBAEV Director Appointed Director of Centerra’s Board, May 2018
JACQUES PERRON Director Appointed Director of Centerra’s Board, October 2016
SHERYL K. PRESSLER Director Appointed Director of Centerra’s Board, May 2008
SUSAN YURKOVICH Director Appointed Director of Centerra’s Board, May 2018
November 2019 32TSX: CG www.centerragold.com
You can also read