COMPANY PRESENTATION 21 November 2016 - Solon Eiendom
←
→
Page content transcription
If your browser does not render page correctly, please read the page content below
COMPANY PRESENTATION
      21 November 2016   |1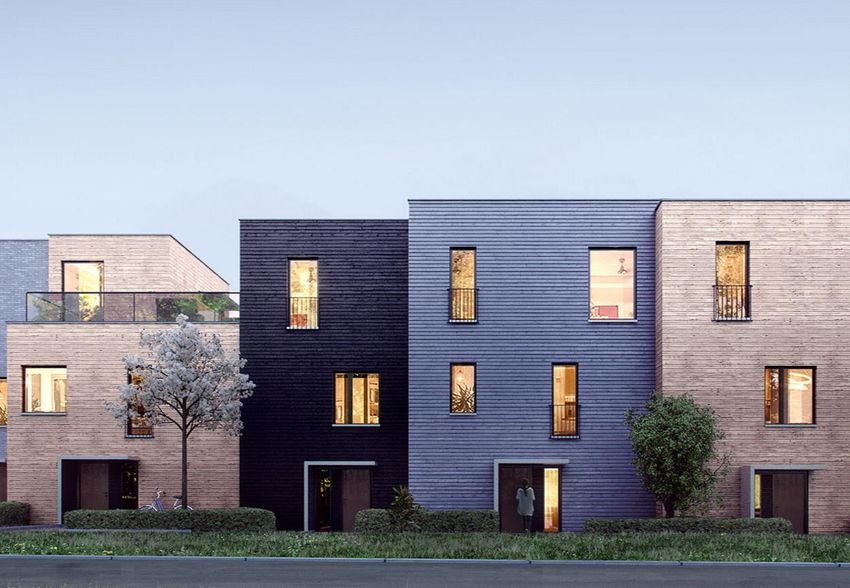
Disclaimer
This company presentation (the "Presentation") has been produced by Bionor Pharma ASA (“Bionor”) exclusively for information purposes. In this Investor Presentation,
references to the "Company", and references to the "Company“ are to the Company taken together with its consolidated subsidiaries and, where the context requires or permits,
Solon Eiendom AS taken together with its consolidated subsidiaries ("Solon Eiendom").
This document contains certain forward-looking statements relating to the business, financial performance and results of Bionor and/or the industry in which it operates or
intends to operate. Forward-looking statements concern future circumstances and results and other statements that are not historical facts, sometimes identified by the words
“believes”, expects”, “predicts”, “intends”, “projects”, “plans”, “estimates”, “aims”, “foresees”, “anticipates”, “targets”, and similar expressions. The forward-looking statements
contained in this Presentation, including assumptions, opinions and views of Bionor or cited from third party sources are solely opinions and forecasts which are subject to risks,
uncertainties and other factors that may cause actual events to differ materially from any anticipated development.
None of Bionor or any of its parent or subsidiary undertakings or any such person’s officers or employees provides any assurance that the assumptions underlying such forward-
looking statements are free from errors nor do any of them accept any responsibility for the future accuracy of the opinions expressed in this Presentation or the actual occurrence
of the forecasted developments. Bionor assumes no obligation to update any forward-looking statements or to confirm these forward-looking statements to our actual results. No
representation or warranty (express or implied) is made as to, and no reliance should be placed on, any information, including projections, estimates, targets and opinions,
contained herein, and no liability whatsoever is accepted as to any errors, omissions or misstatements contained herein, and, accordingly, neither Bionor nor any of its parent or
subsidiary undertakings or any such person’s officers or employees accepts any liability whatsoever arising directly or indirectly from the use of this document. Actual experience
may differ, and those differences man be material.
By reviewing this Presentation you acknowledge that you will be solely responsible for your own assessment of the market and the market position of Bionor and that you will
conduct your own analysis and be solely responsible for forming your own view of the potential future performance of the businesses of Bionor. This presentation must be read in
conjunction with the recent Financial Information and the disclosures therein.
This announcement is not an offer for sale or purchase of securities in the United States or any other country.
The securities referred to herein have not been registered under the U.S. Securities Act of 1933, as amended (the “U.S. Securities Act”), and may not be sold in the United States
absent registration or pursuant to an exemption from registration under the U.S. Securities Act. Bionor has not registered and does not intend to register its securities in the
United States or to conduct a public offering of its securities in the United States. Any offer for sale or purchase of securities will be made by means of an offer document that may
be obtained by certain qualified investors from Bionor. Copies of this Presentation are not being made and may not be distributed or sent into the United States, Canada, Australia,
Japan or any other jurisdiction in which such distribution would be unlawful or would require registration or other measures. In any EEA Member State that has implemented
Directive 2003/71/EC (together with any applicable implementing measures in any member State, the “Prospectus Directive”), this communication is only addressed to and is
only directed at qualified investors in that Member State within the meaning of the Prospectus Directive. This Presentation is only directed at (a) persons who are outside the
United Kingdom; or (b) investment professionals within the meaning of Article 19 of the Financial Services and Markets Act 2000 (Financial Promotion) Order 2005 (the
“Order”); or (c) persons falling within Article 49(2)(a) to (d) of the Order; or (d) persons to whom any invitation or inducement to engage in investment activity can be
communicated in circumstances where Section 21(1) of the Financial Services and Markets Act 2000 does not apply.
No shares or other securities are being offered pursuant to this presentation. This presentation does not constitute an offer to sell or form part of, and should not be construed as,
an offer or invitation for the sale or subscription of, or a solicitation of an offer to buy or subscribe for, any shares or other securities in any jurisdiction, nor shall it or any part of it
or the fact of its distribution form the basis of, or be relied on in connection with, any offer, contract, commitment or investment decision relating thereto, nor does it constitute a
recommendation regarding the securities of the company. Investors should not subscribe for or purchase any shares or other securities referred to in this presentation.
The information in the Presentation is based on the assumption of completion of the acquisition of the entire share capital of Solon Eiendom. The acquisition is subject to
acceptance in an extraordinary general meeting and customary closing conditions.
|2
Introduction            p. 3

Investment highlights   p. 5

Company and strategy    p. 14

Market                  p. 24

Financials              p. 32

Appendix                p. 40

                                |3
INTRODUCTION
Solon in brief
Key facts Management
Solon is a residential real estate development company
established in 2006 by founder Simen Thorsen and investor
Tore Aksel Voldberg
Simen Thorsen Andreas Martinussen Tarjei Røise Warholm
Chairman Chief Executive Officer Chief Financial Officer
Focused on the Oslo region, the fastest growing
region in Norway
Current portfolio consists of ~1,900 units
Torgils Kvam Tom Andrè Svenning- Gultvedt
on a 100 % basis (projects under
Development & Marketing Development & Marketing
development and land bank, including
options)
YTD Q3
NOKm 2013 2014 2015 2016
Solon has since its incorporation sold 811 Operating revenue 241 328 805 557
units with a total sales price of more than
NOK 4 billion Operating profit 20 50 115 101
Margin (%) 8.3% 15.3% 14.3% 18.2%
Lean organisation with solid understanding of
market trends and dynamics Profit before taxes 24 47 140 93
Profit for the period 19 30 119 71
Margin (%) 8% 9% 15% 13%
Key financials (NGAAP)1
1 Solon Næring , a residential development company, was acquired in 2015 and was consolidated on a full year basis as of 2015
|4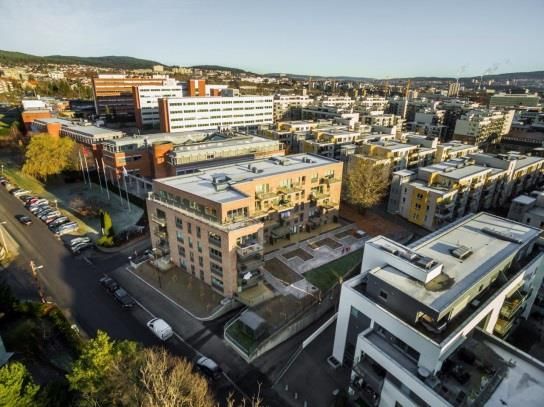
Introduction            p. 3

Investment highlights   p. 5

Company and strategy    p. 14

Market                  p. 24

Financials              p. 32

Appendix                p. 40

                                |5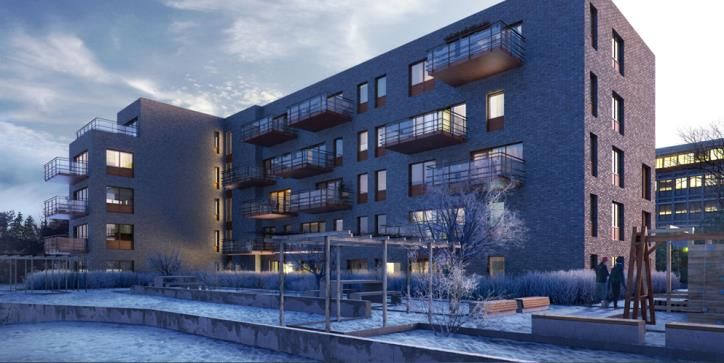
INVESTMENT HIGHLIGHTS

Investment highlights

1
    Fast growing residential development company with strong track record

2
    Significant backlog and land bank makes a solid platform for continued growth

3
    Lean organisation with hands-on management and customer centric approach

4
    Geographically focused on the most attractive residential market in Norway

5
    Substantial growth potential beyond the backlog and land bank

6
    Low-risk business model – 60% pre-sales and fixed price construction contracts

                                                                                     |6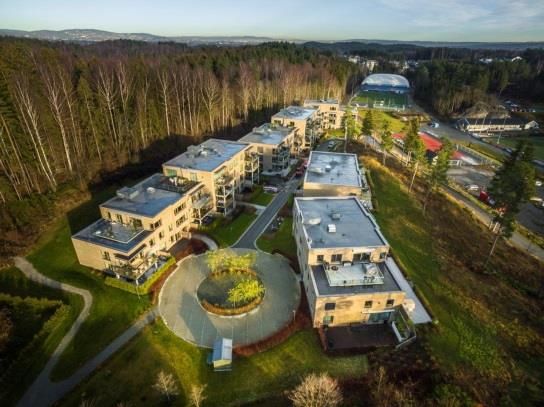
INVESTMENT HIGHLIGHTS

  1a
            Fast growing residential development company with
            strong track record
  Units sold and delivered, and portfolio potential                                                     Operating revenue and profit margin2 (NGAAP)
                                                                                     1,900                    Operating revenue NOKm          805

       Sold                                                                                       200         Profit margin2
       Delivered
                                        1 69

                                                                                                                                                      557
                                                                                                           20%
                                                                    1 28
                                                     1 25

                                                            1 09
                                                                                                                      15%                     1 5%
                                                                                                           365
                                                                                                                                                      1 3%
                                                                                                                      335              328
                    73           70                                        73
  69
                            62                 60                                                                                      9%
                                                                                                                               241
                                                                                                                               8%
               39
       33

   2011         2012         2013         2014         2015        YTD 2016       Portfolio
                                                                                                           2011      2012      2013    2014   2015   YTD Q3
                                                                                     full
                                                                                                                                                      2016
                                                                                  potential1
1 Including projects under development as well as the estimated full potential of the land bank
2 Profit margin = Profit for the period / Operating Revenue
                                                                                                                                                               |7
                                                                                                                                                              |7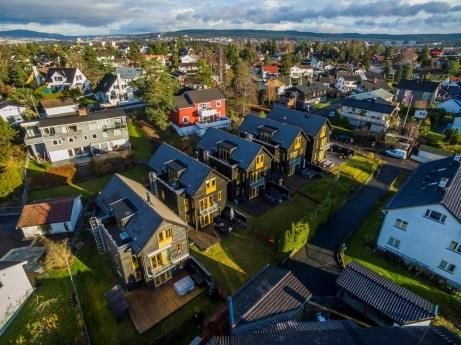
INVESTMENT HIGHLIGHTS

  1b
           Fast growing residential development company with
           strong track record
  Strong track record from finalised projects
                              Voksenkollen Felt A               Tveterjordet                       S72                    Ullevål Tårn1    Løren Vest     Lettvintveien
                                    2016                           2016                           2016                        2015            2015            2015

         2016

                                    17.7% PMBT                   15.2% PMBT                   10.4% PMBT                   28.7% PMBT      8.1% PMBT       15.1% PMBT
                                      20 units                      12 units                    74 units                     32 units        28 units         4 units
    Landsnes Hage                 Ljabrubakken              Kruttverket Hageby              Voksenkollen                      Sogsti      Skogholtveien   Skøyenåsveien
        2015                          2014                         2014                         2013                           2013           2013            2012

       13.7% PMBT                   12.6% PMBT                    8.5% PMBT                   30.2% PMBT                   31.8% PMBT      15.4% PMBT      34.4% PMBT
         45 units                      6 units                      54 units                    32 units                      41 units        9 units        17 units
Ridder Flemmingsvei             Korsvoll Terrasse                Frysjaveien                       MX                   Eidsvoll Brygge   Brattlikollen
        2012                          2011                          2011                          2009                       2009            2009

                                                                                                                                                              2009

       25.9% PMBT                   44.0% PMBT                   17.5% PMBT                   18.0% PMBT                   10.3% PMBT      16.0% PMBT
         50 units                      2 units                      6 units                     84 units                      11 units        31 units

1 Solon was awarded the “City of Oslo Architecture” award in 2016 for the architecture of Ullevål Tårn
Note: PMBT = Profit Margin Before Tax, including all project related costs and overheads, but excluding bonus payments to employees
                                                                                                                                                                          |8
INVESTMENT HIGHLIGHTS
2
Significant backlog and land bank makes a solid
platform for continued growth
Development potential1 Portfolio – estimated deliveries per year (assuming 100% sales)
274 780
780
Land bank 250 250
~1,900 Under development 236
240
220
~1,626 220
Solon’s portfolio includes 274 200
units that are currently under 180 1 20
development and a significant 163
land bank 160 6
140
Solon estimates a full portfolio
development potential of up to 120
~1,900 units1, of which the
company owns 87% with options 100
to acquire an additional 11% 80 74
1 57
1
The weighted average sales rate 60 116
for projects under development is
40 73
80% (218 units)
20
For Solon’s concluded projects,
0
the average per-unit profit before 2016 2017 2018 2019 2020 2021 >2021
tax is NOK ~1.1 million2
1 Including 274 units under development and an estimated land bank development potential of up to ~1,626 units
2 Including all project related costs and overheads, but excluding bonus payments to employees
|9
|9
INVESTMENT HIGHLIGHTS
3
Lean organisation with hands-on management and
customer centric approach
Customer centric approach Hands-on management
Solon’s profitable growth is rooted in its customer centric
approach
Local knowledge and identified customer preferences are given
emphasis throughout the value chain, from the screening of Simen Thorsen Andreas Martinussen Tarjei Røise Warholm
suitable development areas to the last finish prior to delivery Chairman Chief Executive Officer Chief Financial Officer
The company has a high share of market oriented people
Identification and analysis of market trends and customer
preferences are carried out as continuous processes, ensuring
that the company stay’s ahead of its competition Torgils Kvam Tom Andrè Svenning- Gultvedt
Development & Marketing Development & Marketing
Lean organisation Organisation chart
Solon is a pure play residential developer with 16 full time
employees1 Chairman
No in-house construction arm – all construction activity put CEO
out to competitive tender Admin
Acquire and Marketing and
Project design Construction Project Operations / Finance and
refine land sale Development
Engineers Maintenance Accounting
1 One more employee has agreed to join the company in 2017
| 10INVESTMENT HIGHLIGHTS
4
Geographically focused on the most attractive
residential market in Norway
Commentary All projects to be located within a one hour drive from the city centre
Solon focuses its
development on the most
central areas of the Oslo
Region1, located within a one
hour drive from the city
centre
The Oslo Region is the largest
urban area in Norway,
spanning a population of
~1.35 million, of which ~0.65
million reside in the city of
Oslo
The geographical focus is an
essential aspect of the
company’s strategy, which
relies on strong local
knowledge and a hands-on
approach
1 The Oslo Region is by Statistics Norway defined as the municipalities that has its town hall located within 100 kilometres from the city hall of Oslo, spanning
an area that covers 6% of Norway
Source: Statistics Norway
| 11INVESTMENT HIGHLIGHTS
5
Substantial growth potential beyond the backlog and
land bank
Commentary Current shortlist constitutes up to ~1,000 units
Solon targets prime location
plots with a total
development potential of 40-
120 units
Significant growth potential
within Solon’s geographical
focus area
The current shortlist
constitutes NOK ~1.1 billion
with an estimated
development potential of up
to 1,000 units
Solon continuously screen
the market for suitable plots
to add to its land bank
120 units
| 12INVESTMENT HIGHLIGHTS
6
Low-risk business model – 60% pre-sales and fixed
price construction contracts
Limited break-even risk with 60% pre-sales1 De-risking in key stages of projects
1 00%
1 - Acquire zoned
land or areas
Acquire zoned land or unzoned land that is
allocated for
24% allocated for residential development
residential
development
76%
1 6% 1 6% Pre-sales of minimum 60% secures the majority of
2 – Minimum sales revenue before construction
60%
rate of 60% before 10% of purchase price is paid by the buyer at the
construction point of sale, and proof of financing for the
remaining amount is required
3 – Fixed price
60% Construction contracts with solid counterparties are
construction
made with fixed prices
contract
1 6%
4 – Limited post- Post-delivery claims are the contractors’
Land Pre-sales Break- Project Profit Sales price delivery risk responsibility
acquisition even sales costs potential (100%)
cost (pre-tax)
1 Illustration based on the average of completed projects, including all project related costs and overheads, but excluding bonus payments to employees
| 13Introduction p. 3
Investment highlights p. 5
Company and strategy p. 14
Market p. 24
Financials p. 32
Appendix p. 40
| 14COMPANY AND STRATEGY
Targeting superior profits from development of 250-300
units per annum in the Oslo region
Solon – business overview
Residential real estate development Non-Core
Wholly owned projects Joint Ventures Commercial real estate
Solon owns one commercial real estate at
Apartment complexes with typically Detached houses located in the Capitalize on core competences and Høvik, Akershus, which is intended to be
40 – 120 units per project «gardens» of existing villa areas with strong brand name by selectively enter sold
typically 4 – 9 units into joint ventures on quality projects
Vision Be the preferred and most profitable residential real estate developer in Norway
Offering Quality products at prime locations
Operational targets Deliver 250-300 units to customers each year
Geographical focus The Oslo region (within a one hour drive from the city centre)
| 15COMPANY AND STRATEGY
274 units under development in eight projects with a sales
rate of 80%
Commentary Overview of projects under development
Est. sales price Est. completion
Project name Ownership Units Units sold
Solon has 274 units under (NOKm) (YE2016)
development in eight projects Berg Boligutvikling 90% 4 100% 51 35%
Freidigveien 90% 5 100% 42 0%
Jessheim Hage 100% 77 81% 390 42%
The estimated sales price is
Kolbotn Hage 100% 121 72% 726 19%
NOK 1,682 million (100%
Kolbotn Hengende Hage 100% 25 88% 166 42%
basis, assuming 100% sales)
Krokstien 90% 4 100% 31 0%
Skogholtveien 90% 5 100% 5 15%
The current total sales rate Sæter Terrasse 70% 33 88% 272 95%
for projects under Sum 274 w. avg. 80% 1,682 w. avg. 39%
development is 80% (218
units)
| 16COMPANY AND STRATEGY
Land bank valued at NOKm ~1,450 by two independent
brokers with a development potential of up to ~1,626 units
Commentary Overview of land bank and estimated development potential
Asset valuation
Solon’s has a land bank in the Union Akershus Average1
Outst.
Project name Acquired Ownership BRA-S Units GIBD Payment2 NAV adj.3
Oslo region of 17 plots and Ski Magasinleir 100% 36,800 440 407 413 410 61 60 289
2011
holds options to acquire two Kolbotn III 100% 5,150 61 84 78 81 0 56 25
2016
additional plots Jegerveien 100% 3,270 25 114 103 108 66 0 42
2015
Storbukta / Kolbotn IV4 2016 100% 7,100 85 122 115 118 24 56 39
The company estimates the Thorleif Haugsvei 2016 100% 4,600 34 113 114 114 0 78 36
full development potential of Kleivveien 1 2013 100% 2,700 34 47 47 47 12 0 35
its land bank to be ~1,626 Lier 2015 100% 14,000 190 110 101 106 72 0 34
units on a 100% basis Nydalen Vest 2014 100% 600 75 52 67 60 28 0 31
(subject to zoning and Ulsrud 2016 100% 7,300 109 58 62 60 15 15 31
including options) Sønsterudveien 30 2012 100% 3,300 51 24 28 26 9 0 17
Askeveien 2015 100% 1,100 15 35 32 34 0 18 16
Nesodden 50% 2,430 24 37 30 34 10 0 12
The estimated value of the 2011
Bygdøy 50% 3,400 19 132 118 125 104 0 10
land bank amounts to NOK 2015
Tåsen 100% 3,900 44 38 35 37 32 0 5
1,449 million on a 100% 2016
Råholt 100% 2,900 56 39 25 32 27 0 5
basis, while the estimated net 2014
Drøbak 2016 100% 20,500 148 N/A N/A 48 0 48 0
asset value (“NAV”) after
Peder Holters vei 2016 90% 700 6 N/A N/A 11 0 11 0
adjusting for ownership
Total 119,750 1,416 1,411 1,370 1,449 460 341 626
amounts to NOK 626 million
Project name BRA-S Units Comment
Harbitzalleen 9,200 120 Solon holds the option to acquire the plot
Ullevaal Tårn II 8,500 90 Solon holds the option to acquire the plot
Total 17,700 210
1 Derived as a the average valuation of two independent real estate brokers, with the exception of Drøbak and Peder Holters vei, which is based on the acquisition price
2 Total outstanding payment to previous owner for the acquisition of the land area per Q3 2016
| 17
3 Adjusted for ownership
4 Purchase price not final – dependent on the outcome of the zoning processCOMPANY AND STRATEGY
Adding value by focusing on core competences and risk
mitigation
Solon’s value chain
Continuous 12 – 36 months 6 – 12 months 3 – 9 months 12 – 24 months
creation development
Residential
Acquire and
Screening and Marketing and
refine land for Project design Construction
analysis sale
development
Value
Acquisition Zoning Sales start Construction start Delivery
Continuous analysis Acquire (i) zoned Plan and prepare for Target 60% pre-sale Fixed price contracts
optimization
of market trends and land or (ii) unzoned construction before start-up with reputable and
Project
identification of land that is allocated (irrevocable solid counterpart
customer for residential purchase contracts)
Construction costs
preferences development
financed with
Screen market for Lever acquired land construction loans
land to improve ROE
Target 100% sale at
delivery
Adding value by utilizing core competencies, while minimizing project risk through zoning risk hedging, 60% pre-
sales and fixed price construction contracts
| 18COMPANY AND STRATEGY
3- stage strategy facilitating profitable growth
Be the preferred and most profitable residential real estate developer in Norway
Deliver 250-300 units to customers each year
1
Deliver high quality projects at prime locations
2
Continue to grow portfolio of projects with high profitability potential
3
Maintain lean organisation and hands-on approach while facilitating growth
| 19COMPANY AND STRATEGY
1
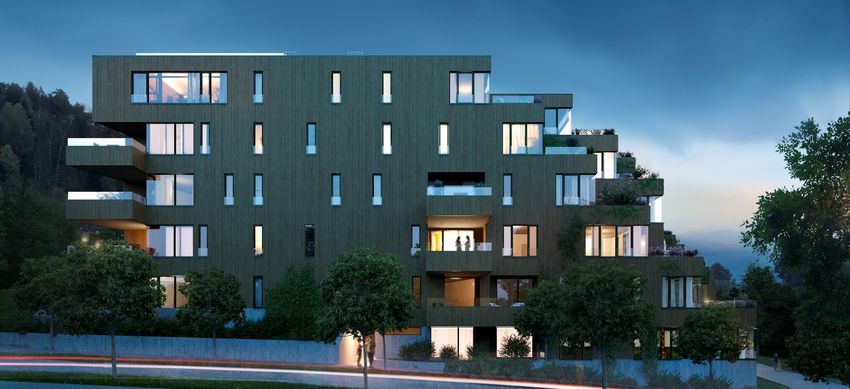
Deliver high quality projects at prime locations
Deliver quality projects that achieve a premium pricing
- Tailor offering to match a pre-defined group of buyers
- Unique feel and high standard
- Iconic architectures
Focus on prime locations with a defined need
- Prime locations within an area with a relatively high purchasing power
- Avoid areas with high supply and price driven competition
Maximise sales prices
- Prices set so that the project is not fully sold immediately after sales launch – target gradual sales towards
delivery
- The pricing strategy also incentivise project leaders to stay fully committed until delivery
Extraordinary marketing
- High quality sales prospects and websites
- Display center/show room (decorated as a real apartment)
Work with highly reputable and innovative partners
- Top notch architects, contractors, consultants etc.
| 20COMPANY AND STRATEGY
2
Continue to grow portfolio of projects with high
profitability potential
Projects with 40 to 120 units is defined as the «sweet spot» offering
Continue targeted search for new land areas
Capitalize on strong brand name and company network and consider entering new joint ventures with
reputable real estate developers (commercial and/or residential)
In addition to increasing the number of projects, the company will focus on larger projects
within the defined interval. The additional workload is limited relative to the
corresponding profit potential
| 21COMPANY AND STRATEGY
3
Maintain lean organisation and hands-on approach
while facilitating growth
The company is capable of delivering 250 – 300 units annually with today`s organisation
Scalable business model: Adding one project leader corresponds to a capacity increase of 1 to 2 large scale projects with up to 120
units
Further improve the process of negotiating attractive turnkey construction contracts
Further growth potential by adding new project leaders
- Solon is planning to add an additional two project leaders in the period 2018 – 2019 (one renowned project leader from one of the
largest residential developers in Norway has already signed, starting 01.05.17)
| 22COMPANY AND STRATEGY
New proposed board of directors
Simen Thorsen Einar J. Greve Tore Aksel Voldberg Bente Bøhler Katarina Finneng
Chairman Vice Chairman Director Director Director
Simen Thorsen is a founding Einar J. Greve has previously Tore Aksel Voldberg is a Bente Bøhler’s experience Katarina Finneng has
partner of Solon Eiendom been a partner of Wikborg founding partner of Solon includes CEO and CFO extensive experience from
and is currently holding the Rein & Co for 15 years and Eiendom and is currently positions in several strategic and operative work
position as executive partner of Arctic Securities represented in the BoD Norwegian companies within within HR and internal /
chairman the real estate sphere external communication and
He is currently working as a He is a well-known investor
PR
He has previously served as strategic advisor and in the Norwegian market and She is currently the owner of
the company’s CEO. He has investor in Cipriano AS has many years of experience Exaro Holding AS She is the Deputy Chief
in addition worked as a real serving as chairman in Human Resource Officer in
He holds various positions in Bente is an authorized real
estate broker and has over several companies Norwegian Air Shuttle ASA.
listed and unlisted estate broker and holds a
the years gained deep Before starting in Norwegian
companies, including but not degree in economy and
industry knowledge of the Katarina was positioned as
limited to Axactor AB master of management in
Norwegian real estate market Head of Communications in
(chairman), Weifa ASA shipping from
Hafslund ASA
(chairman), Bionor Pharma Handelshøyskolen BI
ASA (chairman), Techstep She holds an Executive
ASA (chairman), Vistin degree in management from
Pharma ASA (board Handelshøyskolen BI
member) and Hæhre and
Isachsen Holding AS (board
member)
He holds a degree in law
(cand.jur) from the
University of Oslo
| 23Introduction p. 3
Investment highlights p. 5
Company and strategy p. 14
Market p. 24
Financials p. 32
Appendix p. 40
| 24MARKET
Norwegian demographics
Strong population growth and centralization trend
1
Population of ~5.2 million,
expected to grow by ~30% by 2030
4
The workforce is highly skilled and
educated – with one of the lowest
2 rates of unemployment in Europe
Norway is characterized by
substantial purchasing power, a
relatively high standard of living
and volume of spending
5
Migration flows between regions
show that people are moving into
the larger cities/regions, with Oslo
3
experiencing strong growth
Norway is one of the OECD
countries with the highest GDP per
capita (USD ~61k in 2015)
Source: Statistics Norway, OECD
| 25MARKET
Norway housing market supported by a housing deficit
(1/2)
Population growth versus housing stock growth (last 10 years)
20%
15%
Norway Ireland
Population growth
Switzerland
10%
Sweden
Belgium
United Kingdom
Spain
5% Italy France
Denmark Finland
Austria
Netherlands
Czech Republic
Slovakia
0%
Germany Poland
Portugal
Hungary
-5%
0% 2% 4% 6% 8% 10% 12% 14% 16% 18% 20%
House stock growth
Note: Bubble size indicates size of economy (GDP)
Source: Euroconstruct, Bloomberg
| 26MARKET
Norway housing market supported by a housing deficit
(2/2)
Population growth and forecast (Norway) Residential housing – demand vs supply (Norway)
70,000 40,000
60,000 35,000
30,000
50,000
25,000
40,000
20,000
30,000
Population growth Required net growth to meet population growth
1 5,000
Base case Required net growth assuming low imigration
20,000
Low net immigration Actual net growth
1 0,000
2010 2011 2012 2013 2014 2015 2016 2017 2018 2019 2020
2018
2008
2010
2005
2020
2004
2006
2007
2009
2012
2011
2015
2016
2017
2019
2013
2014
Population growth in Norway has increased significantly over Demand for housing has outpaced supply as growth in
the past decade with a substantial uptick in net immigration households has significantly outnumbered construction since
2010
The accumulated deficit of new housing units from 2010-2015
is estimated to be ~72,800
Source: Prognosesenteret, September 2016, Statistics Norway
| 27MARKET
Demand is particularly strong in Oslo – one of the fastest
growing capitals in Europe
Population growth 2014 – 2020e Oslo – one of Europe's fastest growing capitals
City City region
Oslo 28%
27 %
Copenhagen 27 %
1 3%
23%
Stockholm 29%
20%
London 21 %
Brussels 1 8%
Manchester 1 6%
1 4%
Düsseldorf 3%
1%
München 8%
0%
Hamburg 2%
Berlin 0%
The population of Oslo is expected to grow by around 30% by
2030, making it one of Europe’s fastest-growing cities
Oslo has a very competitive business sector with several strong
clusters
Urbanisation is adding to population growth in the main cities
The workforce is highly skilled and educated – with one of the
lowest rates of unemployment in Europe
Source: Statistics Norway, IMF
| 28MARKET
Growing deficit of new housing units in the Oslo region
Housing construction vs housing demand1 in Oslo region2 2007-2015
The Oslo region is the largest residential area in Norway, and has suffered from undersupply over a long period
The undersupply has accelerated since 2007 due to high population growth
1 4,000
1 2,000
1 0,000
8,000
6,000
4,000
2,000
Net housing growth
Hosuing demand based on population growth
0
2007 2008 2009 201 0 201 1 201 2 201 3 201 4 201 5
1 Housing demand derived as population growth divided by a constant factor of 1.9, representing the average number of residents per household
2 Oslo region as defined by Statistics Norway
| 29
Source: Statistics NorwayMARKET
Households’ purchasing power growing stronger as
interest rates fall
Mortgage interest cost relative to disposable income for Oslo and Norway
After tax mortgage interest cost relative to disposable income is at a low level in a historical context
- Assuming average income and median apartment prices bought with 85% LTV & 3m NIBOR +120bps (net of tax) 1, the interest cost
for an resident based in Oslo and Norway makes up 12.9% and 10.3% of disposable income, respectively
50.0 %
45.0 %
40.0 %
35.0 %
30.0 %
25.0 %
20.0 %
15.0 %
10.0 %
5.0 %
Mortgage interest rate cost / Disp. income (tax adjusted) Oslo Mortgage interest rate cost / Disp. income (tax adjusted) Norway
0.0 %
jan.88 jan.91 jan.94 jan.97 jan.00 jan.03 jan.06 jan.09 jan.12 jan.15
1 Intended to represent a typical first time home buyer
Source: Eiendom Norge, SSB
| 30MARKET
Norway – a resilient economy
GDP growth 2005 – 2015 (annual) Unemployment (% of total labour) Q1-15 – Q2-16
6%
1 0%
4%
8%
2%
6%
0%
2005 2006 2007 2008 2009 201 0 201 1 201 2 201 3 201 4 201 5 4%
-2%
-4% 2%
YE2010 YE2011 YE2012 YE2013 YE2014 YE2015
-6%
Norway France Germany Sweden UK Norway France Germany Sweden UK
Population growth 2010-2015 Public net wealth/GDP 2015
Norway France Germany Sweden UK Norway 285%
1.5% 1 .3% 1 .3%
1 .2% 1 .2%
1 .1 % 1 .1 % Sweden 1 9%
1.0%
Germany -43%
0.5%
France -7 6%
0.0%
UK -81 %
2010 2011 2012 2013 2014 2015
Source: IMF, OECD, The World Bank
| 31Introduction p. 3
Investment highlights p. 5
Company and strategy p. 14
Market p. 24
Financials p. 32
Appendix p. 40
| 32FINANCIALS
Solon Eiendom – Profit and loss (NGAAP)
Commentary Consolidated statement of income
YTD Q3 2016 2015 2014 2013
Solon Næring, a residential Amounts in NOK
(Unaudited) (Audited) (Audited) (Audited)
development company, was acquired Revenue 556,526,548 804,847,299 327,998,051 241,370,977
in 2015 and was consolidated on a Other operating income 0 0 0 0
full year basis as of 2015 Operating revenue 556,526,548 804,847,299 327,998,051 241,370,977
Cost of goods sold -428,190,630 -645,717,627 -254,219,498 -199,725,338
Personnel expenses -15,836,590 -27,174,745 -11,592,275 -13,582,893
Depreciation -919,521 -1,680,037 -589,687 -371,841
Other operating expenses -10,109,025 -14,945,002 -11,484,870 -7,697,388
Operating expenses -455,055,766 -689,517,412 -277,886,330 -221,377,460
Operating profit 101,470,782 115,329,887 50,111,721 19,993,517
Share of profit from associated companies 0 0 255,567 25,282
Interest income 383,150 3,117,818 650,629 2,097,101
Financial income -5,360,650 29,931,589 99,899 5,993,852
Change in value of marketable investments 0 0 0 346,024
Financial income -4,977,500 33,049,407 1,006,095 8,462,259
Interest expenses -3,608,493 -8,024,250 -266,021 -3,589,847
Financial expenses -372,243 -609,357 -3,878,471 -1,060,740
Financial expenses -3,980,736 -8,633,607 -4,144,492 -4,650,587
Financial income/expense -8,958,236 24,415,800 -3,138,397 3,811,672
Profit before income taxes 92,512,546 139,745,687 46,973,325 23,805,189
Income tax expense -21,133,297 -20,526,125 -16,664,131 -5,230,465
Profit for the period 71,379,249 119,219,562 30,309,194 18,574,724
Profit attributable to
Non-controlling interest 10,138,418 10,376,504 8,898,117 3,194,785
Controlling interest 61,240,831 108,843,058 21,411,077 15,379,939
| 33FINANCIALS
Solon Eiendom – Balance sheet – Assets (NGAAP)
Commentary Consolidated statement of financial position
30 Sep 2016 31 Dec 2015 31 Dec 2014 31 Dec 2013
Solon Næring, a residential Amounts in NOK
(Unaudited) (Audited) (Audited) (Audited)
development company, was acquired Fixed assets
in 2015 and was consolidated on a Buildings and other real estate 73,213,655 52,833,196 21,433,329 21,590,555
Machinery and equipment 6,542,183 10,476,750 2,470,199 734,162
full year basis as of 2015
Total tangible assets 79,755,838 63,309,946 23,903,528 22,324,717
Investment in Fjordveien 28,400,000 28,400,000 -
Investments in associates and joint ventures 1,363,994 3,212,786 3,577,293 3,321,726
Investments in shares 2,656,533 2,656,533 605,333 5,605,333
Other non-current receivables 14,100,867 4,597,729 2,706 -
Total non-current financial assets 46,521,394 38,867,048 4,185,332 8,927,059
Total non-current assets 126,277,232 102,176,994 28,088,860 31,251,776
Current assets
Inventories
Inventories 693,316,319 712,818,413 536,859,363 386,368,232
Total inventories 693,316,319 712,818,413 536,859,363 386,368,232
Receivables
Accounts receivables and other receivables 337,821,046 443,470,021 206,991,537 104,530,237
Total receivables 337,821,046 443,470,021 206,991,537 104,530,237
Investments
Marketable shares 14,221,456 20,000 347,524 12,755,000
Total investments 14,221,456 20,000 347,524 12,755,000
Cash and cash equivalents
Cash and cash equivalents 103,942,842 117,972,993 44,308,573 67,140,703
Cash and cash equivalents 103,942,842 117,972,993 44,308,573 67,140,703
Total current assets 1,149,301,663 1,274,281,427 788,506,997 570,794,172
TOTAL ASSETS 1,275,578,895 1,376,458,421 816,595,857 602,045,949
| 34FINANCIALS
Solon Eiendom – Balance sheet – Equity and liabilities
(NGAAP)
Commentary Consolidated statement of financial position
30 Sep 2016 31 Dec 2015 31 Dec 2014 31 Dec 2013
Solon Næring, a residential Amounts in NOK
(Unaudited) (Audited) (Audited) (Audited)
development company, was acquired Equity
in 2015 and was consolidated on a Paid-in capital
full year basis as of 2015 Paid-in share capital 100,000 100,000 100,000 100,000
Total paid-in capital 100,000 100,000 100,000 100,000
Solon’s interest bearing debt consists Retained earnings
of loans in three types of facilities: Retained earnings 259,525,110 248,750,320 160,737,015 139,620,294
Non-controlling interest 15,035,172 4,805,494 12,384,086 39,661,815
- Corporate loans represent top- Total retained earnings 274,560,283 253,555,814 173,121,101 179,282,109
up financing, and are independent
of the group’s level of activity Non-controlling interest 841,524 841,524 243,644 223,844
- Land loans represent the debt
Total equity 275,501,807 254,497,338 173,464,745 179,605,953
related to financing undeveloped
sites for future housing Liabilities
development. Once 60% of the Non-current liabilities
units are been sold and Deferred tax liabilities 116,447,953 99,925,201 45,102,457 12,598,530
construction starts, the land loan Liabilities to credit institutions 677,865,565 806,864,500 521,606,941 315,941,965
is converted into a construction Other liabilities 95,889,907 67,166,175 11,024,441 13,255,314
loan Total non-current liabilities 890,203,424 973,955,876 577,733,839 341,795,809
- Construction loans follow the Current liabilities
building projects, and fully fund Current liabilities to credit institutions 532,020 34,663,613 16,933,780 128,957
construction costs. Interest Accounts payable 69,135,645 60,130,442 28,548,432 24,322,907
charges are capitalised along the Income taxes payable 10,869,273 129,585 569,650 33,871,206
way and the loans are redeemed Public duties payable 1,024,441 2,044,366 2,984,429 1,235,373
upon completion of the project Other current liabilities 28,312,285 51,037,201 16,360,984 21,085,744
Total current liabilities 109,873,664 148,005,207 65,397,273 80,644,186
- The weighted average interest rate
on Solon’s corporate loans, land Total liabilities 1,000,077,089 1,121,961,083 643,131,112 422,439,996
loans and construction loans is
7.7%, 3.6% and 2.5%, respectively TOTAL EQUITY AND LIABILITIES 1,275,578,895 1,376,458,421 816,595,857 602,045,949
| 35FINANCIALS
Solon Eiendom – Profit and loss (preliminary IFRS)
Commentary Consolidated statement of income
YTD Q3 2016 2015
Amounts in NOK
Solon Næring, a residential (Unaudited) (Unaudited)
development company, was acquired Revenue 587,837,485 687,639,062
in 2015 and was consolidated on a Other operating income 0 0
full year basis as of 2015 Operating revenue 587,837,485 687,639,062
Cost of goods sold -477,031,722 -535,948,877
Personnel expenses -15,836,590 -27,174,745
Depreciation -919,521 -1,680,037
Unrealized (losses) / gains investment property -12,360,254 -1,866,060
Other operating expenses -11,245,436 -20,556,215
Other gains & losses -4,574,515 27,889,656
Operating expenses -521,968,039 -559,336,278
Operating profit 65,869,446 128,302,784
Interest income 739,640 3,119,770
Other financial income -1,150,364 828,562
Interest expenses -8,966,303 -11,084,500
Other financial expense -395,913 -640,783
Net financials -9,772,940 -7,776,951
Profit before tax 56,096,506 120,525,833
Income tax expense -11,231,359 -16,003,997
Profit for the year 44,865,147 104,521,836
Profit attributable to
Non-controlling interest -2,293,750 5,596,202
Controlling interest 47,158,898 98,925,634
| 36FINANCIALS
Solon Eiendom – Balance sheet – Assets
(preliminary IFRS)
Commentary Consolidated statement of financial position
30 Sep 2016 31 Dec 2015
Solon Næring, a residential Amounts in NOK
(Unaudited) (Unaudited)
development company, was acquired Fixed assets
in 2015 and was consolidated on a Investments in real estate 200,000,000 197,955,257
full year basis as of 2015 Land, buildings and other real estate 13,887,469 20,015,501
Fixtures and fittings, tools, office machinery and equipment 6,542,183 10,476,750
Total tangible assets 220,429,652 228,447,508
Investments in associated companies and joint ventures 455,000 0
Investments in shares 2,018,200 2,656,533
Other receivables 17,149,402 7,648,576
Total financial fixed assets 19,622,602 10,305,109
Total fixed assets 240,052,254 238,752,617
Current assets
Inventories
Inventories 1,045,466,583 1,089,371,845
Total inventories 1,045,466,583 1,089,371,845
Receivables
Trade and other receivables 14,746,629 83,889,684
Total receivables 14,746,629 83,889,684
Investments
Listed investment shares 12,565,000 20,000
Total investments 12,565,000 20,000
Cash and bank deposits
Cash and bank deposits 107,584,229 122,128,243
Total cash and bank deposits 107,584,229 122,128,243
Total current assets 1,180,362,440 1,295,409,772
TOTAL ASSETS 1,420,414,694 1,534,162,389
| 37FINANCIALS
Solon Eiendom – Balance sheet – Equity and liabilities
(preliminary IFRS)
Commentary Consolidated statement of financial position
30 Sep 2016 31 Dec 2015
Solon Næring, a residential Amounts in NOK
(Unaudited) (Unaudited)
development company, was acquired Equity
in 2015 and was consolidated on a Share capital 100,000 100,000
full year basis as of 2015 Total paid-in equity 100,000 100,000
Retained earnings
Solon’s interest bearing debt consists Other equity 201,242,084 201,785,397
of loans in three types of facilities: Total retained earnings 201,242,084 201,785,397
- Corporate loans represent top- Non-controlling interest -2,152,214 2,439,326
up financing, and are independent
Total equity 199,189,870 204,324,722
of the group’s level of activity
- Land loans represent the debt Liabilities
related to financing undeveloped Provisions
Deferred tax 60,374,647 56,606,484
sites for future housing
Total provisions 60,374,647 56,606,484
development. Once 60% of the
units are been sold and Long term liabilities
construction starts, the land loan Liabilities to financial institutions 454,688,166 729,099,544
is converted into a construction Other long term debt 104,929,433 73,905,893
loan Total long term liabilities 559,617,599 803,005,437
- Construction loans follow the Short term liabilities 408,078,169 283,053,569
building projects, and fully fund Trade payables 69,419,636 63,684,830
construction costs. Interest Tax payable 10,869,273 129,585
Public duties payable 1,024,441 2,044,366
charges are capitalised along the
Derivatives 2,981,482 3,060,250
way and the loans are redeemed Prepayments from customers 79,608,500 62,439,500
upon completion of the project Other short-term liabilities 29,251,077 55,813,645
Total short term liabilities 601,232,578 470,225,745
- The weighted average interest rate
on Solon’s corporate loans, land Total liabilities 1,221,224,824 1,329,837,665
loans and construction loans is
7.7%, 3.6% and 2.5%, respectively TOTAL EQUITY AND LIABILITIES 1,420,414,694 1,534,162,389
| 38FINANCIALS
Bionor Pharma
Company overview Top 20 shareholders2
Shareholder Shares % Holding
Biopharmaceutical company currently focused on HIV
FERNCLIFF LISTED DAI 270,000,000 19.5%
immunotherapy
LARS H HØIE C/O SEB S.A. 128,973,522 9.3%
In Q3 2016, Bionor put all preparatory activities of the planned CIPRIANO AS 50,000,000 3.6%
clinical program on hold and initiated a strategic review of SWEDBANK ROBUR NY TE NORDEA TREATY ACC. 47,456,827 3.4%
Vacc-4x, and the clinical development plan to ensure it is up to NORDNET LIVSFORSIKRING 27,607,596 2.0%
date going forward OUST HOLDING AS 15,387,970 1.1%
Listed on the Oslo Stock Exchange (Ticker: BIONOR) NETFONDS LIVSFORSIKRING 13,115,165 1.0%
ALDEN AS 11,515,271 0.8%
More than 6,600 shareholders (17 November 2016)
NORDNET BANK AB 8,982,236 0.7%
WIVELSTAD DAG ARNE 7,930,724 0.6%
STEINBAKKE OLA 7,825,048 0.6%
Assets and liabilities OCULOMOTORIUS AS 7,757,809 0.6%
EIKA NORGE 6,491,002 0.5%
NOKm 40.4 of cash (Q3 2016) SMEDVIG PETER THOMAS 6,427,331 0.5%
- NOKm 87.3 of cash as per 16 November DO MICHELLE 6,363,945 0.5%
OLSEN KENT ØRJAN 6,000,000 0.4%
Potential value in the IP portfolio of Bionor Pharma1
SPAR KAPITAL INVESTO 6,000,000 0.4%
- Book value of NOKm 40 (Q3 2016) DECIDETOWIN AS 5,646,311 0.4%
BLUMER JULIE ADVOCAAT 5,543,991 0.4%
Please see the appendix for additional financial information FRANOCO AS 5,212,613 0.4%
Top 20 644,237,361 46.5%
Total 1,385,669,097 100.0%
1 No assurance can be given as to the value of the biotechnology assets
2 As per 16. November 2016
| 39Introduction p. 3
Investment highlights p. 5
Company and strategy p. 14
Market p. 24
Financials p. 32
Appendix p. 40
| 40APPENDIX
Bionor overview
Current operations, principal activities and markets
Bionor is a Norwegian biopharmaceutical company currently focused on HIV immunotherapy with the overall strategy to further advance its proprietary
therapeutic vaccine, Vacc-4x, in clinical development to develop a functional cure for human immunodeficiency virus (“HIV”). The Company believes it
has first mover potential to develop a functional cure for HIV infection.
Bionor is the result of a 2010 acquisition of the vaccine developer Bionor Immuno AS by the nutraceutical company Nutri Pharma ASA founded in 1993.
Bionor Immuno AS was a spin-off from Bionor AS, founded in 1985 in Skien, Norway, with a focus on developing diagnostic tests for viral diseases. The
combined group of Bionor Immuno AS and Nutri Pharma ASA decided to leverage its immunology expertise by exploring the use of its proprietary
compounds for viral diseases in the development of peptide vaccines. In 2011, the Group sold Nutri Pharma ASA’s Nutrilett® to Norwegian Orkla, using
the proceeds of the sale to finance the Company’s promising vaccine research. Since then, the Company has ceased its nutraceutical operations, in the
sense that no focus or time is spent on the nutraceutical operations, and its main focus has been on the development of vaccines for viral infections,
primarily HIV.
Bionor is based in Oslo, Norway, and also has representation in Copenhagen, Denmark and New York City, New York. Bionor is listed on Oslo Børs
(OSE: BIONOR). All operations in Denmark and the USA have been terminated or are in the process of being terminated.
Based on Phase I and Phase II clinical trials conducted to date, Vacc-4x has been shown to induce an immune response to HIV and to be safe and well-
tolerated in HIV patients. These clinical trials have also provided indications of an effect on the latent viral reservoir. HIV is a chronic infection due to its
ability to stay hidden within infected immune cells referred to as the latent viral reservoir. These infected immune cells contain the genetic code of HIV,
but remain invisible to the body’s immune defences and are not sensitive to currently available anti-HIV treatments.
The Company has completed Part B of its Phase II clinical trial, REDUC, which investigated the use of Vacc-4x to stimulate the immune system in
combination with Celgene’s HDAC inhibitor Istodax® (romidepsin) as latency reversing agent to reactivate the virus in the latent HIV reservoirs.
In Q3 2016, Bionor put all preparatory activities of the planned clinical program on hold and initiated a strategic review of Vacc-4x, and the clinical
development plan to ensure it is up to date going forward. For this Bionor has engaged a group of highly experienced international HIV scientific, clinical
and commercial experts to propose updated development plans going forward. This process is currently ongoing and is done in close collaboration with
the company. The same expert group is engaged in the strategic partnership assessment.
| 41APPENDIX
Bionor profit and loss (IFRS)
Summary consolidated statement of comprehensive income
For the nine months
ended For the year ended
30 September 31 December
(unaudited) (audited) (audited) (audited)
Amounts in NOK thousands 2016 2015 2014 2013
Revenues 258 85 1,766 4,200
Cost of goods sold - - (1,222) (1,706)
Employee Benefit Expenses (28,391) (26,465) (13,781) (27,058)
Depreciation and amortization (9,438) (11,287) (11,175) (11,524)
Other operating expenses (33,160) (59,786) (45,064) (51,223)
Total operating expenses (70,989) (97,538) (71,242) (91,511)
Operating loss (70,730) (97,453) (69,476) (87,312)
Net loss (70,887) (96,726) (68,054) (85,434)
Earnings (loss) per share (NOK) (0,39) (0.39) (0.29) (0.42)
| 42APPENDIX
Bionor balance sheet (IFRS)
Summary consolidated statement of financial position
As at 30 September As at 31 December
2016 2015 2014 2013
Amounts in NOK thousands (unaudited) (audited) (audited) (audited)
ASSETS
Non-current assets
Goodwill 8,715 8,715 8,715 8,715
Intangible assets 39,812 47,894 58,670 69,445
Property, plant and equipment 1,660 3,634 2,311 2,710
Other long term receivables 2,527 3,880 971 954
Total non-current assets 52,713 64,122 70,666 81,824
Current assets
Accounts receivables 31 18 1,383 233
Other short term receivables 12,175 22,710 22,297 7,221
Cash and cash equivalents 40,422 10,571 93,096 107,506
Total current assets 52,628 33,300 116,776 114,961
TOTAL ASSETS 105,341 97,422 187,443 196,785
EQUITY AND LIABILITIES
Equity
Share capital 86,067 62,328 62,082 56,457
Share premium 342,635 266,350 265,183 220,751
Other paid-in equity 6,274 5,539 4,409 5,973
Retained earnings (338,915) (268,008) (171,232) (103,178)
Total equity 96,061 66,209 160,441 180,003
Current liabilities
Interest bearing loans and borrowings - - - -
Trade and other payables 9,279 31,213 27,002 16,782
Total current liabilities 9,279 31,213 27,002 16,782
Total liabilities 9,279 31,213 27,002 16,782
TOTAL EQUITY AND LIABILITIES 105,341 97,422 187,443 196,785
| 43APPENDIX
Legal structure
Overview
Solon AS Dukat AS Hortulan AS MRD Holding AS John Galt Invest AS Alden AS
29,445 shares 13,555 shares 22,000 shares 18,000 shares 2,000 shares 15,000 shares
Solon Eiendom AS
90.1 % 50-100 % 100 %
Ciderhus1 Solon Eiendom SPVs Solon Næring SPVs
Development and offering of Solon Eiendom AS has several Solon Næring consist of 8 SPVs
small detached houses located in projects, all of which are
the “gardens” of existing organised in separate SPVs2 Two commercial properties
villas/houses (Fjordveien og Råholt), but also
Offering of large apartment some housing projects
Typically 4-10 units per project complexes and detached
houses/villas
Typically 40-120 units per
project
1 AWA Holding AS (Anders W. Andersen) owns the remaining 9.9 %
2 SPV = Single Purpose Vehicle
| 44You can also read