FULL YEAR 2020 RESULTS PRESENTATION - INGENIA COMMUNITIES GROUP - Presented by Simon Owen and Scott Noble 18 August 2020 - Bell Direct
←
→
Page content transcription
If your browser does not render page correctly, please read the page content below
Presented by Simon Owen and Scott Noble
                                                              18 August 2020

                                                Freshwater by Ingenia Lifestyle, QLD

INGENIA COMMUNITIES GROUP

FULL YEAR 2020 RESULTS PRESENTATION
Results summary
    Strong performance, impacted by COVID-19 from March

                   FINANCIAL                                                 DEVELOPMENT
                                                                             •   Settled 325 new homes – down only 3% on
                   •    Revenue of $244.2 million – up 7% on FY19
                                                                                 record FY19 result
                   •    EBIT $71.9 million – up 17% on FY19
                                                                             •   Average home price up 12% to $430,000
                   •    Underlying EPS 22.1 cents – up 5% on FY19
                                                                             •   Strong development pipeline – 3,015 home
                   •    Operating cash flow $67.2 million – up 13% on            sites owned or secured
                        FY19
                                                                             •   Commenced FY21 with 187 homes contracted
                                                                                 or deposited

                   STRATEGY                                                  OPERATIONS
                   •   Key strategic priority is positioning for lifestyle   •   Rental revenue continuing to grow – up 5% on
                       sector leadership and scale                               FY19 to $94.5 million

                   •   Lifestyle rental base increased by 24% - more         •   Ingenia Lifestyle margin expansion – up 40
                       than 4,000 sites generating stable cash flows             basis points to 39.7%

                   •   Significant balance sheet capacity for portfolio      •   Ingenia Gardens record high occupancy of
                       growth – multiple opportunities currently under           94.4%
                       assessment                                            •   Ingenia Holidays revenue down 6% on FY19,
                                                                                 reflecting forced park closures April - June

2     FY20 RESULTS PRESENTATION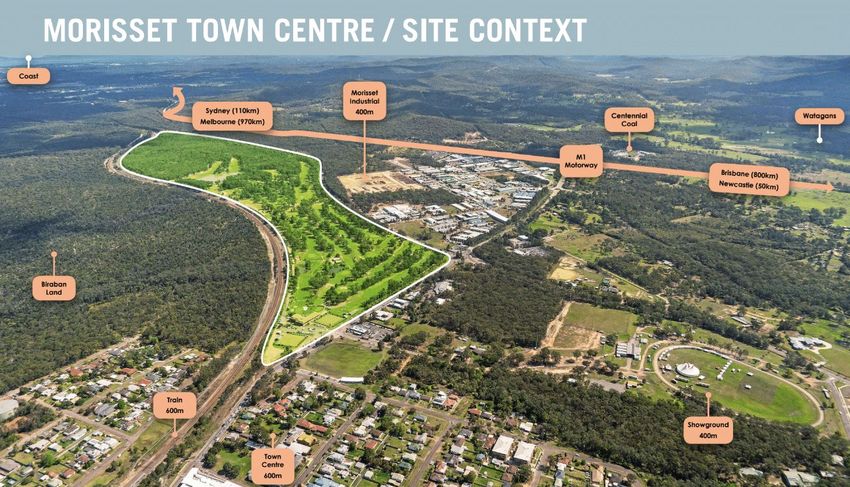
Business model demonstrating resilience
    Quick, agile response reduced impact of COVID-19

    Prior to March 2020 the business was performing well and expected to deliver another year of record growth

    COVID-19 and associated restrictions have created unprecedented challenges and ongoing uncertainty in operating conditions
    •     Restrictions on travel slowed settlements and home inspections – consumer sentiment remains cautious1

    •     Border closures and park shut downs significantly impacted Holidays performance from late March to early June1

    Ingenia responded rapidly, adjusting operations and managing capital to support the business

    •     Priority on staff, resident and guest health and safety
             •     Revised operating protocols established
             •     Restricted access to communities in line with Government requirements
             •     Some modest additional costs – PPE, security, food and beverage

    •     Active management of costs – temporary salary reductions (Board, head office and support office), deferral of some capital expenditure and reduction
          in variable costs

    •     Sales process adjusted to support customer engagement as home inspections ceased or were restricted – focus on virtual tours and outbound call
          centre to maintain engagement

    •     Successfully raised equity ($178 million) to provide additional capacity and support growth

    To date, no incidences of COVID-19 among residents, guests or staff

    1.   The principal financial impacts of COVID-19 (reduced tourism revenues and slower home settlements) were offset by the introduction of cost saving measures and the JobKeeper subsidy of $4.4 million which allowed the Group to re-engage the
         majority of employees stood down at the start of the pandemic.

3         FY20 RESULTS PRESENTATION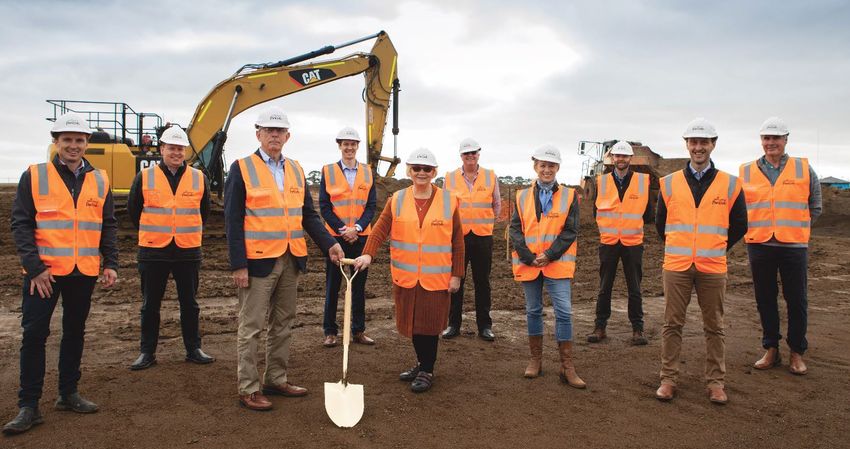
Lifestyle and Gardens rental inflows remained intact through COVID-19

    Compared to other commercial real estate classes Ingenia has performed strongly

                                                                                                           Rent Collections

               110.0%

                                    100.0%     100.0%     100.0%                                                                          100.0%
               100.0%

                                                                                                   88.0%      89.0%                                   89.0%
                 90.0%
                                                                                                                                                                                                                    86.0%
                                                                                       84.6%
                                                                                                                                                                 82.0%
                 80.0%

                                                                                                                                                                                                         71.0%
                 70.0%

                                                                                                                                                                                              61.2%
                 60.0%

                 50.0%
                              Ingenia (Lifestyle and Gardens)                                     Office                                           Industrial                                            Retail
                                                                                                                April     May      June

    Source: Office, Industrial and Retail rent collection from CBRE – Total rental payments collected by CBRE in Australia and New Zealand (as a percentage of the Jan – March average – indicative of pre-COVID normalised).

4         FY20 RESULTS PRESENTATION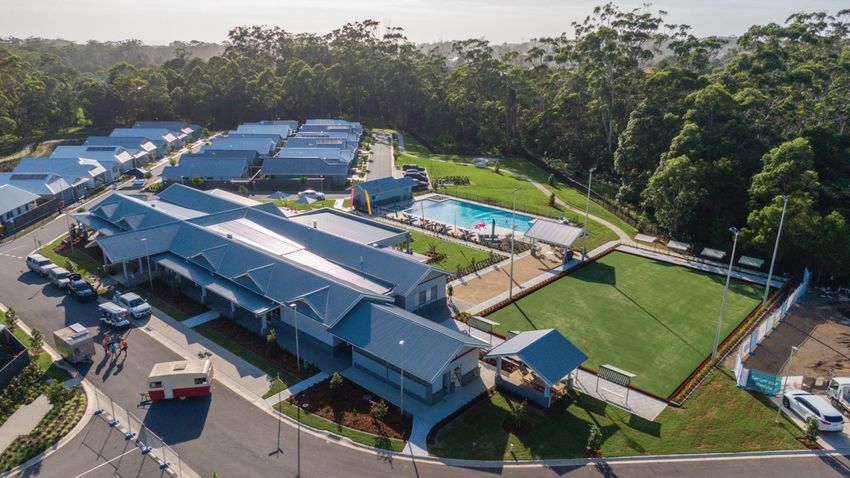
Business overview
    Rental base growing through acquisition and development

                                                                      $
                                                                 Rent base

                                                                                                                                                                          $1.1B
                                                               $2 million/pw

                           Over 9,900
                        Income producing
                              sites
                                                                                                                                                                                  Property Portfolio

                            3,015
                     Development sites                                                                                                                                                 74
                                                                                                                                                                                     Communities
                    9 communities under
                         development

                                                                                                                                                                                                37     Lifestyle and Holidays
                                                                    >971,000
                                                                 ‘room nights’ p.a.
                                                                                                                                                                                                26     Ingenia Gardens
                                                                  Cabins, caravan
                                                                    and camping                                                                                                                  9     Allswell Communities (funds)

      Note: Property portfolio includes balance sheet assets, post 30 June acquisitions, communities owned by managed funds and the Group’s Joint Venture with Sun Communities.
                                                                                                                                                                                                 2     Joint Venture (greenfield)
      Excludes assets held for sale.
5     FY20 RESULTS PRESENTATION
Sector remains attractive as cash flows demonstrate resilience
      Ingenia remains well placed to grow
                                                          Competitive Landscape                                               Market for lifestyle communities
                                                              (Total Sites)                                                   increasingly competitive
                                                                                                                              •   New entrants emerging
        Long Term         Tourism         Development Pipeline                                                                •   Quality lifestyle communities remain tightly held
14000                                                                                                                             – cap rates tightening supported by resilience
                                                                                                                                  of cash flows
12000
                                                                                                                              •   Opportunities to acquire land and
10000
                                                                                                                                  tourism/mixed-use sites

                                                                                                                              •   Significant ‘forced’ sellers yet to emerge
8000

                                                                                                                              •   Ingenia maintains a strong competitive position
6000
                                                                                                                              Proven ability to acquire, manage and
4000                                                                                                                          develop lifestyle, tourism and mixed-use
                                                                                                                              assets
2000
                                                                                                                              •   Dedicated acquisitions team delivering a
   0                                                                                                                              pipeline of established assets and greenfield
                                                                                                                                  sites

                                                                                                                              •   Access to capital and efficient assessment and
                                                                                                                                  transaction capability

                                                                                                                              Transaction activity anticipated to increase
  Source: Ingenia analysis. pen = Pension Fund; gov = Government; mut = Mutual Fund; asx = ASX listed; unl = Unlisted fund.   as uncertainty remains
  6       FY20 RESULTS PRESENTATION
Acquisitions will contribute to future growth in cash flows
    Focus on sector leadership and scale supported by significant funding capacity
    Over $100 million invested in established communities and land adjacent             Pipeline expanding - further transactions well progressed
    to existing sites over the past 13 months                                           •    Expect to settle on third Development Joint Venture acquisition 1H21
    •   Over FY20, on balance sheet acquisitions added 577 income                       •    Eleven communities under contract or offer
        producing sites across three communities
    •   Funds management platform contributed a further 1,584 income                    Remaining funds from May 2020 equity raising expected to be deployed
        producing sites to the Group’s platform (with last right to acquire)            over next 12-18 months as identified and new acquisition opportunities
    •   Sunnylake Shores on NSW Central Coast (acquired July 2020) adds                 progress
        90 yielding home sites and 38 approved development sites
    •   A development site in Ballarat, Victoria with 163 approved home sites
        was acquired in July 2020 (plus DA lodged for additional 90 sites)

        Sunnylake Shores ($16.3 million) –                  Bevington Shores ($25 million)                                 Ballarat ($7 million)
               acquired Jul 2020                                 – acquired Dec 2019                                       - acquired Jul 2020

7        FY20 RESULTS PRESENTATION
Development Joint Venture to acquire large DA approved site
    Approval in place for 427 homes on NSW Central Coast
    •   Ingenia has been working with the vendor
        on a large residential land lease
        development site on the former Morisset
        golf course

        •   It will form part of a community hub
            with commercial and entertainment
            precincts

    •   Council has now issued development                                        Land lease community
        approval for a land lease community of
        427 sites
                                                                                              Caravan park
    •   The acquisition will expand the Group’s
        presence in a key market, building on the
        Group’s highly successful Grange              Major culture event space
        community and Central Coast cluster                                                         Family and community

    •   Morisset is located near the shores of
        Lake Macquarie and only an hour north of
        Sydney

        •   It is the largest town in the area, and
            has a median house price of above
            $500k

    •   Ingenia has the right to acquire Sun                                        Parkside (Ballarat) acquired for $7 million in July 2020
        Communities’ (NYSE:SUI) share in the
        project once sold down

8       FY20 RESULTS PRESENTATION
Ingenia Lifestyle Plantations, NSW

    Performance and Capital Management
9    FY20 RESULTS PRESENTATION
Key financials
 Growth in EBIT despite impact of COVID-19

 KEY FINANCIAL METRICS                                     FY20                 FY19
                                                                                                                   Revenue and EBIT growth driven by increase in rental sites from
 Revenue                                                 $244.2m              $228.7m                      7%
                                                                                                                   development and acquisition, increased development margin and cost
                                                                                                                   management
 EBIT1                                                   $71.9m                $61.5m                     17%

 Underlying profit1                                      $59.1m                $47.2m                     25%      EPS growth impacted by significant increase in weighted average securities
                                                                                                                   on issue as a result of equity raisings
 Underlying EPS1                                           22.1c                 21.0c                     5%
                                                                                                                   Statutory profit impacted by fair value movements on investment
 Statutory profit                                        $31.5m                $29.3m                      7%      properties, including expensing of acquisition costs, COVID-19
                                                                                                                   adjustments and realisation of development profits
 Statutory EPS                                             11.8c                 13.0c                    (9%)
                                                                                                                   Cash flow driven by an increase in rental sites through acquisition and
 Operating cash flow                                     $67.2m                $59.3m                     13%      development and increased average new home sales price, partially offset
                                                                                                                   by holiday park closures due to COVID-19
 Distribution per security                                 10.0c                 11.2c                  (11%)

                                                       30 JUN 20             30 JUN 19                             Gross distribution up 13% on prior year. Distribution reduced on a cents
                                                                                                                   per security basis due to impact of additional securities on issue and
 Net Asset Value (NAV)
                                                           $2.90                 $2.65                     9%      prudent capital management
 per security

 1.   EBIT, underlying profit and underlying EPS are non-IFRS measures which exclude non-operating items such as
      unrealised fair value gains/(losses) and gains/(losses) on asset sales.

10       FY20 RESULTS PRESENTATION
Underlying earnings growing as business expands
EBIT FY20 FY19
Lifestyle and Holidays Operations $29.8m $27.4m 9% Expanding rental base – driven by recent acquisitions, new home
settlements and additional rental cabins
Lifestyle Development $39.9m $33.4m 19%
Ingenia Gardens $10.2m $10.0m 2%
Development earnings increased with higher average sales price and
Fuel, Food and Beverage $0.6m $0.6m - above ground development margins driven by large scale, high margin
projects delivering increasing sales
Other1 $1.3m $0.2m NM
Portfolio EBIT $81.8m $71.6m 14%
Corporate costs ($9.9m) ($10.1m)
EBIT $71.9m $61.5m 17% Margin expansion driven by scale benefits being realised
EBIT margin 29.4% 26.9% 250bp
1. Other includes contribution from the development Joint Venture with Sun Communities, contribution from the funds
management business and legacy assets.
71.9
Historic Performance - EBIT ($m)
61.5
48.8
32.1
24.2
18.1
12.1
FY 14 FY15 FY16 FY17 FY18 FY19 FY20
11 FY20 RESULTS PRESENTATIONCapital management
Capital position enhanced
DEBT METRICS 30 JUN 20 30 JUN 19
Loan to value ratio (covenant 2x) CAPACITY MATURITY
DEBT3
Total debt facility $450.0m $350.0m
Drawn debt $73.0m $241.0m
Net debt2 $62.2m $220.8m Funding growth
1. Proceeds from new equity issuance over FY20 - $328 million
2. Increased facility capacity by $100 million to $450 million – common
Successful $178 million May 2020 equity raising provides terms deed amended, providing improved covenants and terms (LVR
increased from 50% to 55%)
significant acquisition capacity – over $370 million in cash
and available undrawn debt at 30 June 3. Over $370 million in cash and available undrawn debt
4. Secured new debt within the Development Joint Venture
1. Gearing ratio calculated as net debt (borrowings less cash) over total tangible assets 5. Growing operating cash flows
(total assets less cash and intangible assets).
2. Excludes finance leases.
3. All in cost of debt 3.2%, including cost of undrawn available facilities as at 30 June 2020. Hedging
The Group’s interest rate exposure is fully variable at 30 June 2020
12 FY20 RESULTS PRESENTATIONGrowth in value across core portfolios
Lifestyle capitalisation rates continue to compress
• Independent valuation of 15 assets in 2H20
Av. Cap Rate Av. Cap Rate Jun 20
Portfolio • Ingenia Gardens and Lifestyle and Holidays portfolio value up 3.6%
Jun 201 Jun 191 Book Value
($27.4 million) like for like FY19-20
Lifestyle and Holidays 7.44% 7.58% $804.1m2
• Latitude One (Lifestyle) now valued at 5.90% cap rate
Ingenia Gardens 9.72% 10.00% $139.9m • Investment property impacted by write-off of transaction costs and
reduction in development value as new homes are sold and embedded
1. Excludes new acquisitions and leasehold assets.
2. Includes leasehold assets, gross up for finance leases and JV liabilities. Excludes assets held for sale. development profit is realised
• External valuers have not observed any adverse impact of COVID on
cap rates, but have included a separate COVID-19 NOI shortfall
adjustment to a number of tourism assets
Continued cap rate sharpening across Lifestyle and Holidays portfolio* over Jun 17-20
10.5%
10.0%
9.5% (40)bp
(28)bp (7)bp (3)bp
9.0% (20)bp (7)bp
(42)bp
8.5% (34)bp (14)bp
8.0% (59)bp
(39)bp
7.5% (12)bp
7.0%
6.5%
6.0%
Lifestyle & Rental Holidays Mixed Portfolio
* Excludes acquisitions and leasehold assets. Jun-17 Jun-18 Jun-19 Jun-20
13 FY20 RESULTS PRESENTATION 13Ingenia Rental Chambers Pines, QLD Performance core rental business demonstrating resilience 14 FY20 RESULTS PRESENTATION
Ingenia Lifestyle and Holidays
 Expanding rental base in capital city and coastal markets

                                                                                                                           •   Permanent sites increased by 24% over the past 12 months
 KEY DATA                                                      30 JUN 20                       30 JUN 19
                                                                                                                           •   Portfolio enhanced as new communities acquired and developments
 Total properties1                                                    37                              35
                                                                                                                               progress
 Permanent sites                                                   4,034                           3,252
                                                                                                                               •   $76 million in acquisitions FY20, including 577 income producing
 Annual sites                                                        739                             764                           sites
 Holiday sites                                                     2,465                           2,383                       •   Sunnylake Shores settled July 2020 – additional 90 homes and
                                                                                                                                   38 approved development sites
 Development sites2                                                3,015                           3,713
                                                                                                                           •   Focus on additional acquisitions – further assets under due diligence,
 1.    Includes assets held for sale. Excludes Joint Venture and fund assets. Ingenia divested Mudgee Valley in 1H20.
 2.    Development sites include all potential sites (on balance sheet, through JV and funds - under option or secured).       including established lifestyle communities with in place rents
       Excludes assets held for sale and sites for tourism development.

                                                                                                                           •   Development pipeline providing future growth in rental streams
                               Growth in Income Producing Sites1
                                                                                                                               •   Acquired land adjacent to Avina, Rivershore Resort and Hervey
     8,000
                                                                                                                                   Bay, providing expansion potential at key communities
     7,000

     6,000
                                                                                                                               •   Development approval for additional 380 homes received FY20,
                                                                                                                                   including 196-home expansion of Ingenia Lifestyle Lara
     5,000

     4,000

     3,000

     2,000

     1,000

        -
                 FY13        FY14          FY15         FY16          FY17         FY18          FY19         FY20

15           FY20 RESULTS PRESENTATION
Ingenia Lifestyle and Holidays
Rental income growing
KEY DATA FY20 FY19 Lifestyle and Holiday rental income up 6%
Permanent rental income $31.8m $25.0m 27% • Permanent rental income not impacted by COVID-19 – no loss in rent or
increase in bad debts
Annuals rental income $4.5m $4.7m (4%)
• Temporary closure of holiday parks resulted in loss of tourism income
Tourism rental income $35.9m $38.0m (6%) (partially offset by cost savings and JobKeeper payments)
Other rental income - $0.4m NM • Margin positively impacted by growth in portfolio and cost management
Total rental income $72.2m $68.1m 6%
Continuing to grow permanent rental income, up 27%
Other income1 $4.5m $3.6m 25% • Additional 528 homes acquired FY20
Total income $76.7m $71.7m 7% • New homes – 318 settled and occupied (excluding Freshwater (JV))
(adds $3 million rent per annum)
EBIT $29.8m $27.4m 9% • Average weekly rent increase of 3.6% (like for like) - average now $183
per week
EBIT margin2 39.7% 39.3% 40bp
30 JUN 20 30 JUN 19 Future growth
Book value3 $672.8m $565.3m • Acquisition of Sunnylake Shores July 2020 – further acquisitions
targeted with significant funding capacity in place
1. Other income represents commercial rent, utility recoveries and non rental services. • Rollout of new rental homes across existing communities to continue
2. Stabilised margin, excludes greenfield assets under development.
3. Excludes value attributed to development (30 Jun 20; $131.3m; 30 Jun 19: $149.4m).
(90+ planned FY21)
16 FY20 RESULTS PRESENTATIONIngenia Holidays
Well positioned to capture domestic demand
Holidays revenue down only 6% on prior corresponding period
• Closure of some parks on NSW South Coast over December/January and FY20 FY19
of all parks from late March to June significantly reduced revenue
opportunity Cabins
• Cost management, access to JobKeeper and transition of some sites to Occupancy 55% 59%
short-term rental partially offset lower earnings and cost of re-employing
holiday park staff REVPOR1 $135 $149
Forward bookings tracking ahead of pcp and have been responsive Sites
to easing of restrictions
Occupancy 46% 50%
• Booking pace strong post June restrictions easing
REVPOR1 $46 $47
• Marketing of health and safety protocols to underpin guest confidence –
Ingenia Clean, contactless check-in
Operating conditions remain uncertain; but demand for domestic
travel is anticipated to increase
• Portfolio well positioned for intrastate travel which is least impacted by
restrictions – majority of current forward bookings are intrastate
• Campaigns bolstering desire to holiday ‘close to home’ – holiday parks
experiencing increasing interest as people seek ‘low rise’ alternatives
• Uncertainty requiring ongoing flexibility in bookings and driving shorter
booking lead times but outlook positive
1. REVPOR: Revenue per occupied room.
17 FY20 RESULTS PRESENTATION 17Ingenia Gardens (seniors rental)
Strong, stable, government supported rent
Record high occupancy of 94.4% supporting ongoing
KEY DATA FY20 FY19 stable cash flows
Total revenue $25.0m $24.6m • Residents attracted to supported environment during COVID-19
EBIT $10.2m $10.0m • Reduced ‘move-outs’ contributed to occupancy growth
EBIT margin 40.7% 40.7% • Strong rent collections with no increase in defaults
30 JUN 20 30 JUN 19
Total properties 26 26 Health and safety of residents key priority
Total units 1,376 1,376 • Protocols in place to monitor and restrict movement in and out of
Av. weekly rent $342 $342 communities, including contact tracing and restricted access
Occupancy 94.4% 90.8% • Meals service adjusted to reduce resident contact
30 JUN 20 30 JUN 19 • Provision of activities while social distancing to support health and
wellbeing
Book value $139.9m $132.1m
Ingenia Care – a key service and market differentiator
• Over 400 current residents accessing the service
• Average resident tenure for Care clients now 4 years
Presently trading at record high occupancy
Provides attractive yield supported by stable rents
• Currently assessing opportunities to repurpose vacant premises into
Ingenia Gardens communities
18 FY20 RESULTS PRESENTATIONFunds Management Platform
Generating new revenue streams and capital efficiency
Integration of Eighth Gate platform complete Funds Management is a key growth platform
• Established platform acquired August 2019 – nine communities valued • Appetite from investor base for investment opportunities
at $136 million under management
• Launch of new fund delayed until 2021 due to the impact of
• Added 1,600 income producing sites located in key locations across COVID-19
Victoria, Queensland and NSW
• Funds to focus on smaller, mixed-use communities
• Generated fee income of $1.8 million
• Accretive to Ingenia earnings and Return on Equity
• Ingenia retains the right to acquire assets upon Fund wind-up
Fund performance generally in line with expectations,
recognising impact of operating environment
• Asset strategies now in place for each Fund
• Ingenia acquired the 163-site development held by Fund 6 in July 2020
– Eighth Gate now focussed on stabilised yield
RIVERBREEZE HOLIDAY PARK, NSW
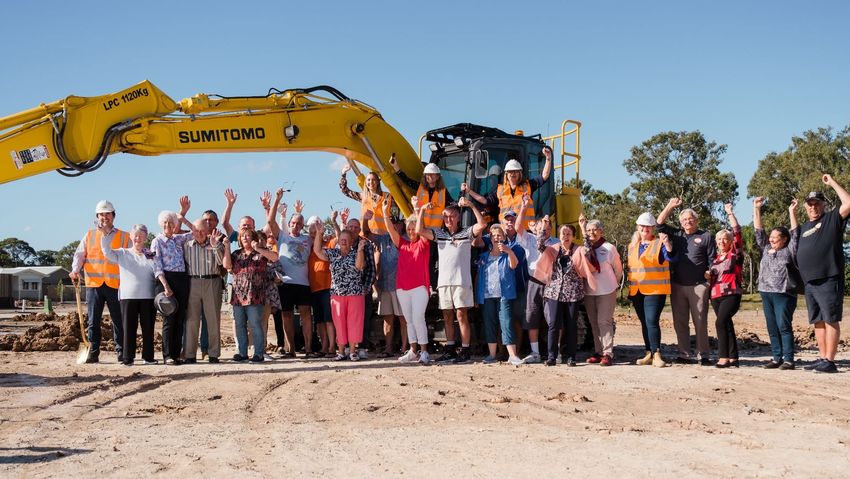
19 FY20 RESULTS PRESENTATIONSOD turning event at Ingenia Lifestyle Hervey Bay, QLD Development 20 FY20 RESULTS PRESENTATION
Development
 Settlement volumes impacted by restrictions, average home sales price increased
                                                                                                                New home settlements down slightly due to COVID-19 pandemic
 KEY DATA                                              FY20                 FY19
                                                                                                                •   On track for record sales prior to COVID-19
 New home settlements1                                  325                  336                       (3%)
                                                                                                                •   Restrictions slowed sales inspection and settlements – pivoted to new
 Av. new home sales price1                                                                                          sales methods with online inspections
                                                        430                  384                       12%
 ($’000)
 Deposited/Contracted
                                                        187                  223                     (16%)
                                                                                                                EBIT margin up 340 basis points
 (at 30 Jun) 1
                                                                                                                •   Margin supported by higher margin greenfield projects and scale leverage
 Development EBIT                                      $39.9m              $33.4m                      19%
                                                                                                                Greenfield strategy delivering strong sales and creating high quality,
 EBIT margin                                           31.5%                28.1%                    340bp
                                                                                                                long life assets
                                                   30 JUN 20            30 JUN 19                               •   Latitude One settled 93 homes in FY20 – average home price now
                                                                                                                    $580,000. Homes deposited at >$900,000
 Book value2                                        $131.3m               $149.4m
                                                                                                                •   Plantations (56 settlements at average price of $455,000) and Hervey Bay
 1.    Sales price inclusive of GST. FY20 includes Freshwater (Joint Venture).
 2.    Book value for development property is based on DCF methodology and will fluctuate through the life of       (22 settlements at average price of $315,000) progressing well
       a project.

                                  New Home Settlements
                                                                                                                Continuing to expand settlements pipeline and product mix
 400
 350
                                                                                                                •   Strong start to FY21 with 37 settlements YTD
 300                                                                                                            •   Rebuilding momentum in sales pipeline as restrictions ease - 205 deposits
 250
                                                                                                                    and contracts in place at 16 August 2020
 200
 150                                                                                                            •   Expanding product mix to broaden resident base and respond to market
 100                                                                                                                conditions - new
Development Joint Venture with Sun Communities
Generating new revenue streams and capital efficiency
First settlements at Freshwater (Burpengary, QLD) at end FY20 Targeting growth in FY21; additional acquisitions progressing
• First residents settled in April 2020 • Expect to finalise acquisition of 427 home DA approved site at Morisset
on NSW Central Coast in 1H21
• Stage two homes to commence in September 2020
• Conditional contract for north west Melbourne site (DA pending)
• Construction program well progressed – clubhouse to be completed expected to settle by December 2020
by December 2020
• Non recourse debt funding in place, supporting capital efficient
development and further investment
22 FY20 RESULTS PRESENTATIONPipeline supporting ongoing development returns
VACANT
DEVELOPMENT COMMENCEMENT TO COMPLETION
SITES REMAINING1
KEY PROJECTS Jun 20 Jun 21 Jun 22 Jun 23
Latitude One 214 Strong sales – 59 approved sites remaining Additional 155 sites (STA)
Greenfield projects
Plantations 83 Second greenfield project – 56 settlements FY20
Hervey Bay 257 Third greenfield project – selling well. Additional land available
Freshwater (JV) 128 First settlements late FY20
Ballarat 163 Acquired July 2020. DA lodged for additional 90 sites
Lara 196 Expansion of successful community
Bethania 131 Large scale project with steady demand
Chambers Pines 271 Large scale project with steady demand
Other projects in market 8 Projects in final sell down or located in regional areas
Sunnylake Shores 38 Acquired July 2020
Future Projects
Ingenia owned/optioned land 358
Greenfield sites2 1,168
Total 3,015
1. Includes sites subject to approval.
2. Includes sites secured or optioned by the Joint Venture.
Note: Timing and prices are indicative and subject to change. Includes secured and optioned assets.
23 FY20 RESULTS PRESENTATIONSustainability
ESG initiatives and reporting are a key focus for Board and Current projects
Management
• Audit and Risk Committee oversees the Group’s sustainability
program and reporting, and recommends to the Board
• Internal working group driving identification of initiatives, key
projects and reporting
First sustainability disclosures published July 2020 via
Rollout of solar across 50 established Installation of LED lighting across
Group website communities to reduce non-renewable holiday parks
• Focus on Group’s objectives, current initiatives and roadmap to energy consumption
evolve this important area of reporting
• Includes outline of initiatives currently underway
Future focus
• Establishing environmental objectives and performance targets
• Continuing key projects
• Ongoing stakeholder feedback ‘Waterwise’ program in holiday parks Extend sustainable home design in
to reduce water use new communities through
• Evolution of reporting participation in Green Star for Homes
Early Access Program
Our success is dependent on efficiently utilising land to create cohesive communities and focusing on the well-being of our residents.
Delivering a higher quality of life for our residents is intrinsically linked to sustainable investor returns
24 FY20 RESULTS PRESENTATION 24Strategy and Outlook 25 FY20 RESULTS PRESENTATION
Outlook – market uncertainty remains but business well placed
 Operating conditions remain uncertain - changes in travel restrictions, health
 advice and border closures expected to continue

 •   Operating protocols are in place to flex operations and respond to health advice, including
     contact tracing and restricting access to communities
 •   Flexibility in work practices and increased use of technology supporting resident and staff
     engagement

 While continuing to adapt as the scope and nature of restrictions change, the
 Group is well placed and is maintaining a focus on the future

 •   Rent from residents continuing uninterrupted, providing stable cash flows
 •   Holidays demand responsive to easing of restrictions
       • All parks open - leveraged to domestic travel
       • Forward bookings up on prior year
 •   Sales momentum building in NSW and QLD where restrictions have eased
       • 37 settlements year to date with 205 contracts and deposits in place
 •   Balance sheet strength and significant funding capacity support growth
       • Actively pursuing scale and sector leadership through acquisition and development

 Long term fundamentals support demand for the Group’s core business of
 affordable seniors housing – near term economic outlook and operating
 restrictions present challenges

26    FY20 RESULTS PRESENTATION
FY21 focus
Continue to respond to operating environment, maintaining focus on resident, guest and employee health and safety
Expand in key markets through acquisition and development – move to clear sector leadership
Improve performance of existing assets to drive growth in rental revenue
Continue focus on sales and marketing to extend sales pipeline and deliver new rental contracts
Capitalise on opportunities to expand development pipeline and accelerate development of new communities
Execute Joint Venture business plan, delivering opportunities for capital light growth and additional revenue streams
Deliver returns for funds management investors
In light of ongoing uncertainty, FY21 guidance cannot be provided at this time
27 FY20 RESULTS PRESENTATIONIngenia Lifestyle Latitude One, NSW Appendices 28 FY20 RESULTS PRESENTATION
Appendix 1
 Underlying profit

                                            FY20     FY19
                                            ($M)     ($M)
Lifestyle and Holidays – Operations         29.8     27.4

Lifestyle Development                       39.9     33.4

Ingenia Gardens                             10.2     10.0

Fuel, food & beverage                        0.6      0.6

Other                                        1.3      0.2

Portfolio EBIT                              81.8     71.6

Corporate costs                             (9.9)    (10.1)

EBIT                                        71.9     61.5

Share of income/(loss) of a Joint Venture    0.1     (1.2)

Net finance costs                           (6.6)    (7.6)

Income tax expense                          (6.3)    (5.5)
Underlying profit – Total                   59.1     47.2

Statutory adjustments (net of tax)          (27.6)   (17.9)

Statutory Profit                            31.5     29.3

29      FY20 RESULTS PRESENTATION
Appendix 2
EBIT and underlying profit by segment
LIFESTYLE LIFESTYLE INGENIA FUEL, FOOD CORPORATE
($M) TOTAL
OPERATIONS DEVELOPMENT GARDENS AND BEVERAGE AND OTHER1
Rental income 72.2 - 22.3 - - 94.5
Lifestyle home sales - 126.8 - - - 126.8
Catering income - - 2.5 - - 2.5
Fuel, food and beverage income - - - 12.7 - 12.7
Other income 4.5 - 0.2 - 3.0 7.7
Total segment revenue 76.7 126.8 25.0 12.7 3.0 244.2
Property expenses (18.2) (1.0) (6.7) (0.7) (0.8) (27.4)
Cost of lifestyle homes sold - (66.9) - - - (66.9)
Employee expenses (22.4) (12.6) (6.0) (2.9) (6.1) (50.0)
Service station expenses - - - (6.3) - (6.3)
All other expenses (6.3) (6.4) (2.1) (2.2) (4.7) (21.7)
Earnings Before Interest and Tax (EBIT) 29.8 39.9 10.2 0.6 (8.6) 71.9
Segment margin 39.7%2 31.5% 40.7% 4.7% NM 29.4%
Share of profit/(loss) of Joint Venture 0.1
Net finance expense (6.6)
Income tax expense (6.3)
Underlying profit 59.1
1. Includes Joint Venture and funds management.
2. Stabilised margin, excludes greenfield assets under development.
30 FY20 RESULTS PRESENTATIONAppendix 3
Cash flow
FY20 FY19
($M) ($M)
Opening cash at 1 July 20.2 14.5
Rental and other property income 116.1 107.4
Property and other expenses (102.7) (93.3)
Net cash flow associated with lifestyle home development 59.5 55.7
Net borrowing costs paid (9.3) (8.9)
Government subsidy 2.9 -
All other operating cash flows 0.7 (1.6)
Net cash flows from operating activities 67.2 59.3
Acquisitions of investment properties (85.6) (78.8)
Purchase of business & financial assets (19.8) -
Net proceeds from sale of investments properties 2.6 32.2
Investment in Joint Venture (4.2) (12.8)
Capital expenditure and development costs (77.4) (66.0)
Purchase of plant, equipment and intangibles (2.7) (1.0)
Net cash flows from investing activities (187.1) (126.4)
Net proceeds from/(repayment of) borrowings (168.0) 11.6
Net proceeds from equity placements 318.5 86.2
Distributions to security holders (28.9) (24.3)
All other financing cash flows (11.1) (0.7)
Net cash flows from financing activities 110.5 72.8
Total cash flows (9.4) 5.7
Closing cash at 30 June 10.8 20.2
31 FY20 RESULTS PRESENTATIONAppendix 4
Consolidated balance sheet
30 JUN 20 30 JUN 19
($M) ($M)
Cash 10.8 20.2
Inventories 36.2 36.0
Investment properties 943.9 846.8
Investment in Joint Venture 15.9 11.6
Other financial assets 13.9 2.3
Assets held for sale 32.6 12.8
Other assets 39.5 23.2
Total assets 1,092.8 952.9
Borrowings (excluding lease liabilities) 73.0 241.0
Derivatives - 2.5
Liabilities held for sale 5.2 5.7
Other liabilities 71.6 78.0
Total liabilities 149.8 327.2
Net assets 943.0 625.7
Net asset value per security ($) 2.90 2.65
32 FY20 RESULTS PRESENTATIONAppendix 5
Reconciliation: underlying profit to statutory profit
Underlying NPAT to Statutory NPAT
70
60
59.1 4.8
16.1
50
40
$m
1.5
8.6
30
3.3 31.5
20
10
0
Underlying NPAT Transaction costs / Stamp Valuation of Investment Valuation of Vendor Profit Impairment of Non Core and Other Tax Benefit Statutory NPAT
Duty Properties Share Other Assets
Note: Numbers are tax effective.
33 FY20 RESULTS PRESENTATIONAppendix 6
Capitalisation rates have progressively tightened
Lifestyle and Mixed-use Communities
11.50%
10.50% Crystal Cascades,QLD Murray River,NSW
Hervey Bay,QLD
Implied cap rate %
9.50% Big4 Mudgee,NSW
Grange,Jun16
8.50%
Sunshine,NSW
Aspley,QLD Capricorn Palms,QLD
Green Wattle,QLD
Colonial,QLD
7.50% Rivershore,QLD
Sunny Sand,VIC
Newport,NSW
Lake Munmorah,NSW
6.50%
Greenpoint,NSW Gateway Portfolio Bid Grange,Jun20
(Implied cap rate) RV Homebase,QLD
Bevington,NSW Cobaki,NSW
5.50%
Jan-16 Aug-16 Mar-17 Sep-17 Apr-18 Oct-18 May-19 Dec-19 Jun-20 Jan-21
Trend Line Trend Line Trend Line
Mixed-use Lifestyle The Grange Poly. (Mixed-use)
(Mixed-use) Poly. (Lifestyle)
(Lifestyle) Linear
(The (The Grange)
Grange)
Ingenia Lifestyle The Grange was the Group’s first lifestyle communities acquisition. Acquired in March 2013 at a 10% cap rate, the trend line shows the change in
capitalisation rate for this asset (both externally valued and internally assessed) over the past seven years.
34 FY20 RESULTS PRESENTATIONAppendix 7
Property snapshot
Ingenia Lifestyle and Holidays Lifestyle Development snapshot
snapshot
DA approved sites
Total properties 37
Ingenia 1,179
Total permanent homes 4,032
Sun Communities Joint Venture 675
Total annual sites 535
Sites requiring approval
Total tourism sites 2,398
Ingenia owned/optioned land 540
Jun 20 $183/ week
Ave rent – permanent homes Greenfield sites (inc. secured/optioned) 621
Jun 19 $168/ week
Total potential development sites 3,015
Jun 20 $132/ week
Ave rent – annual sites Ave new home sale price $430,000
Jun 19 $114/ week
Ave above ground new home margin > 45%
Tourism cabins Occupancy 55%
(12 months to Jun) REVPOR1 $135 per night
Tourism sites Occupancy 46%
(12 months to Jun) REVPOR1 $46 per night
1. Revenue per occupied room.
35 FY20 RESULTS PRESENTATION
INGENIA LIFESTYLE LAKE CONJOLA, NSWAppendix 7cont’d
Property snapshot
Ingenia Gardens snapshot Funds Management snapshot
Total properties 26 Permanent Tourism
Communities
Total units 1,376 sites sites
Jun 20 $342 • Federation Village, Glenroy, VIC 182
Ave. weekly rent • Federation Village, Sunshine, VIC 142 -
Jun 19 $342 • Federation Village Werribee, VIC 179
Jun 20 94.4% • Coastal Palms, Shoalhaven Heads, NSW 140 66
Occupancy
Jun 19 90.8% • Landsborough Pines, Landsborough, QLD 46 52
Daily resident meals served 1,445 • Tall Timbers, Shoalhaven Heads, NSW 82 129
Ave. resident tenure 3.1 years • Tomago River, Tomakin, NSW
25 414
• Wairo Beach, Lake Tabourie, NSW
• Riverbreeze, Moruya, NSW 5 124
801 785
INGENIA LIFESTYLE LAKE CONJOLA, NSW
36 FY20 RESULTS PRESENTATIONIngenia Holidays One Mile Beach, NSW
Contact
Information Scott Noble
Chief Financial Officer
Donna Byrne
General Manager Investor Relations
Tel: +61 2 8263 0538 Tel: +61 2 8263 0507
snoble@ingeniacommunities.com.au dbyrne@ingeniacommunities.com.au
Ingenia Communities Group
Level 9, 115 Pitt Street
Sydney NSW 2000
www.ingeniacommunities.com.au
37 FY20 RESULTS PRESENTATIONDisclaimer
This presentation was prepared by Ingenia Communities Holdings Limited (ACN 154 444 925) The forward looking statements included in this presentation involve subjective judgment and
and Ingenia Communities RE Limited (ACN 154 464 990) as responsible entity for Ingenia analysis and are subject to significant uncertainties, risks and contingencies, many of which are
Communities Fund (ARSN 107 459 576) and Ingenia Communities Management Trust (ARSN outside the control of, and are unknown to, the Group. In particular, they speak only as of the
122 928 410) (together Ingenia Communities Group, INA or the Group). Information contained date of these materials, they assume the success of the Group’s business strategies, and they
in this presentation is current as at 18 August 2020 unless otherwise stated. are subject to significant regulatory, business, competitive and economic uncertainties and
risks. Actual future events may vary materially from forward looking statements and the
This presentation is provided for information purposes only and has been prepared without
assumptions on which those statements are based. Given these uncertainties, readers are
taking account of any particular reader’s financial situation, objectives or needs. Nothing
cautioned not to place undue reliance on such forward looking statements.
contained in this presentation constitutes investment, legal, tax or other advice. Accordingly,
readers should, before acting on any information in this presentation, consider its The Group, or persons associated with it, may have an interest in the securities mentioned in
appropriateness, having regard to their objectives, financial situation and needs, and seek the this presentation, and may earn fees as a result of transactions described in this presentation or
assistance of their financial or other licensed professional adviser before making any transactions in securities in INA.
investment decision. This presentation does not constitute an offer, invitation, solicitation or
This document is not an offer to sell or a solicitation of an offer to subscribe or purchase or a
recommendation with respect to the subscription for, purchase or sale of any security, nor does
recommendation of any securities, including in the United States or any other jurisdiction in
it form the basis of any contract or commitment.
which such an offer would be illegal.
Except as required by law, no representation or warranty, express or implied, is made as to the
fairness, accuracy or completeness of the information, opinions and conclusions, or as to the
reasonableness of any assumption, contained in this presentation. By reading this presentation
and to the extent permitted by law, the reader releases each entity in the Group and its
affiliates, and any of their respective directors, officers, employees, representatives or advisers
from any liability (including, without limitation, in respect of direct, indirect or consequential loss
or damage or loss or damage arising by negligence) arising in relation to any reader relying on
anything contained in or omitted from this presentation.
38 FY20 RESULTS PRESENTATIONYou can also read