Fletcher Building Full Year Results to 30 June 2020 - ROSS TAYLOR - Chief Executive Officer - Bell Direct

Page created by Martin Barrett
 
CONTINUE READING
Fletcher Building Full Year Results to 30 June 2020 - ROSS TAYLOR - Chief Executive Officer - Bell Direct
Fletcher Building
Full Year Results to
30 June 2020
ROSS TAYLOR
— Chief Executive Officer

BEVAN MCKENZIE
— Chief Financial Officer

19 August 2020
Fletcher Building Full Year Results to 30 June 2020 - ROSS TAYLOR - Chief Executive Officer - Bell Direct
Important Information

This presentation has been prepared by Fletcher Building Limited and its group of companies (“Fletcher Building”) for informational purposes. This disclaimer
applies to this document and the verbal or written comments of any person presenting it.

This presentation provides additional comment on the Annual Financial Results 2020 dated 19 August 2020. As such, it should be read in conjunction with and
subject to the explanations and views given in that document. Unless otherwise specified, all information is for the year ended 30 June 2020.

In certain sections of this presentation, Fletcher Building has chosen to present certain financial information exclusive of the impact of significant items and/or
the results of the businesses divested in the year ended 30 June 2019. For the 12 months ended 30 June 2020, the Group’s financial statements are prepared
in accordance with the new lease accounting standard NZ IFRS 16, adopted from 1 July 2019. In prior periods, lease costs were fully reported in EBIT. Under
NZ IFRS 16, the two components of lease costs are reported separately: (1) the depreciation of right-of-use assets is reported in EBIT and (2) the deemed
interest portion of the lease liability is reported in lease interest expense. Financial tables in this presentation (where indicated) show both the reported result
for the prior period, as well as a pro forma restatement of the prior period to illustrate the impact of NZ IFRS 16 had it been applied and to allow for a like-for-
like comparison. A number of non-GAAP financial measures are used in this presentation which are used by management to assess the performance of the
business and have been derived from Fletcher Building’s financial statements for the 12 months ended 30 June 2020. You should not consider any of these
statements in isolation from, or as a substitute for the information provided in the Financial Statements for the 12 months ended 30 June 2020, which are
available at www.fletcherbuilding.com.

The information in this presentation has been prepared by Fletcher Building with due care and attention, however, neither Fletcher Building nor any of its
directors, employees, shareholders nor any other person given any representations or warranties (either express or implied) as to the accuracy or
completeness of the information and to the maximum extent permitted by law, no such person shall have any liability whatsoever to any person for any loss
(including, without limitation, arising from any fault or negligence) arising from this presentation or any information supplied in connection with it.

This presentation may contain forward looking statements, that is statements related to future, not past, events or other matters. Forward looking statements
may include statements regarding our intent, belief or current expectations in connection with our future operating or financial performance, or market
conditions. Such forward looking statements are based on current expectations, estimates and assumptions and are subject to a number of risks and
uncertainties, including material adverse events, significant one-off expenses and other unforeseeable circumstances. There is no assurance that results
contemplated in any of these projections and forward looking statements will be realised. Actual results may differ materially from those projected. Except as
required by law, or the rules of any relevant stock exchange or listing authority, no person is under any obligation to update this presentation at any time after
its release or to provide further information about Fletcher Building.

The information in this presentation does not constitute financial product, legal, financial, investment, tax or any other advice or a recommendation.

2       Fletcher Building Full Year Results Presentation | © August 2020
Fletcher Building Full Year Results to 30 June 2020 - ROSS TAYLOR - Chief Executive Officer - Bell Direct
Agenda
1. Results Overview                    Ross Taylor

2. Positioning for FY21                Ross Taylor

3. Financial Results                   Bevan McKenzie

4. Strategy and Outlook                Ross Taylor

 Fletcher Building
 Full Year Results Presentation 2020
Fletcher Building Full Year Results to 30 June 2020 - ROSS TAYLOR - Chief Executive Officer - Bell Direct
Navigated COVID-19 impacts, business set up for FY21, and
maintained momentum on key strategies and focus areas

             FY20                                                            FY21 set-up             FY21 and beyond

• Responded quickly to                                                 • Positioned the           • Strategy and growth
  COVID-19 impacts                                                       business cost base for     ambitions remain
• Focus on health and                                                    reduced activity in        unchanged
  safety of our people                                                   FY21                     • Ongoing focus on
• Strong customer                                                      • Accelerated key            profitability and
  service performance                                                    ecommerce activities       operational excellence
• Cash and balance                                                     • Ensured debt lines       • Complete Australia
  sheet remain strong                                                    and liquidity remain       portfolio
                                                                         strong and available       rationalisation
                                                                                                  • Clear historical
                                                                                                    Construction projects

4   Fletcher Building Full Year Results Presentation | © August 2020
Fletcher Building Full Year Results to 30 June 2020 - ROSS TAYLOR - Chief Executive Officer - Bell Direct
COVID-19 response to NZ lockdown and Australia restrictions
focused on health and safety, customer service, costs and cash

                                    Actions                                                FY20 Results
• Safely shut down and restarted NZ businesses and
  dealt with Australia restrictions
• Maintained customer service and performance
• COVID-19 Support Hub App launched,                                     • Serious injuries reduced by over 60% year-on-
  downloaded by 7,000 of our people, financial                             year
  hardship fund in place
                                                                         • COVID-19 impact resulted in Q4 operating
• Bridging Pay Programme implemented (govt                                 earnings of c$50m, a c$200m reduction on
  supported)                                                               expected Q4 earnings
• Strong focus on costs and cash:                                        • Strong operating cash flows of $410m
    > Capex reduced                                                      • Balance sheet strength preserved, liquidity
                                                                           $1.6b, net debt $0.5b
    > Board, Execs and GM remuneration reduced,
      no STI bonuses
    > Debtors / Creditors well managed
    > Negotiated reductions in both NZ property lease
      costs and other key supply agreements, all
      discretionary spend stopped
    > Interim dividend cancelled, share buyback
      programme suspended

5     Fletcher Building Full Year Results Presentation | © August 2020
Fletcher Building Full Year Results to 30 June 2020 - ROSS TAYLOR - Chief Executive Officer - Bell Direct
While the Construction division continued to progress and finish
historical projects, the provision envelope has increased

•   Well through the historical Construction work book

•   Additional $150m provisions in Buildings and Infrastructure businesses due to:

     > COVID-19 disruptions and productivity impacts, both in FY20 and ongoing (50%)

     > Issues on historically completed projects (20%)

     > Prudent risk provision across portfolio of legacy work (30%)

•   c$600m legacy work to complete, down from $2.2b at HY18

•   c$175m of legacy project losses remaining to incur as cash outflows

6   Fletcher Building Full Year Results Presentation | © August 2020
Fletcher Building Full Year Results to 30 June 2020 - ROSS TAYLOR - Chief Executive Officer - Bell Direct
Setting up for likely lower market activity in FY21 required
permanent reductions to our cost base and workforce

                                  Actions                                                   Impact

• Reductions to operating footprint, supply chain
  costs and general costs                                              • Actions expected to achieve a permanent
                                                                         reduction in cost base in FY21 of c$300m p.a.
• Workforce size will be reduced by c12% (over
  1,500 people) matched to probable future                             • FY20 significant items of $276m:
  market activity                                                        > Right-sizing of the cost base $187m

• Australia portfolio rationalisation continuation                       > Rocla asset impairments $59m
                                                                         > Debt restructuring resulted in one-off
• Renegotiated debt covenants to preserve                                  Make Whole payment $30m
  liquidity and retired a further USD$300m of our
  most expensive debt lines, saving c$40m of                           • FY21 significant items of c$90m as final cost-
  future interest payments                                               out actions completed
                                                                       • Significant items (FY20 and FY21) are
• Capex envelope reduced until market outlook                            expected to be c55% cash/45% non-cash
  more certain

7   Fletcher Building Full Year Results Presentation | © August 2020
Fletcher Building Full Year Results to 30 June 2020 - ROSS TAYLOR - Chief Executive Officer - Bell Direct
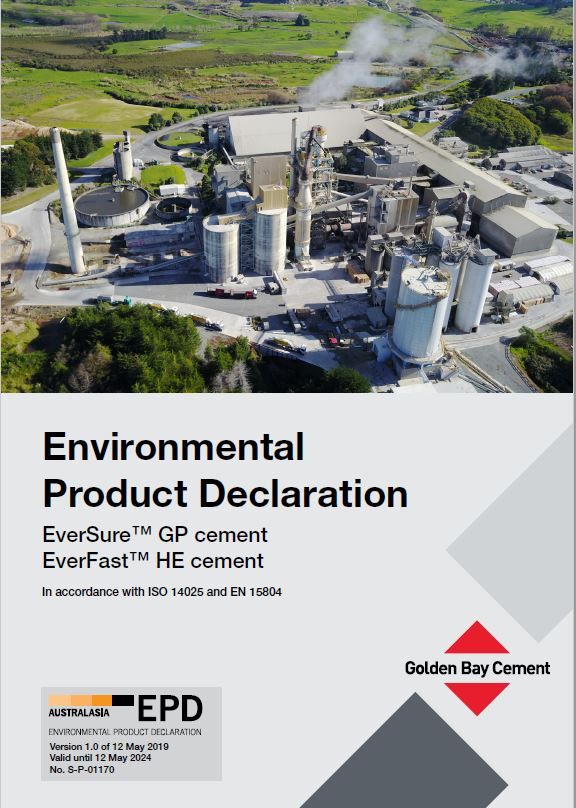
FY20 - Financial results

    Revenue                                       EBIT1                                               Net Earnings/(Loss)                                           EPS

    $7,309m $160m                                                                                     ($196m)                                                       (23.5c )
    FY2019 $8,308m                                FY2019 $549m                                         FY2019 $246m                                                  FY2019 28.8c

    Cash flows from                               Leverage ratio                                      EBIT margin                                                   Dividend
    operating activities

    $410m                                         0.9x                                                2.2%                                                          nil
                                                  Target range: 1.0-2.0x                              FY2019: 6.6%                                                  FY2019: 23cps
    FY2019 $153m

8
                                                                        Note: All metrics are for continuing operations except cash flow from operating activities. RTG and Formica were sold in FY19
                                                                        1 Measures before significant items are non-GAAP measures used by management to assess the performance of the business and
     Fletcher Building Full Year Results Presentation | © August 2020
                                                                        have been derived from Fletcher Building’s financial statements for the 12 months ended 30 June 2020. Details of significant
                                                                        items can be found in note 2 of the financial statements
Fletcher Building Full Year Results to 30 June 2020 - ROSS TAYLOR - Chief Executive Officer - Bell Direct
FY20 - Division performance summary

                                                   Gross Revenue                                        EBIT1
                                                                                                                                         • Good performance in finishing trades, early
             Building                                   $1,173m                                       $87m                                 stage civil and infrastructure softer
             Products                                    FY19: $1,314m                               FY19: $167m                         • Steel market remained challenging

             Distribution                               $1,471m                                       $85m                               • Growth in line with market
                                                         FY19: $1,596m                               FY19: $115m                         • Strategic digital and automation investment

                                                                                                                                         • Year-on-year margin expansion (pre-COVID-19)
             Concrete                                     $740m                                       $74m                               • Market share gains in Firth and cement
                                                           FY19 $802m                                 FY19: $89m                         • Price gains in aggregates and ready-mix

                                                                                                                                         • Housing market demand remained strong and
             Residential and                              $466m                                       $65m                                 prices supportive
             Development                                  FY19: $639m                                FY19: $137m                         • COVID-19 delayed land development and
                                                                                                                                           housing settlements now moved into FY21
                                                                                                                                         • Lockdown significantly affected paving, civil and
             Construction                               $1,318m                                   ($147m)                                  building works programmes
                                                         FY19: $1,702m                                FY19: $51m                         • Provisions of $150m, $600m legacy work to go
                                                                                                                                         • Strong order book of $2.4b with good wins
                                                                                                                                         • Good momentum in Laminex and Insulation
             Australia                                  $2,802m                                       $33m                               • Tradelink/Stramit poor 2nd half – few larger projects
                                                         FY19: $3,024m                                FY19: $77m                         • Rocla/Iplex loss c$15m – few large projects, lower
                                                                                                                                           volumes, Rocla industrial action as sites closed

9
                                                                        1 FY19 has been adjusted for proforma IFRS16 to allow for a like-for-like comparison (12 months FY19 reported +IFRS16 proforma adjustment)

    Fletcher Building Full Year Results Presentation | © August 2020    Measures before significant items are non-GAAP measures used by management to assess the performance of the business and has been derived from
                                                                        Fletcher Building’s financial statements for the 12 months ended 30 June 2020. Details of significant items can be found in note 2 of the financial statements
Fletcher Building Full Year Results to 30 June 2020 - ROSS TAYLOR - Chief Executive Officer - Bell Direct
FY20 - Balanced scorecard metrics: safety and sustainability

                                                   Safety                                                                  Safety
                 Total Recordable Injury                                      Serious injuries2                               • Group-wide ‘Protect’ programme reset well underway,
                    Frequency Rate1                                                                                             Protect now one of our core values

                6.9
                                                                     33                                                       • Our aim is to have zero injuries every day
                             5.1          5.0        5.7                          21          20                              • Significant improvement in serious injuries from 20 in
                                                                                                           8
                                                                                                                                FY19 to 8 in FY20
                                                                                                                              • FY20 focus on critical risks but continue to target TRIFR
               FY17         FY18        FY19        FY20            FY17        FY18         FY19        FY20                   under 5.0

                                           Sustainability                                                                  Sustainability
                                         Carbon (CO2 ) Emissions                                                              • Committed to reduce carbon emissions by 30% by 2030,
                                           (thousand Tonnes)3
                                                                                                                                first building and construction company in Australasia to
                              1,238                         1,147                                                               set a Science-based Target for carbon reduction
                                                                                         1,132
                                                                                                                              • Aligns with aims to limit global warming to below 2oC
                                                                                                                              • Carbon emissions remained c8% below FY18 levels,
                                                                                                                                through market activity and permanent reductions from
                                                                                                                                our focus on carbon emissions and operating efficiencies
                              FY18                          FY19                          FY20                                • Favourable outcomes on footprint rationalisation - cost
                                                                                                                                out and sustainability
1   TRIFR = Total no. of recorded injuries per million man hours worked. Does not include Restricted Work Injuries.
2   Serious Injury include immediate treatment as an in-patient at hospital for more than 24 hours or immediate treatment for a serious injury or illness as defined by Safe Work Australia.
3   Carbon data excludes emissions from the International division which was divested in FY19.

10         Fletcher Building Full Year Results Presentation | © August 2020
FY20 - Balanced scorecard metrics: engagement and customer

                                            Engagement                                                                     Engagement
                                         Employee Engagement Rating1                                                           • Significant engagement through COVID-19 Support Hub
                                                                                                                                 App
                                                                          70%                     71%
                         66%                     67%                                                                           • Group values refreshed: Protect, Be Bold, Customer
                                                                                                                                 Leading, Better Together
                                                                                                                               • Continue to drive employee engagement >80% (top
                                                                                                                                 quartile)

                         FY16                    FY17                    FY18                    FY19

                                               Customer                                                                    Customer
                                             Net Promoter Score 2                                                              • NPS result improvements continue to be underpinned by
                                                                                                                                 high product quality and reliability, and professional
                                                                          39                      39                             customer service
                          26                      28                                                                           • Rollout and embed customer service promises across
                                                                                                                                 all businesses
                                                                                                                               • Drive to a best in class net promoter score of >55

                         FY17                    FY18                    FY19                    FY20

1 Next   employee engagement survey planned for FY21
2   Net Promoter Score calculated as % Promoters (9 - 10) minus % Detractors (0 - 6). Prior years have been restated to reflect inclusion of all Business Units in NPS programme.

11         Fletcher Building Full Year Results Presentation | © August 2020
Agenda
1. Results Overview                   Ross Taylor

2. Positioning for FY21               Ross Taylor

3. Financial Results                  Bevan McKenzie

4. Strategy and Outlook               Ross Taylor

Fletcher Building
Full Year Results Presentation 2020
FY21 - Positioned for reduced activity
Focus on preserving profitability and balance sheet position
                         • Business reset for market downturn of c25% in NZ and c20% in Australia
     Market              • Expect stronger first half compared to second half as economies slow, unemployment rises
                         • Remains very uncertain – we will monitor closely and continue to adjust as necessary

  Preserve               • Suite of cost-out actions already implemented to preserve profitability
profitability,           • Benefit of a c$300m cost reduction in FY21, though offset by market decline
 cost base
    reset                • Further work on cost out (property and supply chain) planned for FY21

                         • Targeted capital investment over last 5 years allows us to sensibly restrict base capex to
                           c$150m in FY21, plus $50m for next phase of WWB plant
     Capex
                         • Preserving investment in key strategic projects, esp. sustainable manufacturing and digital
                           platforms

 Cash flow               • Ongoing focus on cash flows and working capital, good disciplines established over past 3 years
     and                 • Liquidity of $1.3b post-repayment of USPP 2012 notes
  liquidity              • Funding costs reduced by $20m to c$60m in FY21

                         • Relentless focus on customer
  Market
                         • Target to increase market share through downturn
 positions
                         • Stay very attuned to opportunities in our existing segments and logical adjacencies

13    Fletcher Building Full Year Results Presentation | © August 2020
Market outlook
Positioning NZ businesses for overall market downturn of c25%
                  NZ Historical and Forecast                                                     Overall
                         Residential Consents (#)                                                • Outlook is uncertain, influenced by unemployment,
                        35k
                                         37k      -32%                                             govt. spending, inward migration and COVID-19
      33k
                                                                                                   clusters
                                                          25k
                                                                         23k                     Residential
                                                                                                 • 46% of NZ revenue, key driver of NZ profitability
                                                                                                 • FBU base case is for residential consents to decline
                                                                                                   c30% in FY21 and a further 10% in FY22
                                                                                                 • Returning residents, low interest rates, government
     FY18             FY19              FY20             FY21F          FY22F
                                                                                                   stimulus remain supportive

 Value of Commercial and Infrastructure work put in place                                        Commercial / Non-residential
                     (Nominal $m)                                                                • 30% of NZ revenue
                                                                                                 • FBU base case is for commercial work put in place to
                                       8,688 -10%
     8,342
                      8,403
                                                         7,819          8,210                      decline c15% in FY21, then stabilise in FY22, weighted
                                                                                                   to downside
     7,636            8,687            9,118 -15%        7,750          7,595
                                                                                                 Infrastructure
     FY18             FY19         FY20F                 FY21F          FY22F                    • 24% of NZ revenue
              Key:      Commercial                   Infrastructure                              • FBU base case is for infrastructure work put in place
                                                                                                    to decline c10%, then to grow steadily, solid outlook

14   Fletcher Building Full Year Results Presentation | © August 2020
                                                                        Source: Infometrics, FB Management Estimates. These are our base case estimates for FY21, though we acknowledge that there
                                                                        is a lot of uncertainty over the outlook and that actual activity levels may be materially different.
Building Products
Focus on margins, product innovation and sustainable
manufacturing
                            • Ongoing focus on pricing disciplines and holding margins
                            • c$400m new WWB Tauranga, commence 6 months later
   Finishing
   Products                 • Driving growth through new products e.g. GIB products, TINZ building
 (WWB, TINZ,                  wraps, expanded product range in Laminex
   Laminex)                 • Continue to launch new products and deliver superior customer service
                            • Digital initiatives to improve efficiency and customer experience
                              through WWB customer app and new Laminex website

                                                                                                            GIB Weatherline
                            • COVID-19 resulted in further footprint and cost
                              rationalisation to drive margin improvements in FY21
      Steel
                            • Continue to drive product innovation and customer service
                              e.g. through Dimond mobile roll-to-roof system

                            • Footprint rationalised, continue to drive improvements
                              in Humes, inventory reduced
   Pipes                    • Deliver Iplex revenue and margin growth through
(Humes, Iplex)                expanded product range
                            • Mobile extrusion plant commissioned and fully                CSP lighting poles and barriers
                              operational

15   Fletcher Building Full Year Results Presentation | © August 2020
Concrete
Focus on margins, sustainability and operational footprint
                                      • Ongoing momentum in pricing disciplines
                                        and market share gains achieved in FY20
                                      • Firth new ready-mix concrete plant in Mt
                                        Maunganui driving efficiencies
Operating
                                      • Acquisitions delivering - Tamahere quarry
efficiency and
                                        acquired in Mar’19 delivering strong EBIT
pricing
                                        return
                                                                                     Firth new ready-mix concrete plant in Mt Maunganui
                                      • Quarry and ready-mix networks right-sized
                                      • Masonry further manufacturing footprint
                                        rationalisation

  Ecommerce,                          • Firth digital connectivity to improve customer experience in
digitisation and                        FY21
  automation                          • Upsurge in switch to digital dockets
                                      • GBC tyre-derived fuel cost and carbon reduction initiative
                                        going live in FY21
 Sustainability
                                      • GBC innovation on pozzolans continues
  and Product
   Innovation                         • Environmental Product Declarations for Golden Bay cement,
                                        an Australasian first in cement
                                      • Masonry new sized paving options

16   Fletcher Building Full Year Results Presentation | © August 2020
Distribution
Focus on network efficiency and digital offer to customers
                                       • Ongoing focus on pricing disciplines
     Network                           • Regional hub structures introduced in Auckland and Christchurch, closed
     efficiency                          underperforming stores
                                       • Workforce optimisation programme

                                       • Distribution digital transformation providing 24x7 omnichannel experience in
                                         PlaceMakers
Ecommerce and                            > 70% of branch transactions now digitised
  digitisation                           > Trade App launched in April
                                         > Shop.PlaceMakers launched
                                         > Accelerating trade portal plans and estimation transformation
                                       • Transforming transport
                                         capability
    Product                              > Efficiency improved through
Innovation and                              own vehicle delivery
   Customer                              > Service levels enhanced
    Service                                 through uber-style “track
                                            your truck”
                                       • “Skip the counter” enabling
                                         seamless in-branch experience

17    Fletcher Building Full Year Results Presentation | © August 2020
Residential and Development
Strongly positioned to expand, leveraging off-site manufacturing
                  Residential and Development                            Fortnightly House Sales, strong sales post lockdown
• #2 house builder in New Zealand                                                       # Conditional Agreements
                                                                         80                          Christmas            Level 4
                                                                                                                         Lockdown
• New home sales mainly priced $600-900k
                                                                         60
• Strong operating disciplines and customer focus
                                                                         40
• c4,000 future lots under control, >4 years’ supply
                                                                         20
• Clever Core new manufacturing plant, global
  innovation into NZ to evolve the way we build                           0
  houses, 40 produced in FY20 since Oct-19 opening,                       02/07/19
                                                                           Jul’19    02/10/19
                                                                                      Oct’19         02/01/20
                                                                                                      Jan’20           02/04/20
                                                                                                                       Apr’20       02/07/20
                                                                                                                                     Jul’20
  FY21 external sales planned                                                          Rolling fortnightly 2 Jul’19 to 27 Jul’20
                                                                                       Average fortnightly over FY20
• Intend to scale apartment business
                                                                                                     FY21
                                                                          • Targeting c700-800 unit sales for FY21
                                                                          • Land Development $25m p.a. run-rate but will
                                                                            be higher in FY21 due to delayed FY20
                                                                            settlements

Fletcher Living Waiata Shores

18    Fletcher Building Full Year Results Presentation | © August 2020
Construction
Strengthened future order book
   Significant progress made on two fronts since HY18                                                        Strong future pipeline
                                     Work to Complete ($b)                                     • Winning the right work with the right customers
                                                                                                 eg Watercare, AIA runway, strong pipeline of
                 0.7                                                                             pavement and maintenance
                                                                                               • Securing new work in line with targeted
                                                                            2.4
                                                                                                 balanced portfolio and better risk profile:
                 2.2                                                                             > 1/3rd Lump Sum / D&C
                                                                                                 > 1/3rd Alliance / Measure & Value
                                                                            0.6                  > 1/3rd Maintenance
                HY18             FY18                  FY19                 FY20
                Lower-risk smaller jobs,                                                       • $2.4b of non-legacy work provides base for
                                                       High-risk, lump sum D&C
                maintenance contracts                                                            future years:
   1.      Completed significant number of legacy jobs,                                          > c $850m for delivery in FY21
           risk reduced                                                                          > c $500m for delivery in FY22
   2.      New work won with materially better margin                                            > c $1.1b for delivery in FY23+
           outlook and significantly lower and more                                            • Expect non-legacy work to deliver 3-5% EBIT
           appropriate risk profile                                                              margins

Note: The part of the NZICC rebuild funded by insurance is included in $2.4b FY20 order book

19       Fletcher Building Full Year Results Presentation | © August 2020
Market outlook
Positioning Australia businesses for market downturn of c20%
                  AU Historical and Forecast                                                     Overall
                        Residential Approvals (#)                                                • Outlook is uncertain, influenced by unemployment,
      232k
                                                                                                   govt. spending, inward migration and COVID-19
                       188k                                                                        clusters
                                         169k     -24%

                                                          129k          129k                     Residential
                                                                                                 • 57% of AU revenue, key driver of AU profitability
                                                                                                 • FBU base case is for residential approvals to decline
                                                                                                   c25% in FY21, then stabilise in FY22
                                                                                                 • Low interest rates, government stimulus remain
     FY18              FY19             FY20              FY21F         FY22F
                                                                                                   supportive, WFH driving renovation activity

                                                                                                 Commercial / Non-residential
     Value of Commercial and Infrastructure work done
                          (A$b)                                                                  • 29% of AU revenue
                                                                                                 • FBU base case is for commercial work put in place to
                                                                                                   decline c15% in FY21, weighted to downside, then
     110                 92               95     -9%        86           98                        stabilise in FY22

      44                 46               48     -15%       41           41                      Infrastructure
                                                                                                 • 14% of AU revenue
     FY18              FY19             FY20F             FY21F         FY22F
               Key:       Commercial                   Infrastructure
                                                                                                 • FBU base case is for infrastructure work put in place
                                                                                                    to decline c10% but most resilient sector, then to
                                                                                                    grow steadily
20   Fletcher Building Full Year Results Presentation | © August 2020
                                                                        Source: Bis Oxford, FB Management Estimates. These are our base case estimates for FY21, though we acknowledge that there
                                                                        is a lot of uncertainty over the outlook and that actual activity levels may be materially different.
Australia
Laminex, Fletcher Insulation turnaround momentum; margin focus
                             • Continue momentum in Laminex through customer traction on refreshed product range, Compact
                               decorative surface launched
 Laminex and                 • Well-positioned for online trading amid pandemic with Laminex digital delivering online volume growth,
 Fletcher                      >$100m sales transacted through ecommerce in
Agenda
1. Results Overview                    Ross Taylor

2. Positioning for FY21                Ross Taylor

3. Financial Results                   Bevan McKenzie

4. Strategy and Outlook                Ross Taylor

 Fletcher Building
 Full Year Results Presentation 2020
Income statement
Profit impacted by COVID-19, provisions and restructuring costs
Reported results                                                         Jun 2019    Jun 2020     Change
NZ$m                                                                    12 months   12 months        $m
Revenue                                                                     8,308       7,309       (999)
EBITDA                                                                       723          530       (193)
EBIT before significant items from continuing operations                     549          160       (389)
Significant items                                                            (94)       (276)       (370)
EBIT from continuing operations                                              455        (116)       (571)
Lease interest expense                                                          -        (69)         (69)
Funding costs                                                               (116)        (80)          36
Tax (expense)/benefit                                                        (80)          81         161
Non-controlling interests                                                    (13)        (12)           1
Net earnings from discontinued operations net of tax                         (82)            -         82
Net earnings/(loss)                                                          164        (196)       (360)
Basic earnings per share (EPS – cents)                                       19.2       (23.5)   (42.7)cps
Dividends declared per share (EPS – cents)                                   23.0            -   (23.0)cps

23   Fletcher Building Full Year Results Presentation | © August 2020
Significant items
Major restructuring programme to respond to market slowdown

                FY20-21 restructuring programme                                                        Key Focus Areas
Significant items                                                                  • Right-sizing cost base:
NZ$m                                       FY20               FY21F        Total     > 1,500 redundancies
Right-sizing cost base                       187                    90      277
                                                                                     > Operational footprint and office space rationalised
                                                                                   • Rocla restructuring and impairment of assets on
Rocla                                          59                            59      closed sites
USPP Make Whole                                30                            30    • USPP Make Whole: cost of early USPP 2012 exit
Total                                        276                    90      366    • Cash costs mainly consist of redundancies, site exits
                                                                                     (onerous leases, make good), USPP Make Whole
Cash flow timing
                                                                                     payment
NZ$m                                       FY20               FY21F        Total
Right-sizing cost base                         59                 101       160                            Benefits
Rocla                                            4                  12       16    • Gross cost-out benefit in FY21 c$300m, split evenly
USPP Make Whole                                   -                 30       30      between COGS and SG&A
Total                                          63                 143       206    • Rapid payback on c$160m cash costs
                                                                                   • Cost-out benefits offset by expected market decline
                                                                                   • Closed Rocla sites to be developed and sold in FY21-22
                                                                                   • USPP 2012 exit reduces interest by c$17m p.a.

24      Fletcher Building Full Year Results Presentation | © August 2020
Cash flow
Strong cash flows delivered despite challenging trading conditions
                                                                                                                                    Jun 2019                     Jun 2020    Change
NZ$m                                                                                                                               12 months                    12 months       $m
EBIT from continuing operations before significant items                                                                                        549                   160      (389)
Depreciation and amortisation                                                                                                                   174                   370       196
Lease principal and interest payments                                                                                                               -                (240)     (240)
Provisions and other                                                                                                                           (42)                   182       224
Trading cash flow before working capital movements                                                                                              681                   472      (209)
Working capital movements                                                                                                                      (96)                    93       189
Trading cash flow from continuing ops excl. legacy Construction and significant items                                                           585                   565       (20)
Discontinued operations                                                                                                                           14                     -      (14)
Legacy Construction cash flow                                                                                                                (270)                   (186)       84
Significant items                                                                                                                              (20)                   (63)      (43)
Trading cash flow                                                                                                                               309                   316         7
Add: Lease principal payments                                                                                                                       -                 171       171
Less: cash tax paid                                                                                                                            (28)                      -       28
Less: funding costs paid                                                                                                                     (128)                    (77)       51
Cash flows from operating activities                                                                                                            153                   410       257

Free Cash Flow from continuing operations excluding legacy Construction                                                                         269                   269          -

25   Fletcher Building Full Year Results Presentation | © August 2020
                                                                        Note: Legacy Construction cash flow includes Building and Infrastructure projects
                                                                        Free Cash Flow = Trading cash flow less capex less cash tax, excluding M+A activities
Working capital
Cash flow supported by close management of working capital

                                                      Cash Flow Working Capital Movements (NZ$m)
Cash flow working capital movements continuing ops excl. legacy
Construction and significant items                                                        Jun 2019     Jun 2020    Change
NZ$m                                                                                     12 months    12 months       $m
Residential and Development                                                                    (27)          50        77
Construction excluding legacy                                                                   (6)          16        22
Debtors                                                                                         28           95        67
Inventories                                                                                    (54)          (1)       53
Creditors                                                                                      (37)         (67)      (30)
Cash flow working capital movements                                                            (96)          93       189

                              Key Working Capital Metrics - Materials and Distribution Total Cycle (days)
                                                                                              As at        As at   Change
Key working capital metrics (days)                                                        Jun 2019     Jun 2020     (days)
Debtor Days                                                                                   40.7         39.0        1.7
Inventory Days                                                                                74.2         75.1      (0.9)
Payables Days                                                                                 47.9         46.9      (1.0)
Materials and Distribution total cycle                                                        67.0         67.2      (0.2)

26   Fletcher Building Full Year Results Presentation | © August 2020
Capex
Reduced spend but ongoing focus on key areas of strategy

                    Capex by Markets (NZ$m)                                                      FY20 Capex

                                                                            • FY20 capex spend reduced by $70m as a cash
                                       8                                      preservation measure through COVID-19
                                                                            • Capex programme focused on enabling investments
                                                                              for strategy, especially digital, manufacturing
                  65                                                          efficiency and operating capacity, product & service
                                                                              innovation, sustainability, eg:
                                    $232m                                     > PlaceMakers digital programme
                                                                  124
                                                                              > Firth ready-mix trucks and plant replacement
                                                                              > Quarry and Cement heavy mobile-equipment
                        32                                                    > WWB land secured in Tauranga
                                   3
                                                                                                  FY21 Capex
                                                                            • FY21 capex c$175-200m, includes $50m for next
                              Residential and                                 phase of WWB plant
           NZ Core                                           Construction
                              Development                                   • Prudent reduction is mainly in maintenance capex,
                                                                              leveraging solid investments in prior years
                          Australia            Corporate
                                                                            • Preserving investment in key strategic projects,
                                                                              esp. sustainable manufacturing and digital

27   Fletcher Building Full Year Results Presentation | © August 2020
Net debt
Strong trading cash flows supporting net debt position

                                                                Net Debt: Jun-19 to Jun-20 (NZ$m)

                                                                                                                                        47                565
                                                                                                                    77
                                                                                               240

                                                                              186

                                                                                                                                                                              63
                                                           147

                                          128
                         44                                                                                                                                                                        497

      218

     Net Debt      Reclassification      FY19 final   Repurchase of      Legacy projects       Capex           Funding costs          Other 2         Trading cash     Significant items       Net Debt
             1
      Jun-19      to lease liabilities   dividend        shares                                                                                                               cash              Jun-20
                                         payment

28
                                                                             1 Opening  debt restated from $325m to now include debt hedging activities
      Fletcher Building Full Year Results Presentation | © August 2020       2 Other includes Minority distribution of $9m and Hedging/FX on debt of $15m, make whole adjustment of $30m, partly
                                                                             offset by divestments/asset disposals of $6m
Leverage
Leverage of 0.9x is below bottom end of target range

                Leverage (Net Debt / EBITDA)1
                                                                                                       • Good cash flow performance means leverage ratio
                                                                                                         (Net Debt / EBITDA) remains below target range of
                                                                                                         1.0x-2.0x
                                                                                                       • Includes impact of construction provisions, which
  2.0x
                                                                                                         increased Jun-20 leverage by 0.2x
 Target                                                                                                • Expect to remain at lower end of leverage range,
 range
                                                                                                         continued preference for conservative balance
                                                                                                         sheet metrics
  1.0x
                                                               0.9x

                 0.4x

                 FY19 1                                       FY20

29   Fletcher Building Full Year Results Presentation | © August 2020
                                                                        1. Due to material impact of FX movements on balance sheet value of debt in recent months, the Group will use hedged
                                                                        value of debt in its leverage calculation – i.e. Net Debt includes impact of CCIRS derivatives. FY19 has not been restated
                                                                        as historic impact of debt hedging on leverage ratio has been relatively limited (c0.1x).
Funding
Strong maturity profile $1.3b liquidity after USPP payment

           Debt Maturity Profile at Jun-20 (NZ$m)                                                                                                Facilities   Drawings
                                                                                                          NZ$m                                  30 Jun 20     30 Jun 20
                                           14
                                                                                                          Syndicate                                    925         400

                                                                                                          USPP                                         809         809

                                                                                                          Capital Notes                                365         365
                                                             400
                                                                                                          Other                                         27          27
                                          525
                                                                             459                          Total                                      2,126        1,601

                                                                                                        • Undrawn credit lines of $525m and cash of $1.1b as at
                                                                                                          30 June 2020
      13
                                                             149                                        • $350m USPP debt repaid in Jul-20 (interest $17m
     100               100                                                                                lower p.a.)
                                           16                                                           • Syndicated banking facility renegotiated in 1H20,
     FY21        FY22                FY23      FY24-25                     FY26+                          establishing new 3 and 5-year tenor
      Capital Notes              USPP1    Bank Syndicate                    Other                       • Lender amendments enable more favourable terms
• Chart does not include $350m USPP debt repaid post                                                      for covenant testing to the end of calendar 2021 if
  balance date                                                                                            required

30
                                                                         1 Includes   CCIRS component and excludes fair value hedge component
      Fletcher Building Full Year Results Presentation | © August 2020
Summary
Strong balance sheet and cash flows, focused on margin

              Balance Sheet                                                             Cash Flow                                                                        Margin
• $1.3b liquidity                                                • Operating cash flows strong,                                               • At HY20, Concrete and core
                                                                   despite COVID-19 impact on                                                   Building Products delivering
• 0.9x leverage ratio                                              earnings                                                                     year-on-year margin expansion
• Gross debt reduced by $1.0b1                                   • Focus on working capital                                                   • Moved decisively to reset costs
  since Jun-18 (incl. USPP 2012                                    delivering ongoing cash release                                              in anticipation of reduced
  exit)                                                                                                                                         market activity, well organised
                                                                 • Working capital cycle reduced                                                and continue to remain vigilant
• Exit of high-cost USPP debt and                                  from 71.3 days to 67.0 days                                                  to market movements
  other debt reduces interest                                      since Jun-17
  costs c$20m                                                                                                                                 • FY21 focus on margin through:
                                                                 • Capex rapidly and sensibly
• Strong tenor in funding lines                                    reduced while maintaining key                                                   > Locking in benefits of cost
                                                                   investments                                                                       reset
• Covenant waivers provide                                                                                                                         > Pricing discipline
  certainty through to Dec-21
                                                                                                                                                   > Cost to serve / segment
                                                                                                                                                     profitability
                                                                                                                                                   > Additional property and
                                                                                                                                                     supply chain savings

31
                                                                        1 Excludes   $400 million syndicate drawn in March 20 recognised in cash balances to support liquidity
     Fletcher Building Full Year Results Presentation | © August 2020
Agenda
1. Results Overview                    Ross Taylor

2. Positioning for FY21                Ross Taylor

3. Financial Results                   Bevan McKenzie

4. Strategy and Outlook                Ross Taylor

 Fletcher Building
 Full Year Results Presentation 2020
FY21 and beyond - strategy and focus remain unchanged
Remain well positioned to execute strategy

                             • Continued focus on operational excellence and driving profitability
1. Strengthen
                             • Complete the fix of underperforming businesses
and grow the
NZ core                      • Market share growth through customer service performance, product innovation and adding logical
                               adjacencies

2. Profitable                 • Continued performance across residential business
growth in                     • Progressively build apartment capability and volumes
Residential and               • Grow Clever Core adding external customers and a broader product range
Development                   • Pipeline of industrial land development supporting a minimum of c$25m p.a. ongoing profits

                             • Complete the historical Construction order book
3. Stabilise                 • Continue to build out the “go forward” lower risk/higher margin order book across all Construction
Construction                   business units
                             • Continue to upskill the business and improve overall operating disciplines and consistency

                             • Portfolio rationalisation and associated business sales
4. Turnaround
                             • Strong focus on driving top line growth, operational performance and margin improvements
and grow
Australia                    • Market share growth through customer service performance, product innovation and adding logical
                               adjacencies

33   Fletcher Building Full Year Results Presentation | © August 2020
FY21 outlook

•    Business reset for market downturn of c25% in NZ and c20% in Australia

•    Expect stronger first half compared to second half as economies slow, unemployment rises

•    However, the year remains very uncertain

•    Sharpened focus and ready to act, vigilant to macro factors, market activity and how forecasts evolve

•    We have a strong balance sheet and a resilient business reset to withstand market pressures

•    We remain well-positioned to implement our strategy

34   Fletcher Building Full Year Results Presentation | © August 2020
Appendix

Fletcher Building
Full Year Results Presentation 2020
Industry context New Zealand and Australia

                                 NZ Historical                                                                                                AU Historical
                            Residential Consents (#)                                                                                   Residential Approvals (#)
                                                                             37k                                      239k
                                                             35k                                                                                      232k
                                            33k                                                                                        222k
        29k               30k
                                                                                                                                                                  188k
                                                                                                                                                                                169k

        FY16             FY17              FY18              FY19            FY20
                                                                                                                      FY16             FY17           FY18        FY19          FY20
                                                       Retirement
 Key:         Houses            Apartments                                 Townhouses                          Key:           Houses              Apartments                Townhouses
                                                       Units

 Value of Commercial and Infrastructure work put in place                                                             Value of Commercial and Infrastructure work done
                     (Nominal $m)                                                                                                          (A$b)

                                                            8,403           8,688
                                          8,342
        6,022            6,200                                                                                          95                            110          92             95
                                                                                                                                        88

                         7,318            7,636             8,687           9,118
        6,627                                                                                                           38             38             44           46             48

        FY16             FY17         FY18                  FY19            FY20F                                     FY16             FY17           FY18        FY19          FY20F
                 Key:      Commercial                   Infrastructure                                                         Key:      Commercial            Infrastructure

36      Fletcher Building Full Year Results Presentation | © August 2020
                                                                             Source: Statistics NZ, Infometrics, Bis Oxford
Group revenue by market

                  FBU Revenue by Market (%)
                      AU
                      Infrastructure
      AU                                                            NZ
      Commercial                                                    Residential
                                        5%
                              10%
                                                            30%

AU
Residential          20%

                                 15%                   20%
                                                                   NZ
            NZ
                                                                   Commercial
            Infrastructure

37   Fletcher Building Full Year Results Presentation | © August 2020
Building Products
Results overview
                                                        Jun 2019             Jun 2019
                                                      12 months            12 months            Jun 2020
NZ$m                                                   Reported            pro forma1         12 months
Gross Revenue                                                1,314               1,314               1,173            • Strong volumes and operating performance
EBITDA2                                                        177                     214              140             in plasterboard, insulation and laminates
                                                                                                                        outside of the NZ lockdown period
EBIT2                                                          160                     167                  87

Trading Cash Flow2                                             157                     157              125
                                                                                                                      • Pipes volumes and performance impacted
                                                                                                                        by subdued infrastructure activity,
ROFE3 %                                                       22%                  24%                 13%
                                                                                                                        aggressive competition and wet first quarter
Capex                                                            55                    55                   53
                                                                                                                      • Steel challenging trading conditions
Cash    Conversion4                                           64%                  61%                 83%              exacerbated by NZ lockdown period and
                                                                                                                        declining global steel prices impacting
Building Products (ex Steel) EBIT2                             127                     132              101             inventory valuations
Steel EBIT2                                                      33                    35              (14)           • Divisional cash flow lower but cash
                                                                                                                        conversion was 83%, up from 61% in FY19
Domestic board volumes (m2)                                                                             -4%           • Capex spend includes $22m on new WWB
                                                                                                                        plant at Tauranga
Domestic laminate sales (m2)                                                                          -10%

Pipe volumes (t)                                                                                      -11%

Steel volumes (t)                                                                                     -15%

Divisional Exposure                              Resi, 42%                 Com, 28%            Infra, 30%

38
                                                                               1 Jun 2019 12 months pro forma is Jun 2019 12 months reported adjusted for IFRS 16
        Fletcher Building Full Year Results Presentation | © August 2020       2 Before significant items
                                                                               3 EBIT/Closing Funds
                                                                               4 Cash conversion = FCF/EBIT
Distribution
Results overview
                                                        Jun 2019             Jun 2019
                                                      12 months            12 months           Jun 2020
NZ$m                                                   Reported            pro forma1        12 months

Gross Revenue                                                1,596              1,596               1,471             • Revenue growth before and after NZ
EBITDA2                                                        114                    161              132              lockdown, some key stores open during
                                                                                                                        lockdown but minimal activity
EBIT2                                                          104                    115                85
                                                                                                                      • Good growth in most geographical segments
Trading Cash Flow2                                               98                   98               117
                                                                                                                        prior to lockdown, Auckland and
ROFE3 %                                                       35%                 46%                 41%               Christchurch lower post lockdown
Capex                                                            23                   23                 21           • PlaceMakers Antigua Street and Helensville
Cash Conversion4                                              72%                 65%               113%
                                                                                                                        sites closed
                                                                                                                      • Cash flow higher on reduced working
                                                                                                                        capital, with tight inventory and debtor
PlaceMakers revenue                                                                                    -7%
                                                                                                                        management
Mico revenue                                                                                           -8%
                                                                                                                      • Continued focus on digital transformation
                                                                                                                        programme and property upgrades
Divisional Exposure                                        Resi, 79%                             Com, 21%

39
                                                                              1 Jun 2019 12 months pro forma is Jun 2019 12 months reported adjusted for IFRS 16
        Fletcher Building Full Year Results Presentation | © August 2020      2 Before significant items
                                                                              3 EBIT/Closing Funds
                                                                              4 Cash conversion = FCF/EBIT
Concrete
Results overview
                                                        Jun 2019             Jun 2019
                                                      12 months            12 months           Jun 2020
NZ$m                                                   Reported            pro forma1        12 months

Gross Revenue                                                  802                    802              740            • Revenue growth across all business units
EBITDA2                                                        134                    164              148              outside of NZ lockdown period with strong
                                                                                                                        resurgence in volumes post lockdown
EBIT2                                                            84                   89                 74
                                                                                                                      • Price gains in aggregates and ready-mix
Trading Cash Flow2                                             136                    136              100
                                                                                                                      • Higher market share in Firth
ROFE3 %                                                       13%                 14%                 12%
                                                                                                                      • New customers in GBC, following reduced
Capex                                                            65                   65                 50
                                                                                                                        number of competitors
Cash Conversion4                                              85%                 80%                 68%
                                                                                                                      • Capex investments in further quarry
                                                                                                                        resource development, additional heavy
Aggregates sales volumes                                                                             -13%
                                                                                                                        mobile equipment for both quarries and
                                                                                                                        cement operations, ready-mix trucks and
Domestic cement volumes                                                                                -5%
                                                                                                                        plant replacement in Firth
Ready-mix volumes                                                                                      -9%

Divisional Exposure                             Resi, 44%                  Com, 29%            Infra, 27%

40
                                                                              1 Jun 2019 12 months pro forma is Jun 2019 12 months reported adjusted for IFRS 16
        Fletcher Building Full Year Results Presentation | © August 2020      2 Before significant items
                                                                              3 EBIT/Closing Funds
                                                                              4 Cash conversion = FCF/EBIT
Residential and Development
Results overview
                                                        Jun 2019             Jun 2019
                                                      12 months            12 months           Jun 2020
NZ$m                                                   Reported            pro forma1        12 months

Gross Revenue                                                  639                    639              466            • Market demand strong Oct-Mar and post NZ
EBITDA2                                                        137                    139                68
                                                                                                                        lockdown, continued strength in key $600k-
                                                                                                                        $900k pricing category
EBIT2                                                          137                    137                65
                                                                                                                      • Residential EBIT lower due to timing of
Trading Cash Flow2                                               95                   95               118              settlements and lockdown taking place
ROFE3 %                                                       21%                 21%                 11%               during key selling period (post-COVID-19
Capex
                                                                                                                        sales flowing through into FY21)
                                                                  7                      7                3
                                                                                                                      • 666 (627 dwellings and 39 sections) units
Cash Conversion4                                              64%                 64%               177%
                                                                                                                        sold vs 755 (735 dwellings and 20 sections)
                                                                                                                        in FY19
Residential EBIT2                                                84                   84                 63           • Land development EBIT includes first of two
Land Development EBIT2                                           56                   56                  6             sale transactions of a Penrith site, second
                                                                                                                        site sale delayed until FY21
Clever Core EBIT2                                               (3)                   (3)               (4)
                                                                                                                      • Cash flow supported by receipts from FY19
                                                                                                                        Land Development transaction and delays in
                                                                                                                        land purchases
                                                                                                                      • >4 years’ supply of lots under control, of
                                                                                                                        which c67% are on balance sheet

41
                                                                              1 Jun 2019 12 months pro forma is Jun 2019 12 months reported adjusted for IFRS 16
        Fletcher Building Full Year Results Presentation | © August 2020      2 Before significant items
                                                                              3 EBIT/Closing Funds
                                                                              4 Cash conversion = FCF/EBIT
Construction
Results overview
                                                        Jun 2019             Jun 2019
                                                      12 months            12 months           Jun 2020
NZ$m                                                   Reported            pro forma1        12 months

Gross Revenue                                                1,702              1,702               1,318            • Paving, earthworks, civil works halted
EBITDA2                                                          68                   89             (107)             through Level 4 lockdown impacting
                                                                                                                       revenues
Underlying EBIT2                                                 47                   51                  3
                                                                                                                     • EBIT also impacted by wet first quarter,
Buildings and Infrastructure Provisions                            -                     -           (150)
                                                                                                                       reducing bitumen and asphalt volumes in
EBIT2                                                            47                   51             (147)             Higgins
Trading Cash Flow2                                           (210)               (210)               (148)           • Buildings and Infrastructure provisions of
ROFE3 % (ex Buildings)                                        15%                 17%               (50%)
                                                                                                                       $150m mainly from COVID-19 shutdowns
                                                                                                                       and productivity impacting both FY20 and
Capex                                                            31                   31                 32
                                                                                                                       beyond
Cash Conversion4                                               NM                     NM               NM
                                                                                                                     • Cash flow driven by Buildings projects
                                                                                                                       outflow of $213m as key projects near
Revenue backlog                                              1,445              1,445               2,929
                                                                                                                       completion
                                                                                                                     • Profile of work shifting to more balanced
                                                                                                                       portfolio with $2.4b of revenue backlog that
                                                                                                                       has a better margin outlook and lower and
                                                                                                                       more appropriate risk profile

42
                                                                              1 Jun 2019 12 months pro forma is Jun 2019 12 months reported adjusted for IFRS 16
        Fletcher Building Full Year Results Presentation | © August 2020      2 Before significant items
                                                                              3 EBIT/Closing Funds
                                                                              4 Cash conversion = FCF/EBIT
Australia
Results overview
                                                        Jun 2019             Jun 2019
                                                      12 months            12 months           Jun 2020
NZ$m                                                   Reported            pro forma1        12 months

Gross Revenue                                                  3,024            3,024               2,802            • Revenue held well relative to market decline,
EBITDA2                                                         119                   208              168
                                                                                                                       increase in Steel revenue, better trading in
                                                                                                                       May and June
EBIT2                                                            57                   77                 33
                                                                                                                     • Building Products: strong turnaround
Trading Cash Flow2                                               57                   57                 49            momentum in Laminex (new product range
ROFE3 %                                                          3%                   5%                2%
                                                                                                                       and digital offering) and Insulation with
                                                                                                                       earnings growth achieved despite subdued
Capex                                                            91                   91                 65            market activity. This performance was offset
Cash Conversion4                                                NM                    NM               NM              by c$15m of losses in Rocla and Iplex as
                                                                                                                       project work did not eventuate, general
                                                                                                                       volumes dropped
Building Products Aus. EBIT2                                     40                   47                 26
                                                                                                                     • Stramit and Tradelink both had poor 2H20 as
Distribution Aus. EBIT2                                           8                   15                  7            larger project volumes dropped significantly
Steel Aus. EBIT2                                                 11                   16                  5          • Trading cash flow supported from improved
                                                                                                                       inventory management and debtor collections
Divisional costs                                                 (2)                  (1)               (5)
                                                                                                                       but impacted by restructuring costs
                                                                                                                     • Divisional costs movement mainly due to one-
Divisional Exposure                                Resi, 57%                      Com, 29%         Infra, 14%
                                                                                                                       off pension valuation benefit of $2m received
                                                                                                                       in FY19

43
                                                                              1 Jun 2019 12 months pro forma is Jun 2019 12 months reported adjusted for IFRS 16
        Fletcher Building Full Year Results Presentation | © August 2020      2 Before significant items
                                                                              3 EBIT/Closing Funds
                                                                              4 Cash conversion = FCF/EBIT
Results Announcement
                                (for Equity Security issuer/Equity and Debt Security issuer)

Results for announcement to the market
Name of issuer                     Fletcher Building Limited
Reporting Period                   12 months to 30 June 2020
Previous Reporting Period          12 months to 30 June 2019
Currency                           NZD
                                          Amount (000s)                       Percentage change
Revenue from continuing                     $7,309,000                              (12%)
operations
Total Revenue                               $7,309,000                              (21%)
Net profit/(loss) from                       ($196,000)                             N/A
continuing operations
Total net profit/(loss)                      ($196,000)                             N/A
Final Dividend (Not Applicable)
Amount per Quoted Equity           The Board has not declared a final dividend for FY20.
Security
Imputed amount per Quoted
Equity Security

Record Date
Dividend Payment Date
                                           Current period                 Prior comparable period
Net tangible assets per                         $2.87                               $3.53
Quoted Equity Security

A brief explanation of any of      Fletcher Building Limited recorded a net loss of ($196,000,000) in
the figures above necessary        FY20, compared to a net profit in FY19, therefore the percentage
to enable the figures to be        change is not meaningful.
understood

Authority for this announcement
Name of person authorised to
                                   Andrew Clarke, Company Secretary
make this announcement
Contact person for this
                                   Aleida White, Head of Investor Relations
announcement
Contact phone number               +64 21 155 8837

Contact email address              investor.relations@fbu.com

Date of release through MAP        19/08/2020

Audited financial statements accompany this announcement.
You can also read