2020 HALF-YEAR RESULTS - Unibail-Rodamco-Westfield

Page created by Danny May
 
CONTINUE READING
2020 HALF-YEAR RESULTS - Unibail-Rodamco-Westfield
2020 HALF-YEAR RESULTS
2020 HALF-YEAR RESULTS - Unibail-Rodamco-Westfield
Disclaimer

Unibail-Rodamco-Westfield S.E., a Société Européenne à Directoire et Conseil de Surveillance incorporated under French law, is a listed property investment
company. Unibail-Rodamco-Westfield S.E. is listed on Euronext Amsterdam and Euronext Paris. The value of your investment may fluctuate. Past performance is no
guarantee for the future.

The information in this presentation has been included in good faith but is for general informational purposes only. All reasonable care has been taken to ensure
that the information contained herein is not untrue or misleading. It should not be relied on for any specific purpose and no representation or warranty is given as
regards its accuracy or completeness.

Certain of the statements contained in this release are statements of future expectations and other forward-looking statements. These expectations are based on
management's current views and assumptions and involve known and unknown risks and uncertainties. Actual results, performance or events may differ materially
from those in such statements due to, among other things, (i) general economic conditions, in particular economic conditions in the core markets of Unibail-
Rodamco-Westfield S.E., (ii) performance of financial markets, (iii) interest rate levels, (iv) currency exchange rates, (v) changes in laws and regulations, and (vi)
changes in the policies of governments and/or regulatory authorities. Unibail-Rodamco-Westfield S.E. assumes no obligation to update any forward-looking
information contained in this document. Any opinions expressed in this presentation are subject to change without notice. The presentation should not be
regarded by recipients as a substitute for the exercise of their own judgment. Investors should seek financial advice regarding the appropriateness of investing in
any securities or investment strategies discussed or recommended in this presentation and should understand that statements regarding future prospects may not
be realised. It does not constitute an offer to purchase any securities or a solicitation to purchase or subscribe securities neither in the United States nor in any
other country where such offer or solicitation is restricted by applicable laws or regulations.

Neither Unibail-Rodamco-Westfield S.E. nor any affiliates nor their or their affiliates’ officers or employees shall be liable for any loss, damage or expense arising
out of any access to or use of this presentation, including, without limitation, any loss of profit, indirect, incidental or consequential loss.

No reproduction of any part of the presentation may be sold or distributed for commercial gain nor shall it be modified or incorporated in any other work,
publication or site, whether in hard copy or electronic format.

                                                                                                                                                 2020 HALF-YEAR RESULTS   2
2020 HALF-YEAR RESULTS - Unibail-Rodamco-Westfield
H1-2020 SUMMARY
2020 HALF-YEAR RESULTS - Unibail-Rodamco-Westfield
Mitigating the impact of an unprecedented crisis

                                    Q1                                    COVID-19                         May-June

       446 leases signed                                  Most centres closed               Restarted operations

       Tenant sales(1): +2.2%                             Preserved liquidity               Implemented health & safety

       Footfall(2): +2.0%                                 Supported communities             measures

       Collection rate: 94%                               Tenant relief                     Started tenant negotiations

                                                          Five French assets disposed       Focus on rent collection

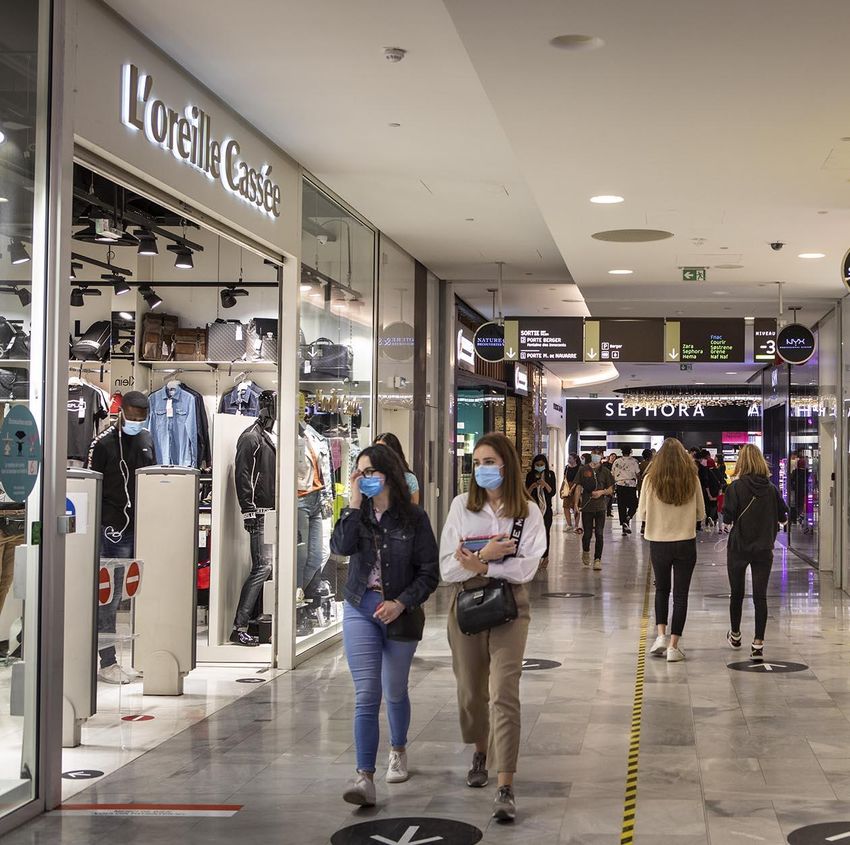
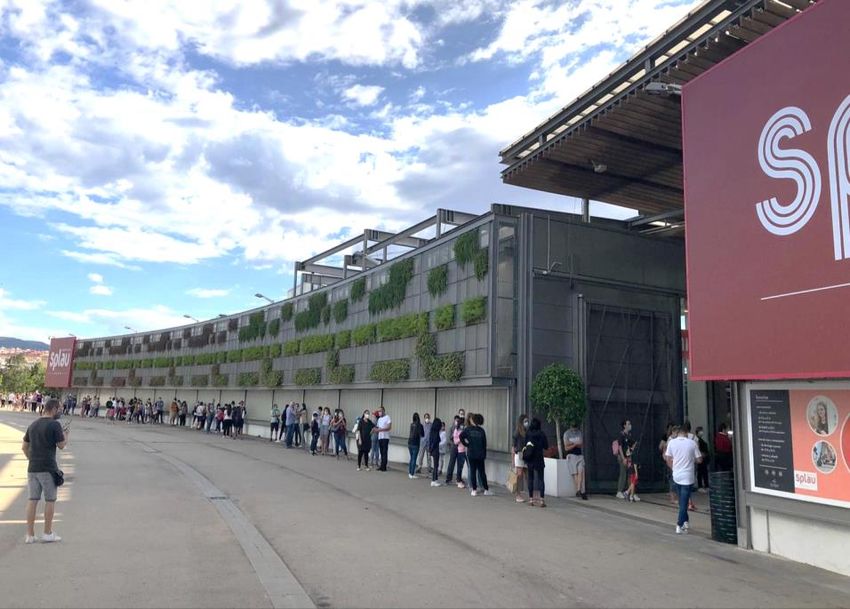
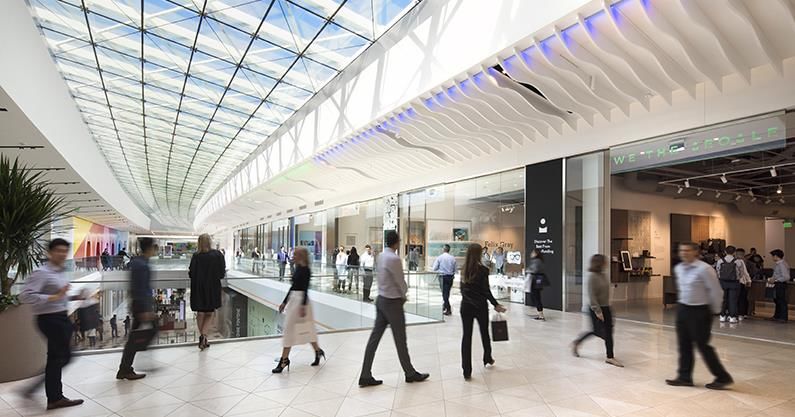
                                                                                            Footfall and sales recovering

 Westfield Valley Fair                               Westfield Sunrise                  Westfield London

(1)   Through February, groupwide, excluding Tesla
(2)   Through February, European centres only                                                                       2020 HALF-YEAR RESULTS   4
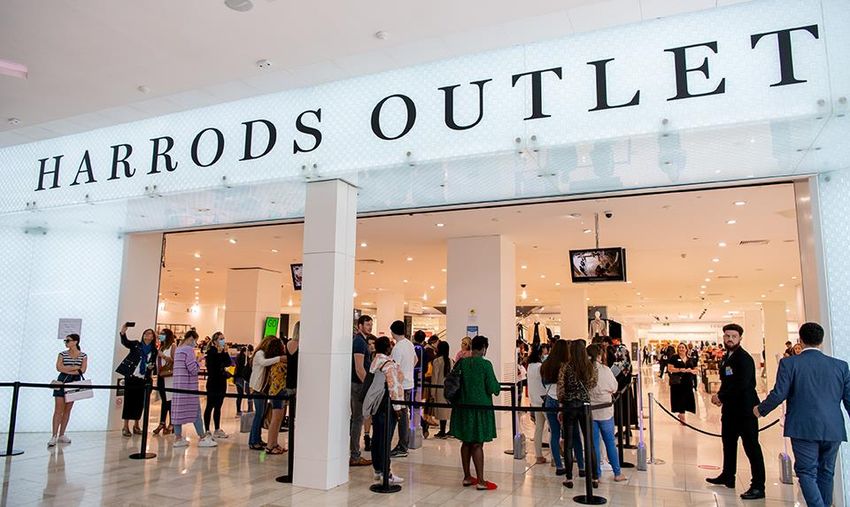
2020 HALF-YEAR RESULTS - Unibail-Rodamco-Westfield
FINANCIAL RESULTS
2020 HALF-YEAR RESULTS - Unibail-Rodamco-Westfield
2020 Half-Year Results
  € Mn                                                                               H1-2020              H1-2019       Growth    Lfl Growth
  Shopping Centres                                                                      1,008               1,137        -11.4%    -11.3%
  Offices & Others                                                                            42               62        -32.1%     +0.4%
  Convention & Exhibition                                                                     15               56        -73.2%    -73.2%

  Net Rental Income                                                                     1,065               1,254        -15.1%    -14.2%

  Recurring Net Result (Group share)                                                        667              916         -27.2%

  Recurring EPS                                                                           4.82               6.63        -27.2%

  Adjusted Recurring EPS(1)                                                             4.65                 6.45       -28.0%

  Per share data (€)                                                           June 30, 2020            Dec. 31, 2019   Growth
  EPRA NRV                                                                           197.00                228.80       -13.9%

(1)   The Adjusted Recurring Earnings are calculated based on the Recurring net result for the period
      attributable to the holders of the Stapled Shares minus the coupon on the Hybrid Securities
      Figures may not add up due to rounding                                                                                       2020 HALF-YEAR RESULTS   6
2020 HALF-YEAR RESULTS - Unibail-Rodamco-Westfield
COVID-19
2020 HALF-YEAR RESULTS - Unibail-Rodamco-Westfield
Calendar of reopenings
                      March                              April                              May                             June                  July

                              March 15                                                May 11 May 15

                              March 16                                              May 2                         May 29

                               March 18                                                     May 11         May 22

                               March 17                                                     May 11                                   June 22

                              March 16                                   April 20           May 11
                                                                                                                                                                   Weighted average
                              March 15                                                                             June 1
                                                                                                                                                                   closure period(1):
                            March 14                                                  May 4              May 18

                               March 18                                                                                        June 15                             67 days
                              March 16                                                                    May 20

                              March 15                                                                      May 25          June 8

                                   March 23                                                                                    June 15

                               March 18                                                         May 15

               All non-essential stores closed                      Partial restrictions (F&B, Cinemas, Regions/Centres)                       Full reopening(2)
(1)   Weighted based on FY-2019 NRI. Closing days for Sweden and The Netherlands considered to be zero
(2)   All retailers able to open excluding select exceptions where applicable (e.g. certain leisure
      activities)                                                                                                                                                       2020 HALF-YEAR RESULTS   8
2020 HALF-YEAR RESULTS - Unibail-Rodamco-Westfield
Responding to the crisis: preserving liquidity…

  Credit lines: partly drawn                             As at June 30, 2020
  Debt: raised €2.2 Bn senior bonds

  Final dividend: cancelled (€748 Mn)
                                                         €12.7 Bn
                                                         of cash on hand
  Non-essential capital expenditure: ~€500 Mn deferred   and undrawn
  Development pipeline: removed a further €1.6 Bn        credit lines
  Partial activity and furlough schemes: implemented

  Gross admin expenses: ~€60 Mn annualised savings

                                                                  2020 HALF-YEAR RESULTS   9
2020 HALF-YEAR RESULTS - Unibail-Rodamco-Westfield
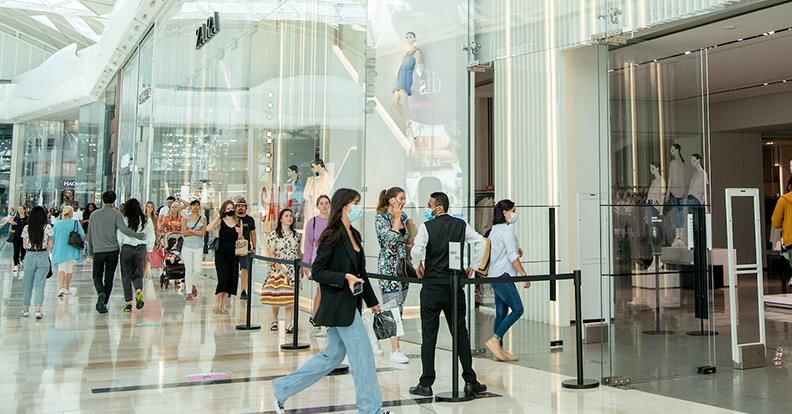
… supporting our communities…

               United States                         France
               Donating food to front line health    Created spaces in eight shopping
               care professionals and provide        centres for associations fighting
               daily necessities for families        domestic violence against women
               through NGOs

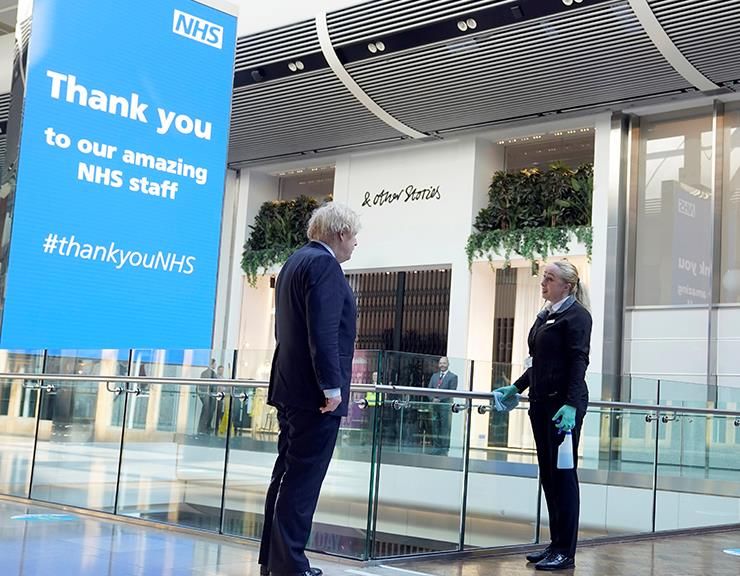
               United Kingdom                        United States
               Westfield London provided Queen       In several of URW’s assets
               Charlotte’s hospital with furniture   advertisement space was used to
               for the doctors & nurses break out    display messages to thank medical
               area                                  staff and other essential professions
                                                     for their service to society

               Czech Republic                        Poland
               Vending machines to sell hand         Wroclavia financed the 3D filament
               made masks sewn by jobless single     needed for the production
               parents                               of protection material for medical
                                                     staff by a local innovative NGO

                                                                      2020 HALF-YEAR RESULTS   10
… and our tenants…

  From quarterly to monthly payments

  April and May rents deferred for closed tenants

  No penalties for late Q2 payments

  No decision on rent relief in the middle of the crisis

  −   Ad-hoc discussions started in May

  Flexibility in opening hours without contractual penalties

                                                               Westfield Forum des Halles

                                                                                            2020 HALF-YEAR RESULTS   11
… and ensuring safe reopenings

  Partnering with Bureau Veritas
  for “Safe & Healthy Places” label

  Intensifying cleaning of common areas

  Sanitiser stations

  Social distancing: one way system, waiting lines, …

  Increased fresh air circulation

                                                        2020 HALF-YEAR RESULTS   12
Disposal of five French shopping centres successfully completed

                                                   Disposal of 54.2% interest in €2.0 Bn retail portfolio(1)

 Aéroville                                      So Ouest                                      Confluence          Rennes Alma   Toison d’Or

                                                                                              URW NDP : €1.5 Bn
                                                                                                           (2)

(1)   Crédit Agricole Assurances and La Française hold 54.2% of the newly formed Entity. €1.0 Bn
      secured financing
(2)   Net Disposal Proceeds                                                                                                                   2020 HALF-YEAR RESULTS   13
Footfall in regions reopen 11 to 12 weeks approaching 80 - 90%
 of normal footfall
            110%

            100%

              90%

              80%

              70%

              60%

              50%

              40%
                          Week 1           Week 2           Week 3           Week 4           Week 5      Week 6   Week 7   Week 8   Week 9   Week 10   Week 11    Week 12

                                                                                 FR group 1(1)             AT        DE        DK        CE

(1)   Confluence, Les Ulis 2, Polygone Riviera, Rennes Alma, So Ouest, Toison d’Or, Villeneuve 2 and
      Westfield Euralille
NB: Year-on-year change in footfall versus the same week LY. Week 1 is first week after reopening. Data
excludes Zloty Tarasy as not managed by URW and Gropius Passagen and CH Ursynow due to ongoing
works                                                                                                                                                             2020 HALF-YEAR RESULTS   14
Spain and later opening centres in France show a similar trend
              100%

                90%

                80%

                70%

                60%

                50%

                40%
                               Week 1                   Week 2                    Week 3                Week 4       Week 5            Week 6         Week 7   Week 8

                                                                   ES                   FR group 2(1)            Avg of regions opened in early May

(1) Aéroville, Westfield Parly 2, Westfield Rosny 2, Westfield Vélizy 2, and Westfield Carré Sénart
NB: Year-on-year change in footfall versus the same week LY. Given differing reopening dates week 1
= week commencing June 1 for France and June 8 for Spain                                                                                                       2020 HALF-YEAR RESULTS   15
Very large urban centres are still lagging
            100%

             90%

             80%

             70%

             60%

             50%

             40%

             30%

             20%
                             June 1                  June 8       June 15   June 22         June 29   July 6   July 13   July 20

                                                                            FR group 3(1)        UK

(1) CNIT, Westfield Les 4 Temps and Westfield Forum des Halles.
NB: Year-on-year change in footfall versus the same week LY.                                                                2020 HALF-YEAR RESULTS   16
CBDs will recover as people go back to work
                                                                         Workplace Mobility Trends(1)
                                 20

                                 10

                                  0

                                 -10
        % compared to baseline

                                 -20
                                                                                                                 Austria

                                 -30                                                                             France
                                                                                                                 Germany
                                 -40                                                                             Netherlands
                                                                                                                 Spain
                                 -50
                                                                                                                 Sweden
                                                                                                                 United Kingdom
                                 -60

                                 -70

                                 -80

                                 -90

(1)   Source: Kempen Daily; Google COVID-19 Community Mobility Reports                                  2020 HALF-YEAR RESULTS    17
Sales impacted less than footfall:
  higher conversion and average basket
                                                                             YTD                       June 2020(1)                                                      June 2020(1)
                                                                         February 2020

  France                                                                       +1.0%                     -19.1%       Home                                                  +5.6%

  Central Europe                                                               +5.3%                     -24.6%       Culture & Media & Technology                          +1.7%

  Spain                                                                        +2.6%                     -18.7%       Food Stores & Mass Merchandise                         -0.1%

  Nordics                                                                      +3.5%                     -20.2%       Jewellery                                              -7.7%

  Austria                                                                      +0.4%                     -13.8%       Gifts                                                  -8.3%

  Germany                                                                      +6.6%                     -18.4%       Sport                                                -10.5%

  The Netherlands                                                                  NA                        NA       Health & Beauty                                      -10.6%

  Total Continental Europe                                                    +2.7%                     -19.7%

  UK                                                                           +1.3%                         NS
                                                                                                                                                -7.6%
                                                                              +2.5%                          NS           excluding fashion categories, F&B and entertainment(2)
  Total Europe

  US                                                                           +1.6%                         NS

  Total Group                                                                 +2.2%                          NS

(1)   Only centres that were open throughout June, therefore excluding Westfield Forum des Halles,
      Carrousel du Louvre, Westfield Les 4 Temps in France and Parquesur, La Vaguada, La Maquinista,
      Glòries, Splau and Equinoccio in Spain.
(2) Excluding fashion, bags & footwear & accessories and department stores, as those were
      particularly impacted by the postponement of summer sales in France, and F&B and
      entertainment as some restrictions stayed in place
                                                                                                                                                            2020 HALF-YEAR RESULTS   18
NB: Sales exclude Tesla
Update on retail rent collection
                                                                   Q2 collection rates

                            Q1 collection
                            94%
                                                             38%

                                                                             3%

                            Q2 collection        100%                                        20%
                            38%
                                                             62%             59%

                                                                                             39%                   39%

                            July collection
                            50%                 Invoiced   Collected    Relief granted   Deferred or              Due
                                                                                                     (1)
                                                                                         not due yet

(1) Deferred until after July 31
NB: including services charges, as at July 24                                                          2020 HALF-YEAR RESULTS   19
Update on tenant negotiations

      Broad principles:                                    Typical concessions required:
      Case by case                                         Extension of firm lease period
                                                                          (1)
      Fair burden sharing                                  Increase of SBR percentage

      No relief for tenants that traded well throughout    Waiver of co-tenancy provisions (US)
      the crisis
                                                           New landlord break-options
      No relief for service charges
                                                           Signature of leases for new stores
      More relief for SMEs and F&B operators

                                        Around 25% through the process

(1)   Sales Based Rent                                                                            2020 HALF-YEAR RESULTS   20
OPERATIONAL HIGHLIGHTS IN BRIEF
Leasing activity reflects different market
  contexts
                                         29.0%                          MGR uplift

           15.4%
                          14.1%

                                                                        6.5%
                                                                                                                                        Leases signed(1)
                                                                                                             5.5%
                                                         2.9%

                                                                                      -0.7%

                                                                                                                               -8.1%
                                                                                                                                          661 (-44%)

                                                                                                                      -13.7%

                                                                                                    -30.8%

              FR             CE             ES            NO             AT             DE              NL    Cont.    UK       US(2)
                                                                                                             Europe

(1)   Standing assets only
(2)   Average rental spreads (definition in line with US market practices) -1.2% in H1-2020, of which
      +2.6% in Flagships and -12.2% in Regionals                                                                                                 2020 HALF-YEAR RESULTS   22
Bankruptcies and vacancy reflect impact of COVID-19

                               Cont. Europe                UK                   US                  URW
   # of stores                        235                   21                  135                  391
   In place                            228                  21                  106                  355
   Replaced                              3                                       2                    5
                                                                                                                                                                             10.1%
   In place / replaced                98%                 100%                  80%                  92%
   Vacant
                                                                                                                                                                        9.1%
                                         4                                       27                   31
                                                                                                                                                               8.6%
                                                                                                                                  8.2% 8.1%
                                                                                                                                                            7.7%
                                                                                 6.9%

                                                                                                                    4.6%
                                                           4.1%                                                                                    3.9%
             3.2%                                                          3.3%                                  3.4%
                                     3.1%
         2.6%                                                                                                                                  2.5%
                                                                                                          2.0%
                               1.3%                                                                 1.1%
                                                     0.7%

              FR                    CE                    ES                    NO                    AT           DE                NL       Continental     UK            US
                                                                                                                                                Europe
                                                                                                     FY-2019            H1-2020

N.B: EPRA vacancy, shopping centres only. Group vacancy increased from 5.4% as at FY-2019 to 6.8%
as at H1-2020                                                                                                                                                         2020 HALF-YEAR RESULTS   23
Openings

Westfield Mall of Scandinavia (February 21)   Westfield Parly 2 (July 6)     Gropius Passagen (May 29)   Westfield Les 4 Temps (June 29)

Westfield Valley Fair (March 5)               Westfield Vélizy 2 (July 13)   Westfield UTC (May 1)       Shopping City Süd (June 20)

                                                                                                                                  2020 HALF-YEAR RESULTS   24
Opening first ever Harrods outlet

       Harrods outlet opened on July 3, 2020, replacing Debenhams in Westfield London

                                                                                   2020 HALF-YEAR RESULTS   25
Signings helping to diversify our retail-mix

                 Westfield Old Orchard                    La Part-Dieu                          Westfield                            Westfield
                                                                                           Mall of Scandinavia                     Stratford City

Westfield Valley Fair             Westfield Valley Fair                  Westfield Valley Fair               La Part-Dieu &                     Westfield Valley Fair &
                                                                                                           Westfield Valley Fair                Westfield Century City

                  Westfield Hamburg                   Donau Zentrum                        Westfield Valencia                     Westfield
                                                                                                                             Mall of Scandinavia

                                                                                                                                                    2020 HALF-YEAR RESULTS   26
FUTURE OF RETAIL
Will the surge in online persist?

  Credit card transactions in store and distance sales(1)
  Daily YoY(%) credit card transactions in 2020 vs. comparable day in 2019

                                        start lockdown                                 end lockdown

                                    Total                In-store sales               Distance sales

(1)   For France. Cartes Bancaires CB, Insee. Distance sales include e-commerce, mail-order, and
      phone or tele-sales                                                                              2020 HALF-YEAR RESULTS   28
People like to shop
                                                                   “What do you want to do straight after the lockdown?”
                               Visit family and friends                                                                                   64%
                                    Walk on the street                                                                              52%
                  Have a walk in a park or by the sea                                                                         48%
                              Invite friends for dinner                                                                 45%
                            Eat out at a friends' house                                                           42%
                          Go to a restaurant or a bar                                                            41%
                       Make a weekend trip in France                                                          39%
                                Go to the hairdresser                                                        38%
                              Go to a shopping centre                                                 33%
                                       Do sport outside                                             32%
                                   Go to a foodmarket                                            30%
                                       Go to the office                                       28%
                          Make a weekend trip abroad                                        27%
                         Go to the cinema or theater                                       26%
                              Go to a hardware store                                    24%
                            Go to a department store                                   23%
          Visit a close relative in a retirement home                                22%
                          Go to a fastfood restaurant                               21%
                                           See a doctor                          19%
                                 Take a medical exam                           18%
                                      Go to the dentist                        18%
                                     Go to a bookshop                         17%
                                  Go to the post office                    15%
                                         Go to the gym                     15%
                                   Go to a sport store                     15%
                    Make an admnistrative procedure                     13%
                             Go to the swimming pool                    13%
                                 Take public transport                  13%
                                  Go to a beauty shop                  12%
                                           Take a plane              11%
                                        Go to an aiport              11%
                                 Go to the beautician                11%
                                            Take a train           10%
                                           Go to school          9%
                                   Go to a sport event           9%                                       Splau
                                           Go to a bank          9%
                                      Go to a nightclub         8%
                                  Go to a phone store      6%
Source: BVA Group for France                                                                                                              2020 HALF-YEAR RESULTS   29
Successful retailers remain committed to omni-channel model

    Stores   are critical to the            We continue to increase                 We don't regret for a moment rapidly
implementation of the following         UNIQLO store numbers in each          expanding our retail footprint. … we'll be excited
three key strategic areas:              markets and areas in which we         to sign new leases, and we think that, out of this
digitalisation, integration between     operate, and open global flagship     crisis, there are going to be really great deals that
stores & online, and sustainability.    stores and large-format stores in     we'll be able to broker with landlords. There are
Stores will also play a stronger role   major cities around the world         going to be some companies that need more space,
in the development of online sales      to instill deeper and more            and we'll be one of them.
due to their digitalisation and         widespread empathy for UNIQLO’s
capacity to reach customers from        LifeWear concept.
                                                                              The footprint of our stores might increase. That
the best locations worldwide.
                                                                              would allow us to have more flexibility, and have a
                                                                              greater number of customers in our store while
                                                                              maintaining a safe physical distance. There's no
                                                                              question that we want to continue to expand the
                                                                              number of eye exam rooms that we have.

          Strategy 2022 Interim Three                Third Quarterly Report             Shopify interview with Dave Gilboa, co-founder
        Months 2020 & Strategy update                              2019/20                     and co-CEO of Warby Parker – June 2020

                                                                                                                     2020 HALF-YEAR RESULTS   30
Accelerated digitalisation strategy
                                            Engage customers                                   Extend value in retailers
                                       in a digitalised experience                                digital ecosystems

                             Crowd management                        Unified omnichannel                    Connect: unified
                                                                          experience                       platform of services
                                Westfield Club
                             transactional loyalty
                                   program                               Click & Services
                                                                                                           Flexible retail space

                                 Smart Parking                         Centralised returns
                                                                                                          Digitised offer through
                             Answers on the spot                        Curbside pick-up                   Zalando partnership

                                Line Pass digital                        Home delivery
                                    booking                                                                   Food delivery

                        Enriching database and audience                                  Enriching retailers omnichannel activities
                         Already 14.7 million reachable visitors

Visitor services     e-commerce activities
Operations on site   Click & Collect                                                                                                2020 HALF-YEAR RESULTS   31
Digitalisation H1-2020 key achievements

 Scaling digitalisation by partnering with the best

      Offer digitisation                                            Food delivery                                       Westfield Club                  Renewed audience

       Maximise sales from stores                                    Generate additional sales                           Frictionless customer            Extend reach partnering with
       by connecting physical                                        for restaurants                                     experience                       the 1st 100% video global
       stocks to the marketplace                                                                                                                          media brand
                                                                     Make URW Dining Experience                          Better know visitors
       Access to Zalando’s digital                                   available from home                                 by accessing                     Better engage with audience,
       audience                                                                                                          their transactional data         especially Millennials

5                  71%                                         26                       +51%                        16                 95k          >1.4 Mn 98%
countries(1)       of portfolio synergies(2)                   shopping centres         on food delivery sales(3)   shopping centres   members      reach per video(4)        positive interactions(4)

(1)   Ongoing roll-out in Germany, The Netherlands, Poland, Spain and Sweden
(2)   71% of 100 top retailers (in terms of number of stores) within URW’s German portfolio available
      on Zalando
(3)   R12M from deliveries in France (Westfield Vélizy 2, Westfield Rosny 2, Westfield Parly 2,
      Westfield Les 4 Temps, Rennes Alma, Polygone Riviera, Confluence and Aéroville)
(4)   For the last video published on the reopening of Westfield Les 4 Temps                                                                                             2020 HALF-YEAR RESULTS   32
Solid CSR foundations to build on for post COVID-19 preferences

                    -50% carbon emissions              100% of owned & managed assets                 100% Group employees with yearly
                 across our value chain by 2030   with a community resilience action plan by 2020       individual CSR objectives by 2020

       LEED Gold certification obtained             World’s largest urban farm                      84% of the Group employees took
       for Palisade at Westfield UTC                (14,000 sqm) on Paris Expo Porte                part in the URW Volunteering
       EPA Top 30 List for companies                de Versailles’ rooftop                          programme(2)
       generating and consuming green               Almost 65,000 meals saved                       Dedicating 18,000+ hours to civic
       power on-site                                with Too Good to Go(1)                          initiatives(2)

(1)   January to May 2020
(2)   In 2019                                                                                                                CONFIDENTIAL DOCUMENT   33
CSR strategy recognized

                                Reconfirmed index inclusions   URW stands out as industry leader(1)

                                        World 120
                                     Eurozone 120
                                       Europe 120
                                        France 20
                                                                            Prime
                                                                                B

(1)   ISS 2020 rating. Up from C+ in 2019                                               2020 HALF-YEAR RESULTS   34
POST-COVID: OFFICES AND C&E
Future of offices
          76%                                  73%                                 16%
of employees miss                      of employees                        of people who
  their offices(1)                      don’t have                       worked from home
                                     a dedicated space                   do not want to do
                                    for home working(1)                   so in the future(2)

         Attracting talent                               Fostering creativity

           Team building                                  Enhancing diversity

                                                       Offices will remain even as space requirements change

(1)   Deskeo Study – “Coronavirus & télétravail: 76% des Français regrettent déjà leur bureau”
      – March 26 2020
(2)   AlphaWise, Morgan Stanley Research (survey of 4,500 European office workers)                             2020 HALF-YEAR RESULTS   36
Future of C&E
                                                                                        Anticipated recovery of C&E business
     125                                                       95
     events held                                               events postponed
                                                                                      Restart of activities    September 1, 2020
                                                               (o/w 26 to 2021)

     191                                                       235                    Recovery                 2021
     events cancelled                                          events planned in Q4

                                                                                      Back to “normal”          2022

                                                                                      Paris Olympics           From H2-2023

Le Perchoir, Paris Portes de Versailles

NB: events cancelled or postponed reflect data up to July 29                                                    2020 HALF-YEAR RESULTS   37
DEVELOPMENT
Pipeline overview

      €10.3 Bn                  +€0.1 Bn

                                                                  €8.3 Bn
                                                  -€2.1 Bn
                                                                                 -€0.5 Bn
                                                                                                                   €6.2 Bn

                                                                                                    -€1.6 Bn
                                                                                                                   €2.7 Bn
                                                                                                                                                    €4.0 Bn
                                                                                                                               -€2.2 Bn
                                                                                                                                                     €2.5 Bn

                                                                                                                   €3.6 Bn

                                                                                                                                                     €1.6 Bn

        H1-2019                 Deliveries &   Removed projects   FY-2019       Deliveries &    Removed projects   H1-2020   Invested to date       Remaining
                                  changes                                         changes

                                                                       Committed(1)            Controlled(1)

(1) Please refer to the MD&A for definition
Figures may not add up due to rounding                                                                                                     2020 HALF-YEAR RESULTS   39
Rebalancing retail
                                                                            URW repositioning space in standing
                                                                            assets
                                                                             Transformation of House of Fraser unit into
                                  Dining & leisure greenfield /
                                  brownfield
                                                                             7,500 sqm co-working, 1,050 sqm wellness
                                  11%                    Dining & leisure    and 1,050 sqm retail
                                                         ext / renovation
                 Retail ext /                            8%
                  renovation
                         11%

32%                             1.0 million sqm                   Offices
Retail
                                    pipeline                      30%

         Retail greenfield /
                 brownfield
                        21%

                                                    Hotels
                                 Residential        11%
                                 8%

                                                                            Westfield London

                                                                                                          2020 HALF-YEAR RESULTS   40
Update on deliveries

      GLA                  Delivered                    GLA                   Delivery             GLA              Delivery           GLA             Delivery         GLA              Delivery
      +46,700 sqm          March 2020                   49,500 sqm            H2-2020              +32,800 sqm      H2-2020            51,300 sqm      H1-2021          +86,500 sqm      H1-2021

      URW ownership        Pre-letting(1)               100% TIC              Pre-letting(1)       100% TIC         Pre-letting(1)     100% TIC        Pre-letting(1)   100% TIC         Pre-letting(1)
      50%                  82%                          €350 Mn               ~20%(2)              €440 Mn          91%                €170 Mn         100%             €630 Mn          76%
                                                        URW ownership                              URW ownership                       URW ownership                    URW ownership
                                                        100%                                       100%                                100%                             100%

                                                                                                         COVID-19 impact:
                                                                                               Deliveries delayed between 2-6 months

(1)    Pre-letting: GLA signed, all agreed to be signed and financials agreed
(2)    URW plans to move its headquarters to the building in the summer of 2021                                                                                                2020 HALF-YEAR RESULTS     41
FINANCING
Extending debt maturities
  Euro Senior Bonds                                                                                        Refinancing maturing LT debt

                                                    April                                                      €2.1 Bn                    €2.2 Bn
                                                                                           Avg coupon:
                                     5-years                                    10-years      2.27%
             €600 Mn                                                  €800 Mn
                                     2.125%                                     2.625%

                                                    June

                                                                                           Avg maturity:
                                                                 12-years                   9.3 years
                                          €750 Mn
                                                                 2.0%
                                                                                                           Bonds maturing in 2020(1) Bonds issued in H1-2020

(1)   Average maturity at issuance 6 years and average coupon 2.74%                                                                  2020 HALF-YEAR RESULTS   43
Cost of debt and maturity
                                  Average Cost of Debt                                                                  Average Maturity
                                                                                                                            (years)
                                                                                                                                                           8.2
                                                                                                                                                                  8.5(2)
      3.9%
                3.6%                                                                                                                              7.5
                          3.4%                                     EUR(1)        USD & GBP                                                 7.2
                                                                   1.1%           3.6%                                               7.0

                                     2.9%                                                                                      6.5
                                              2.6%                                                                       5.9
                                                                                                                  5.4
                                                     2.2%
                                                                                                            4.9
                                                                                                      4.5
                                                            1.6%                                4.3
                                                                          1.6%    1.6%   1.7%

                                                                   1.4%

(1)    Including SEK
(2)    Taking into account the cash on-hand                                                                                                      2020 HALF-YEAR RESULTS    44
Very strong liquidity: record level of cash and undrawn credit
 facilities

€14 Bn
                                                                                                                                      €12.7 Bn
€12 Bn

€10 Bn

 €8 Bn

 €6 Bn

 €4 Bn

 €2 Bn

 €0 Bn
                2007           2008           2009             2010   2011   2012   2013   2014   2015   2016   2017   2018   2019         H1-2020

NB: From 2007 to 2017 Unibail-Rodamco, from 2018 onwards URW                                                                  2020 HALF-YEAR RESULTS   45
Well spread debt maturity profile
            4,000

            3,500

            3,000

            2,500
in EUR Mn

            2,000

            1,500

            1,000

             500

              -
                    H2-2020 2021         2022       2023       2024       2025       2026       2027   2028   2029    2030     2031   2032      2033    2034   2036   2037      2038      2039+

                                         Unsecured bonds                    Secured bonds              Convertibles          Short term paper          Loans & mortages

(1) URW’s IFRS debt profile as at June 30, 2020. On a proportionate basis
Excluding from chart: €1,250 Mn Hybrid NC 2023 and €750 Mn Hybrid NC 2026 treated as equity under
IFRS                                                                                                                                                                         2020 HALF-YEAR RESULTS   46
DISPOSALS, BALANCE SHEET
        AND NAV
URW’s commitment to disposals

 €6.0 Bn

                               +€2.8 Bn         €4.0 Bn
                                                            On-going    €4.0 Bn in the next several years
                                                            processes
                                                                        −   Approx. 50% retail

                                                                        Pragmatic approach

                 -€4.8 Bn

Feb '19 target    Realized   Increased target   Remaining

                                                                                                 2020 HALF-YEAR RESULTS   48
Credit ratios

                                            LTV                                                           ICR(1)

                                                                       60%

                                                                                                                                      6.9
                                                                                                                                            6.1
      42%                                                                                                                      5.9                5.7
                        33%                                              41.5%
                                          32%
40%
                                                                                              4.6                        4.6
                                                  38%                                  4.0                4.1                                            4.2
30%                                                                                                 3.8
                                                         33%                                                       3.5
                                                                                 2.5         3.5
                                28%
                                                                                                                                                  2.0

                 Typical covenant level                 Target range

(1)   On a 6 month basis for HY metrics                                                                                         2020 HALF-YEAR RESULTS    49
Transparent LTV calculation - Based on the covenants

                                net financial debt (excluding current accounts with non-controlling interests)(1)
          LTV =
                       total assets (including transfer taxes and excluding goodwill not justified by fee business)

      Covenants: calculated under                                                   Under IFRS: Hybrid = equity   “V” consists of(3):
      IFRS(2)                                                                                                     Cash-flow generating assets
                                                                                                                     €56.1 Bn of Real Estate and
                                                                                                                  tangible assets
                                                                                                                      €1.8 Bn of cash-flow generating
                                                                                                                  intangibles(4)

                                                                                                                     €0.8 Bn of future fee business
                                                                                                                     Excl. €1.4 Bn of goodwill not
                                                                                                                  justified by fee business

(1)   Restated for the impact of derivative instruments on debt raised in foreign currencies
(2)   Typical European credit facilities covenants (strictest covenants for the Group) set at a
      maximum Group LTV of 60%
(3)   The LTV calculation also includes certain IFRS adjustments not shown here
(4)   Including DD&C, Property Management services and Airports                                                                          2020 HALF-YEAR RESULTS   50
Ample headroom under covenants
                                                     0%
       GMV change
       (in %)(1)                                                                       -5%
                                                                                              -10%
                                                                                                        -15%
                                                                                                                   -20%
                                                                                                                                   -25%

      GMV impact                                      €0 Bn                        -€3 Bn    -€5 Bn    -€8 Bn    -€11 Bn        -€13 Bn

      LTV                                             41.5%                        43.5%     45.8%     48.2%      51.0%           54.1%

      Implied Δ NIY(2)                                 0 bps                      +26 bps    +54 bps   +87 bps   +124 bps      +167 bps

      Remaining
                                                     €18 Bn                        €15 Bn    €12 Bn    €10 Bn     €7 Bn           €4 Bn
      headroom(3)

(1)   Applied to Shopping Centres, Convention & Exhibition and Services
(2)   Shopping centres only
                                                                                                                            2020 HALF-YEAR RESULTS   51
(3)   Remaining headroom before reaching an IFRS LTV of 60% (typical covenant level)
EPRA NRV evolution                                                                                                                       Non Lfl
                                                                                                       Recurring                        revaluation
                                                                                                 2       EPS                                 &
                                  EPRA Net Reinstatement Value                (1)                      +€4.82                            intangible
                                                                                                                                           assets
                                           (per share)                                           -3                                       -€10.56
        €228.80
                                                                      €222.87
                                    -€5.40           -€0.53                         €197.00
                                                                                                 -8                                     Rent effect
                                                                                                         Asset
                                                                                                                                           -€3.60
                                                                                                      revaluation
                                                                                                -13
                                                                                                       -€26.26

                                                                                                -18                                     Yield effect
                                                                                                                                          -€12.10

                                                                                                -23

                                                                                                -28
                                                                                                        Other
                                                                                                       -€4.43

                                                                                                                    GMV: €60.4 Bn
      December 2019                 Dividend     Mtm of financial   December 2019   June 2020
                                                     assets           Pro-forma
                                                                                                                Lfl revaluation: -5.1%

(1)    Hybrid securities are excluded from NAV                                                                                 2020 HALF-YEAR RESULTS   52
COVID-19: ACCOUNTING,
  AREPS AND CAPEX
Accounting implications of COVID-19

                                   P&L                                         Balance sheet

        Full impact of tenant negotiations not in H1       Trade receivables increased: €493 Mn(1)
        P&L:
                                                           −   Deferrals limited provisioning
         −   Few deals signed pre-closing
                                                           −   Collection rates will increase with:
         −   Deals with concessions from tenants must be
                                                                  •   Conclusion of negotiations
             straight-lined
                                                                  •   Legal proceedings if needed
        Rent relief in H1:
                                                           −   Remaining risks:
         −   Cash impact €32.6 Mn
                                                                  •   Tenant bankruptcies
         −   P&L impact €15.6 Mn
                                                                  •   Further voluntary deferrals

(1)   Proportionate                                                                                   2020 HALF-YEAR RESULTS   54
AREPS H1-2020

                                 -€0.16
                                                      -€0.22        -€0.11

                                                                                 -€0.57
                                                                                            -€0.25
                                                                                                       -€0.21                                +€0.03
                                                                                                                    -€0.24        -€0.07

            €6.45
                                                                                            -€1.45 COVID-19
                                                                                                                                             €4.62             €4.65

            AREPS              Disposals          Letting fees (1) P&L impact    Doubtful   Variable   Services   Convention &   Financial   Others            AREPS
           H1-2019                                                  COVID-19     debtors    income                 Exhibition    expenses                     H1-2020
                                                                   rent relief              streams

(1)   From H1-2020 no longer capitalised but expensed in the P&L                                                                                      2020 HALF-YEAR RESULTS   55
Capital expenditures deferred and costs reduced

         €500 Mn of CAPEX deferred            €60 Mn of annualised gross admin savings

 Development CAPEX of smaller / controlled   Partial activity and furlough schemes
 projects

 Operating CAPEX                             “Agility programme” in the US and UK

                                             Cuts in non-staff costs

                                                                                2020 HALF-YEAR RESULTS   56
2020 OUTLOOK
AREPS outlook for 2020
 AREPS:

  Significant impact of the COVID-19 pandemic on the Group

  Guidance withdrawn in March

  Continued risk of government measures to combat COVID-19

  −   California reimposed restrictions

  −   Reopening Convention & Exhibition business

  Collection of Q2 receivables ongoing - rents under negotiation with tenants

  Recovery of variable income streams

                                      New AREPS guidance not yet appropriate

                                                                                2020 HALF-YEAR RESULTS   58
URW.COM
You can also read