WHATCOM COUNTY 2008-2021 FOURTEEN-YEAR FERRY CAPITAL PROGRAM - Exhibit B to the Six-Year Transportation Improvement Plan
←
→
Page content transcription
If your browser does not render page correctly, please read the page content below
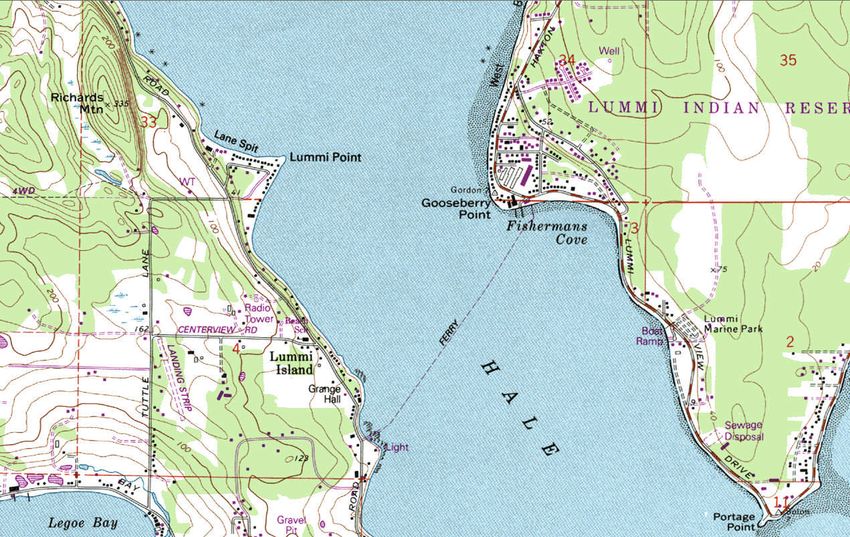
Exhibit B to the Six-Year Transportation Improvement Plan

   WHATCOM COUNTY
2008-2021 FOURTEEN-YEAR
 FERRY CAPITAL PROGRAM
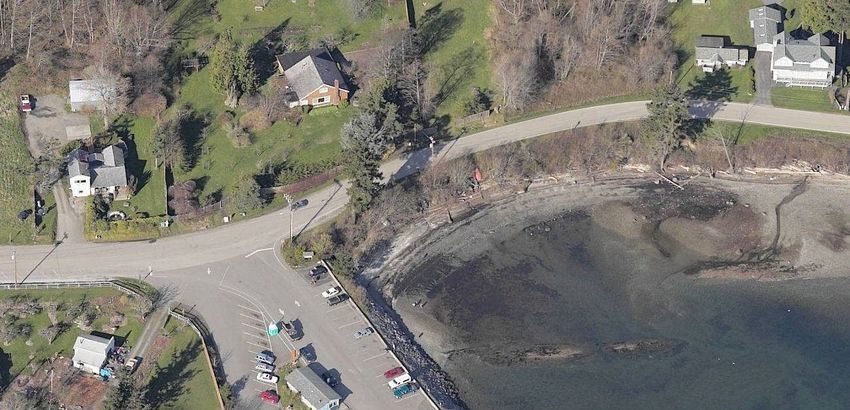
Table of Contents

1.    INTRODUCTION............................................................................................................................. 3
   1.1.     SYSTEM DESCRIPTION ...............................................................................................................................3
   1.2.     SERVICE DESCRIPTION ..............................................................................................................................3
   1.3.     FACILITY OVERVIEW ...................................................................................................................................4
      1.3.1. Lummi Island Terminal........................................................................................................ 4
      1.3.2. Gooseberry Point Terminal ................................................................................................. 7
      1.3.3. MV WHATCOM CHIEF Overview ....................................................................................... 9
2.    THE BASIS FOR THE REPORT ..................................................................................................... 9
   2.1.     PURPOSE OF THE REPORT .........................................................................................................................9
   2.2.     CITATIONS AND AUTHORITY .....................................................................................................................10
   2.3.     ORGANIZATION OF THE REPORT ..............................................................................................................10
3.    HISTORY OF THE FERRY SYSTEM ............................................................................................ 10
4.    2006-2007 ACTIVITIES RELATED TO THE FERRY SYSTEM ..................................................... 11
   4.1.     OVERVIEW ................................................................................................................................................11
   4.2.     STATUS OF THE NEW FERRY ...................................................................................................................11
   4.3.     SCHEDULE ISSUES ...................................................................................................................................11
   4.4.     RATE INCREASE........................................................................................................................................12
5.    2008-2021 CAPITAL IMPROVEMENT PLAN ............................................................................... 12
   5.1.     PROJECTED REVENUES ...........................................................................................................................12
   5.2.     PROJECTED EXPENDITURES ....................................................................................................................12
   5.3.     FERRY SYSTEM CURRENT AND REPLACEMENT VALUES ........................................................................13
   5.4.     MAJOR PROJECT ANALYSIS .....................................................................................................................13
6.    PROGRAMMATIC MAINTENANCE REQUIREMENTS ................................................................ 13
   6.1.     VESSEL MAINTENANCE ............................................................................................................................13
   6.2.     TERMINAL MAINTENANCE .........................................................................................................................14
   6.3.     LUMMI ISLAND PARKING LOT ...................................................................................................................14
   6.4.     PILE, DOLPHIN & FENDER W ORK ............................................................................................................15
   6.5.     W AITING AREA/PARKING..........................................................................................................................15
   6.6.     ANNUAL OR BI-ANNUAL VESSEL DRY-DOCKING ......................................................................................15
   6.7.     ROUTINE AND/OR MINOR MAINTENANCE .................................................................................................15
TABLES................................................................................................................................................ 16
            Table 1 Revenues 2008-2021                                                                                                                               16
            Table 2 Expenditures 2008-2021 Page 1                                                                                                                    17
            Table 2 Expenditures 2008-2021 Page 2                                                                                                                    18
            Table 3 Ferry System Current and Replacement Values 2008                                                                                                 19
7.    ANNUAL REPORT 2006 .............................................................................................................. 20
   7.1.     FINANCIAL REPORTS ................................................................................................................................20
      7.1.1. Comparative Balance Sheet Year-end 2006 ..................................................................... 20
      7.1.2. Revenues & Expenditures 2006 ........................................................................................ 21
      7.1.3. Actual vs. Rental Rate Calculations .................................................................................. 22
      7.1.4. Fare Box Recovery Worksheet ......................................................................................... 23
   7.2.     OPERATING STATISTICAL INFORMATION 2006 ........................................................................................23
      7.2.1. 10-Year Trend in Passenger Car Traffic ............................................................................ 23
      7.2.2. 10-Year Trend in Total Vehicles ........................................................................................ 24
      7.2.3. 10-Year Trend in Total Non-Driver Passenger/Pedestrian Traffic ...................................... 24
   7.3.     OTHER CAPITAL EXPENDITURES IN 2006................................................................................................24
      7.3.1. County Road Project #905014 Whatcom Chief Replacement ............................................ 24
      7.3.2. County Road Project #904023 Lummi Island Ferry Parking Lot ......................................... 24
      7.3.3. Lummi Island Ferry Dock Improvements ........................................................................... 25
8.    PROJECT NARRATIVES ............................................................................................................. 26
   8.1.     VESSEL REPLACEMENT ............................................................................................................................26
   8.2.     TERMINAL UPGRADES SUMMARY ............................................................................................................27
   8.3.     GOOSEBERRY POINT RELOCATION SUMMARY ........................................................................................28

                                                                                  2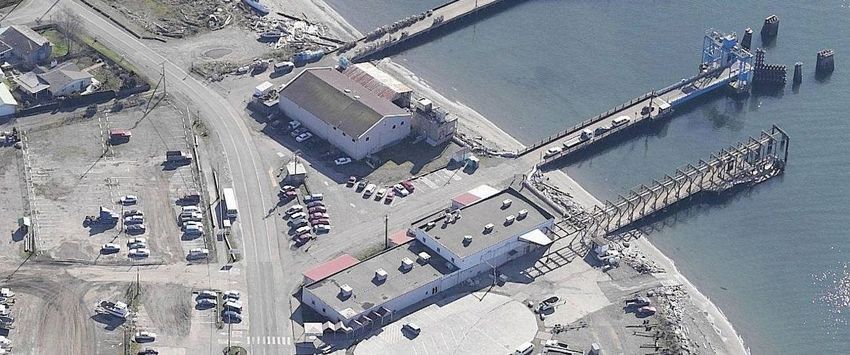
1.     Introduction
1.1.   System Description
Whatcom County Public Works Ferry Division operates the MV WHATCOM CHIEF to
provide ferry service between the Lummi Island Ferry and the Gooseberry Point Ferry
Terminal. The MV WHATCOM CHIEF is the only link for the majority of Lummi Island
residents and all vehicles to the mainland at Gooseberry Point. The trip between Lummi
Island and Gooseberry Point is 0.8 miles and takes about 5 minutes, not including
loading and unloading times.

                     Figure 1 - Lummi Island Ferry MV WHATCOM CHIEF

This ferry has been reliably transporting Lummi Island residents, visitors, and business
clients for the past thirty five years. During 2006, the ferry transported over 231,000
passengers, with vehicle or passenger car trips of 132,238 and total vehicles
transported of 136,682. Ridership shows strong seasonal variations. July and August
remain the busiest months with over 10% of all vehicle and pedestrian trips occurring in
each of these months. The permanent resident population is over nine hundred and
during the summer swells to over two thousand.
1.2.   Service Description
Hours of operation are 5:40 AM to 12:10 AM on weekdays (38 scheduled runs), 7:00
AM to 12:30 AM on Saturdays, and 7:00 AM to 12:10 AM on Sundays and five major
holidays. The ferry also offers a weekly fuel truck transport (passengers are not allowed
on this run). Currently, the approach bridge at the Gooseberry Point Terminal has a

                                           3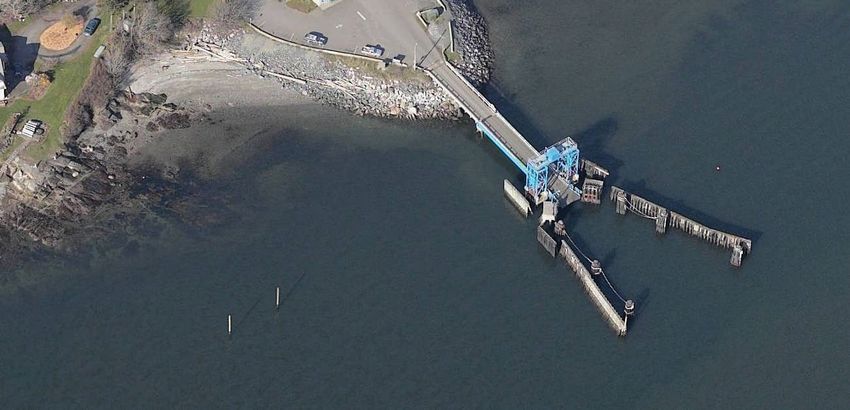
maximum allowable weight of 46,000 pounds. As a result of this restriction, the MV
WHATCOM CHIEF is limited to 20 ton vehicles with special permission from the Vessel
Master for vehicles up to 23 tons.

The ferry is available as an on-call service in the event of an emergency such as
medical evacuation from Lummi Island. The car ferry operates approximately 50 weeks
per year. A passenger vessel is leased and operates while the MV WHATCOM CHIEF
is undergoing its annual maintenance.

                             Figure 2 - Lummi Island Ferry Route

Figure 2 is taken from USGS Topographic Chart 48122F6A-024 – LUMMI ISLAND.

1.3.   Facility Overview
The Lummi Island Ferry System consists of a terminal area on the mainland at
Gooseberry Point, a terminal area on Lummi Island, and a car ferry, the MV WHATCOM
CHIEF.

A brief description of the two terminals the car ferry follows:

1.3.1. Lummi Island Terminal
The Lummi Island Terminal facilities include a terminal building, which houses the
emergency generator, two public rest rooms, an office with attached rest room, a
storeroom, and a passenger waiting area. Fresh water service is provided for vessel
use and electrical service for use on the dock. There are also two parking lots
associated with this terminal (See Figure 3).

                                              4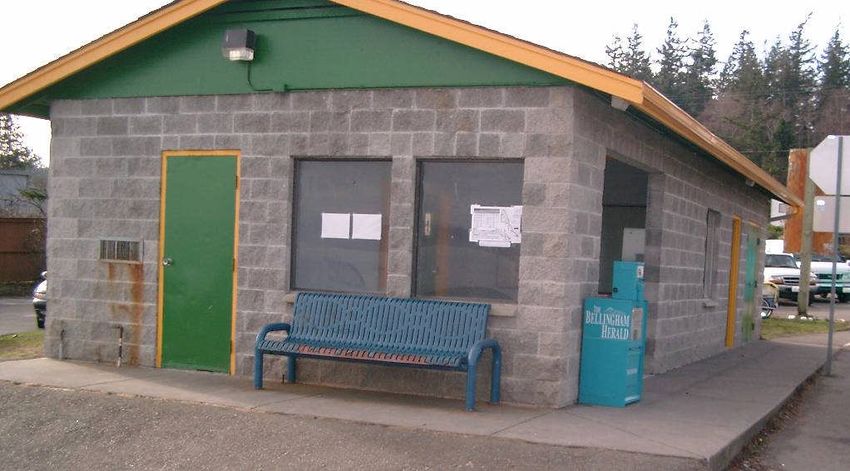
New parking is under
construction in this area

Existing Parking
                                 Terminal
                                                  Approach Span

                                                 Transfer Span

                                                 Transfer span
                                                 hoist equipment

              Septic Drain

        Figure 3 - Lummi Island Ferry Terminal

                             5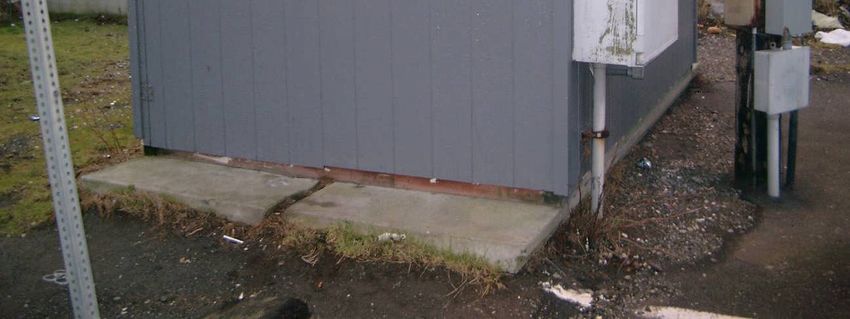
Figure 4 shows the entrance to the generator room on the left and the passenger
waiting area entrance on the right.

                              Figure 4 - Lummi Island Building

Figure 5 details components of the transfer span hoist. The picture shows the hoisting
equipment for Lummi Island. The Gooseberry Point terminal hoisting equipment is
substantially similar.

                       Figure 5 - Lummi Island Ramp Hoist Mechanism

There is a small hydraulic system, which provides power to operate two hydraulic
cylinders. The two cylinders are used to raise and lower the transfer span apron. The
apron is on the seaward end of the transfer span. It is used to adjust for the freeboard

                                             6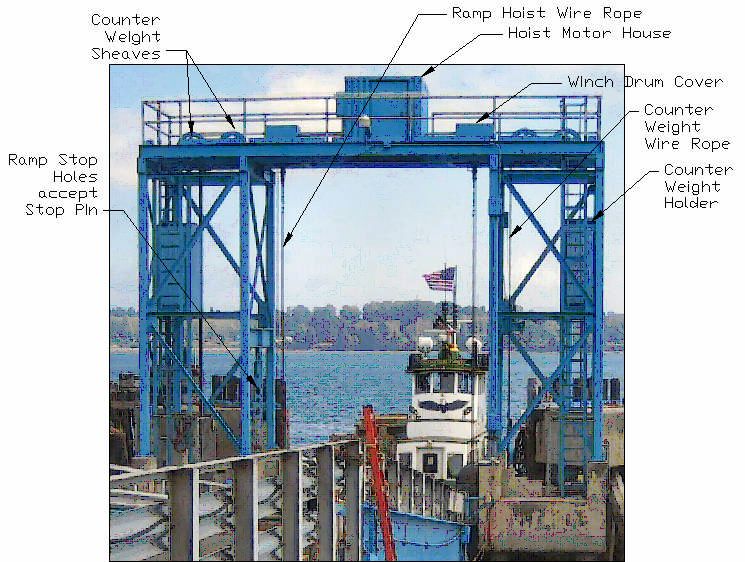
variations of MV WHATCOM CHIEF as vehicles are loaded, without normally requiring
an adjustment of the transfer span height.

There is a mechanical lever to extend and retract the ramp locking pins which support
the transfer span during loading operations. There is no remote operation of locking
pins for the Lummi Island Terminal. There are electric controls for apron raise, lower
and stop; ramp raise and lower; fog horn; traffic gate open/close; with indicator lights for
lock pin extended/retracted; lock pin bypass; and a power on/off. These controls are
housed in a box with the push buttons mounted on one rail of the transfer span. The
power on/off switch and the foghorn switch have key locks. There is an emergency
generator which will start automatically in the event of a power failure (a frequent
occurrence). An automatic bus transfer switch will sense the power available and
switch to generator power, restoring dock electric power. When normal electric power is
restored, the bus transfer switch automatically shifts back to normal power.
In the event that the emergency generator fails, there is a ¾” electric drill which can be
powered from the vessels electric system used to raise and lower the ramp. Dock lights
are switched on and off by a photoelectric cell. A manual bypass switch is mounted on
the box just below the photocell.

1.3.2. Gooseberry Point Terminal
This is a minimal terminal. It consists of an emergency generator which is housed in a
small building, two port-a-potties, a trestle, and transfer span with apron used to load
vehicles. Electrical service is provided for the dock, but there is no vessel connection.
There is a small covered passenger waiting area on the trestle. There are dolphins and
wing walls to accommodate the vessel when in dock.

                                                      Hoist Machinery
                                                   Generator

    Leased
                                                                             Transfer

                                                                          Porta-

                         Figure 6 - Gooseberry Point Ferry Terminal

The ramp hoisting system consists of an electric drive motor which drives two wire rope
drums on a common shaft. The hoist wire from each drum is run through a 4-part
sheave system and attached to the base of the tower platform with a turnbuckle. Figure
5 shows the components on the Lummi Island end, but both systems are similar. There
is a small hydraulic system that provides power to operate three hydraulic cylinders.
One of the cylinders is used to extend and retract the ramp lock pins. The other two
cylinders are used to raise and lower the ramp apron. There is a mechanical lever to
extend and retract the ramp locking pins in the event of hydraulic system failure. The
hydraulic cylinder must be disconnected from the system prior to using the mechanical

                                             7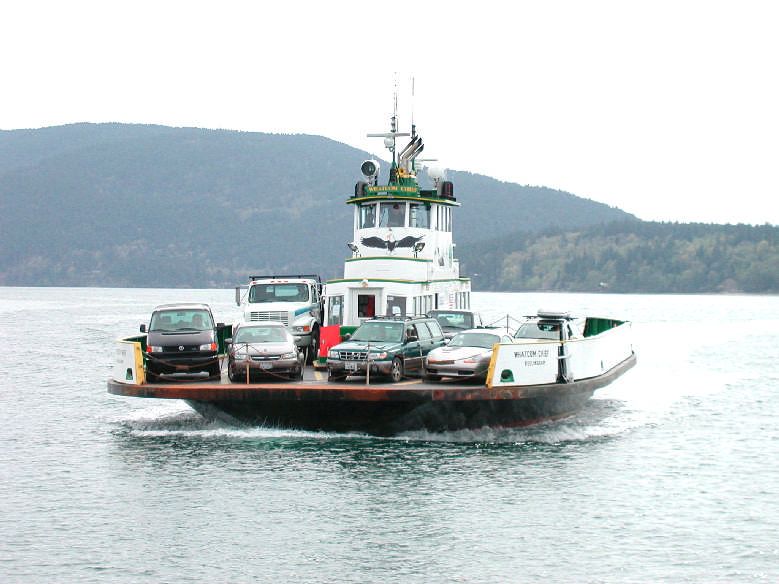
lever. On the vertical support for the hoist platform of this terminal there are two lights
activated by limit switches indicating whether the ramp locking pins are in or out.
There are electric controls for ramp locking pins in and out; apron raise, lower and stop;
ramp raise and lower; dock lights; fog horn; traffic gate open/close; and power on/off.
These controls are housed in a locked, weatherproof stainless steel box. There is also
radio remote control for this system with duplicate controls except for power on and off.
The remote control is kept on the vessel.

There is an emergency generator that will start automatically in the event of a power
failure (a frequent occurrence). An automatic bus transfer switch will sense the power
available and switch to generator power, restoring dock electric power. When normal
electric power is restored, the bus transfer switch automatically shifts back to normal
power.

                      Figure 7 – Gooseberry Point Emergency Generator

In the event that the emergency generator fails, there is a ¾” electric drill which can be
powered from the vessels electric system which can be used to raise and lower the
ramp. The electric brake must be clamped open for the drill to work.

Vehicle holding area is limited to an area one lane wide and about one city block long.
There is also leased parking for about 80 cars near the terminal for walk-on passengers.

                                             8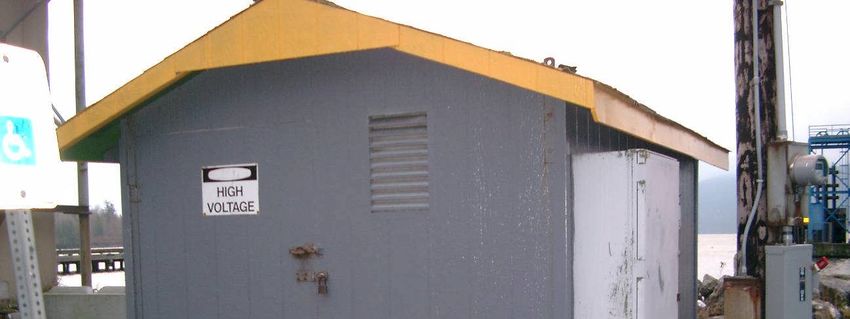
1.3.3. MV WHATCOM CHIEF Overview

                      Figure 8 - MV WHATCOM CHIEF Outboard Profile

MV WHATCOM CHIEF is a double-ended twin screw steel car and passenger ferry.
The vessel was built in 1962 by T.J. Larsen Steel Company in Bellingham Washington.
The Coast Guard Certificate of Inspection (COI) authorizes operation in lakes, bays and
sounds with 100 passengers and a crew of three. The vessel nominally carries 20
vehicles. It is also authorized to act as a freight vessel to permit the carriage of fuel
trucks. Passengers are not permitted while operating as a freight vessel.

The main propulsion machinery is two Caterpillar Model 3406 6 cylinder diesel engines
with Twin Disc MG514 reduction gears. The vessel has two Lima Ser generators (3
phase, 120/208 VAC) driven by John Deere diesel engines. The main generator is
rated at 32 KW and the auxiliary generator is rated at 35 KW.

Every three years, a condition and valuation survey is conducted on the vessel. The
latest Condition and Valuation Survey was done by Columbia-Sentinel Engineers, Inc.
dated 15 Sep 2005. This survey states the vessel is in very good condition with very
little deterioration from original scantlings. The Condition and Valuation Survey reports
the vessel has an estimated value of $860,000 and replacement cost of $2,900,000.

Vessel particulars are shown in Table 3.

2.     The Basis for the Report
2.1.   Purpose of the Report
This program as designed provides a blueprint for the effective, efficient, and continuing
operation of the Whatcom County Ferry System. The projects listed are the result of
input from County departments, governmental agencies, business organizations, citizen
groups, and individuals. Capital improvements are scheduled based on 80 years of
experience operating and maintaining the system, while complying with applicable
regulations.

Inevitably, priorities and available funds for the ferry system will change over the
fourteen years projected in this program. Therefore, the intention of the program is to be

                                            9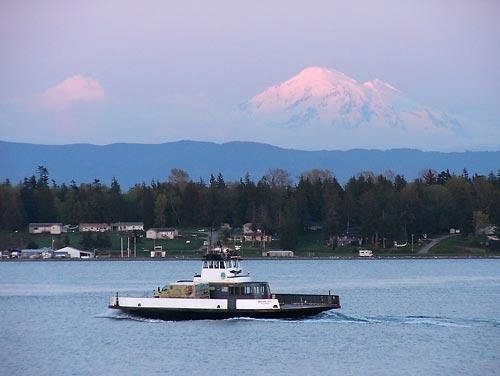
a guide indicating long-range improvements and anticipated revenues and
expenditures. Strict adherence is not required.

2.2.   Citations and Authority
Enacted in 1975, Revised Code of Washington (RCW) 36.54.015 states “The legislative
authority of every county operating ferries shall prepare, with the advice and assistance
of the county engineer, a fourteen year long range capital improvement plan embracing
all major elements of the ferry system. Such plan shall include a listing of each major
element of the system showing its estimated current value, its estimated replacement
cost, and its amortization period.” The tables shown in the 14-year capital improvement
plan fulfill these requirements.

2.3.   Organization of the Report
The program information is presented in three tables. State and Federal requirements
were established to assure counties have current plans for comprehensive
transportation improvement efforts. Statutory requirements and a brief explanation of
the tables and how they meet the requirements follow.

3.     History of the Ferry System
The ferry system is the lifeline for Lummi Island. It has seen a growth in annual total
demand of 95,000 car & driver trips in 1990 to over 132,000 in 2006 the latest year for
which statistics are available. Total annual passenger use has grown from 167,000 in
1990 to over 231,111 in 2006.

The following is a chronology of major milestones in the history of the Whatcom County
Ferry System.

YEAR/EVENT
1926 Lummi Shore Road from Bellingham was completed and a ferry, the Central,
     owned by Whatcom County and large enough to hold six small Model-T Fords
     started making scheduled runs between Lummi Island and Gooseberry Point.
1929 The slightly larger Chief Kwina replaces the Central.
1950 Gooseberry Point terminal built.
1962 The M/V Whatcom Chief begins service.
1978 Lummi Island terminal is relocated.
1982 New lift mechanism installed on transfer span at Lummi Island.
     Gooseberry Point pier refurbished
1987 Gooseberry Point Transfer span, wing walls and dolphins replaced
1997 Major refurbishment of Gooseberry point landing accomplished
2002 20-Year Plan Phase 1 Process and report completed.
2005 Major Status Report on Ferry System
2006 Lummi Island Dock preservation project (Bearing Seats Rebuild).
     Major Corrosion Repair to vessel hull.
     Completed design package for a 35-car replacement vessel.
     Completed design package for urgent electrical and structural repairs to
     terminals.
     First Rate Increase in 5 years.

                                           10
4. 2006-2007 Activities Related to the Ferry System
4.1. Overview
During 2006-2007 Whatcom County Public Works has been active in planning for the
future needs of the ferry system. Two design packages for urgent facilities upgrades
were completed and all required environmental permits documents were obtained.
Additionally, the design package to upgrade the remaining facilities to meet the
demands of the next 8 years and to accommodate the new ferry has been progressed
to the 50-60% stage. Public Works has also remained actively involved in seeking
financial assistance from a variety sources to augment County funds for the major
capital investments envisioned over the next 2-5 years.
Additionally the staff has been reviewing the revenue and expenditure issues related to
the operation of the ferry system, and has prepared the basis for the 2007 and 2008
budget, as well as the ground work for the 2008-2021 14 Year Plan. The Ferry Division
also prepared an updated Terminal Operations and Maintenance manual and program,
which will tie into our O&M budget in the 14-year plan. Other financial impacts reviewed
include the costs of a variety of services and/or service levels. The following
paragraphs discuss these major activities in more detail.
4.2. Status of the New Ferry
Elliot Bay Design Group has completed the design of a 35-car replacement vessel. We
expect to obtain the funding and bid the construction of the new ferry in early 2008.
This would lead to the expectation of having the replacement vessel operational in early
to mid 2010.
Art Anderson Associates has completed the design of the urgent facility repair packages
and is proceeding with the 50-60% design of the remaining necessary structural
improvements to the facilities to handle the increased size of a 35-car vessel. The
facilities upgrade proposals are being developed in phases to take advantage of dry-
dock periods and “fish windows” for construction prior to the delivery of a new vessel.
4.3. Schedule Issues
The Public Works Department is continuing the effort to optimize the use of the
Whatcom Chief. Proposals for a revised schedule with some seasonal flexibility are
likely in the near future.
With a larger replacement vessel there will be the requirement to modify the existing
schedule. The most probable new schedule would be 2 runs per hour during the same
hours as the ferry currently runs. Other options will be reviewed and such user groups
as the schools, and commuters will be asked for input. The impact of lines and waiting
time at peak operating times should be positive at least at first due to the increased
capacity. How long this remains the case will depend on if people shift their rider ship
habits based on when deck space is available.
Other schedule issues that may be addressed in the future include additional work on
the concept of Seasonal Scheduling, and Peak vs. Non-peak schedules.
114.4. Rate Increase
2007 brought the first increase in ferry rates in 5 years. Along with the rate changes
was a great deal of dialog that resulted in a better understanding by all parties of the
costs of running the ferry system.
The costs of operating the ferry system have been rising steadily, and the rate of
increase has been increasing over the past 3-4 years. In 2006 the total cost of the ferry
system was $1,948,202. The total user fee revenue was $663,803 equated to 34% of
the operating cost. With no changes to the system, the costs for 2007 are budgeted at
$1,886,438 and revenues are budgeted at $915,000.
5. 2008-2021 Capital Improvement Plan
RCW 36.81.121 (1) states “…the legislative authority of each county, after one or more
public hearings thereon, shall prepare and adopt a comprehensive transportation
program for the ensuing six calendar years….and for those counties operating ferries
shall also include a separate section showing proposed capital expenditures for ferries,
docks, and related facilities. Copies of the program shall be filed with the county road
administration board and the secretary of transportation not more than thirty days after
its adoption by the legislative authority…” Subsection (2) requires expanded information
on how a county will spend all its money on the various facets of the transportation
program. This RCW Section was enacted in 1961. The capital expenditure portion of
Subsection (1) is satisfied by:
5.1. Projected Revenues
Table 1: Projected Revenues defines the known and/or anticipated sources of operating
and capital project funding for the 14-Year Plan.
5.2. Projected Expenditures
Table 2: Projected Expenditures includes all other expenditures on the system that meet
Subsection (2) requirements. Operational expenditures are delineated between vessel
and non-vessel costs. U.S. Coast Guard regulations currently require the ferries to be
dry-docked every two years, however to extend the life, improve reliability and protect
our capital investment Whatcom County schedules dry-docking every year for its
vessels. When the M/V Whatcom Chief goes into standby, this periodicity will be
extended to once every two years. This is reflected in the table. The landings are
inspected regularly as required by the National Bridge Inspection Standards
administered through the Washington State Department of Transportation. The
inspection report helps identify and schedule major maintenance and replacement of
these facilities. The last section of the table lists loan payments.
This RCW section also provides the reporting requirement and timing of program
submission, as well as establishing the annual update requirement.
Additionally, the Federal Highway Administration requires all agencies within a
Metropolitan Planning Organization to develop and annually update the long range
Transportation Improvement Plans and their Biennial Element. Whatcom County
12updates this 14-Year plan each year and incorporates the results into the Six-Year
Transportation Improvement Program.
5.3. Ferry System Current and Replacement Values
Table 3: Ferry System Current and Replacement Values – 2008 meets applicable
requirements, showing the current value, replacement cost, and amortization periods for
the vessels and facilities. The current value of the M/V Whatcom Chief is the book
value, calculated from the depreciated original construction cost and any depreciated
improvements/major repairs. The facilities’ current value is book value; original cost less
depreciation plus depreciated improvements.
5.4. Major Project Analysis
The major capital improvement project listed in this program is the construction of a 35-
vehicle replacement ferry. The vessel will replace the 1962 vintage, 20-vehicle ferry M/V
Whatcom Chief. The design was initiated in 2005 and construction completion is
anticipated to be in 2010. The replacement ferry will provide a 40% greater system
capacity and improved safety. It is assumed that the M/V Whatcom Chief will be
retained as a back-up boat for dry-docking periods and unexpected maintenance/repair
periods. Strategies for sharing the M/V Whatcom Chief with another county (e.g. Skagit
or Pierce) are actively being explored. The significant increase in overall system
capacity is planned to serve the transportation needs of the Lummi Island for many
years.
At the present time the County is pursuing the option of County Ferry Capital
Improvement financing thru the CRAB. Assistance is being requested for the
repayment of the principle on a loan for this project.
The other major capital improvements required for this project are the construction of
new wing walls at both the Gooseberry Point and Lummi Island landings to
accommodate the much larger berthing energies (four times that of the M/V Whatcom
Chief). A floating breakwater to replace the southern fixed breakwater at Lummi Island
(175 ft) and replacement of all the dolphins at both the Lummi Island and Gooseberry
Point landings to handle the new longer, heavier and slightly wider 35-vehicle ferry.
Two design packages are scheduled for completion in 2007 and 2008 with construction
in 2008 and 2009.
6. Programmatic Maintenance Requirements
6.1. Vessel Maintenance
US Coast Guard regulations require periodic inspections of all ferry vessels. In addition
to quarterly inspections and yearly certifications, each vessel is required to be dry
docked every two years, with an underwater hull survey required as part of the annual
certification between dry dockings.
Since M/V Whatcom Chief operates about 19 hours every day when not off-line for
shipyard maintenance, Whatcom County schedules dry-docking every year. The
engine overhaul, vessel painting, hull repairs, and other major and minor repairs occur
during the dry-docking. Propulsion engine overhauls occur every third year. Generator
13engines are overhauled on a six year cycle. Engines are replaced vice overhauled
every seventh overhaul. Every third year, a vessel survey is conducted to asses the
vessel’s overall condition, establish the fair market value, estimate replacement cost,
and provide a detailed hull strength assessment. This survey is used in part to
determine the requirements for hull plating and framing replacement.
The dry-docking periods for the replacement vessel and for the M/V Whatcom Chief will
scheduled to minimize the impacts/costs on the ferry system. The M/V Whatcom Chief
will be used when the 35-vehicle replacement ferry is dry-docked, and will be dry
docked every second year when it switches to the backup vessel. We are working with
other small ferry systems to share the services and costs of a backup car ferry. This
could potentially cut the cost of the M/V Whatcom Chief maintenance by 50% or more
when it becomes a backup vessel.
The shipyard maintenance period costs for the last six years have averaged $124,000.
During this same periods, about 300 man-hours of labor have been expended by the
crew and public works employees.
Routine maintenance outside of the shipyard period for the vessel’s vital systems is
limited to periods when the vessel is not in service, about 3 hours per day. Both main
engines and one electrical generator engine have an oil change on a three week cycle.
Other equipment is lubricated and adjusted as required. About 16 man-hours per week
are used for routine vessel maintenance.
6.2. Terminal Maintenance
Terminal maintenance is a significant challenge for the ferry system. The salt water
environment creates a challenge for preservation, and the operating schedule adds to
the challenge. Since the transfer spans are in operation on a 20 minute cycle for about
21 hours per day, and the dedicated maintenance period which M/V Whatcom Chief
enjoys is not duplicated for the transfer spans at the terminals.
The transfer spans are bridge equipment and thus require annual inspection. Because
the transfer spans are weight handling equipment there are daily, monthly and annual
requirements for inspection and maintenance of the transfer span equipment. The wire
rope used for the transfer span hoists and counterweights requires replacement on a
three year cycle. Hinges, bearings and wire rope require lubrication, inspection and/or
cleaning on a monthly basis.
Although the emergency generators at each terminal have low hour usage in a year,
they are critical to routine operation during outages of normal electric service to the
terminals. Routine oil changes (about twice per year depending on duration and
frequency of power outages), inspection, adjustment and testing are required.
About 24 man-hours per week are used for routine terminal maintenance.
6.3. Lummi Island Parking Lot
This new lot is a major investment that requires routine repair and maintenance on a
monthly and annual basis as shown in Table 2.
146.4. Pile, Dolphin & Fender Work
Major pile dolphin and fender work replacement is scheduled at regular intervals, as
shown in Table 2.
6.5. Waiting Area/Parking
Improvements to passenger waiting areas and parking facilities on Lummi Island are
also scheduled as shown in Table 2. These improvements are intended to encourage
the use of mass transit to help reduce the peak vehicle demand on the system.
6.6. Annual or Bi-annual Vessel Dry-Docking
US Coast Guard regulations require periodic inspections of all ferry vessels. In addition
to yearly certifications, each vessel is required to be dry docked every two years.
However, to protect our investments, Whatcom County schedules dry-docking every
year. The Dry-docking periodicity for the M/V Whatcom Chief as back-up vessel will be
extended to once every two years. The Engine overhaul, vessel painting, hull repairs,
and other major and minor repairs occur during the dry-docking. The dry-docking
periods for the replacement vessel and for the M/V Whatcom Chief will be scheduled to
minimize the impacts/costs on the ferry system. The M/V Whatcom Chief will be used
when the 35-vehicle replacement ferry is dry-docked
6.7. Routine and/or Minor Maintenance
General minor maintenance is continual on the ferries, landings, aprons, and waiting
facilities. The costs and extent of the work is unpredictable and frequently, problems
must be repaired immediately upon detection. Routine maintenance such as building
painting and roof cleaning is more predictable and scheduled in advance.
15Whatcom County Public Works 14-Year Ferry Capital Program
All $ in 000's Table 1 Revenues 2008-2021
CATEGORY 2008 2009 2010 2011 2012 2013 2014
Punch Card Fares (1) $ 870 $ 902 $ 1,143 $ 1,175 $ 1,207 $ 1,241 $ 1,275
Cash Fares
(1) $ 96 $ 100 $ 127 $ 131 $ 134 $ 138 $ 142
(Memo 55% of Operating Cost) $ 966 $ 1,003 $ 1,270 $ 1,305 $ 1,341 $ 1,378 $ 1,417
MVFT Deficit Subsidy $ 160 $ 160 $ 160 $ 160 $ 160 $ 160 $ 160
County Road Fund Subsidy (2) $ 630 $ 660 $ 879 $ 908 $ 937 $ 968 $ 999
Ferry Bond Proceeds $ 14,000
Loan Repayment Assistance CRAB $ 407 $ 407 $ 407 $ 407 $ 407 $ 407
Total Revenues $ 1,756 $ 16,230 $ 2,716 $ 2,780 $ 2,845 $ 2,913 $ 2,983
Total Expenditures $ 3,950 $ 16,497 $ 4,046 $ 4,109 $ 4,175 $ 4,692 $ 4,564
Net Unfunded $ 2,194 $ 267 $ 1,329 $ 1,329 $ 1,329 $ 1,779 $ 1,581
CATEGORY 2015 2016 2017 2018 2019 2020 2021
Punch Card Fares (1) $ 1,310 $ 1,347 $ 1,385 $ 1,423 $ 1,463 $ 1,504 $ 1,547
Cash Fares
(1) $ 146 $ 150 $ 154 $ 158 $ 163 $ 167 $ 172
(Memo 55% of Operating Cost) $ 1,456 $ 1,497 $ 1,538 $ 1,581 $ 1,626 $ 1,672 $ 1,719
MVFT Deficit Subsidy $ 160 $ 160 $ 160 $ 160 $ 160 $ 160 $ 160
County Road Fund Subsidy (2) $ 1,031 $ 1,064 $ 1,099 $ 1,134 $ 1,170 $ 1,208 $ 1,246
Ferry Bond Proceeds
Loan Repayment Assistance CRAB $ 407 $ 407 $ 407 $ 407 $ 407 $ 407 $ 407
Total Revenues $ 3,054 $ 3,128 $ 3,204 $ 3,282 $ 3,363 $ 3,447 $ 3,532
Total Expenditures $ 4,582 $ 4,507 $ 4,583 $ 4,659 $ 4,742 $ 4,824 $ 4,913
Net Unfunded $ 1,528 $ 1,379 $ 1,379 $ 1,377 $ 1,379 $ 1,378 $ 1,381
NOTES:
(1) Sum is Projected as 55% of
Operating Cost
(2) Based on 45% of Operating Cost less MVFT
Subsidy
16Whatcom County Public Works 14-Year Ferry Capital Program
All $ in 000's Table 2 Expenditures 2008-2021 Page 1.
2008 2009 2010 2011 2012 2013 2014
Operations Expenses:
Vessel Operations
Whatcom Chief
Personnel $ 830 $ 850 $ 110 $ 112 $ 114 $ 117 $ 119
Fuel & Operating Supplies $ 250 $ 280 $ 61 $ 63 $ 66 $ 69 $ 71
Insurance $ 43 $ 43 $ 41 $ 42 $ 43 $ 45 $ 46
Other Operating Expenses $ 345 $ 355 $ 58 $ 60 $ 62 $ 63 $ 65
New 35-Car Vessel
Personnel $ 902 $ 920 $ 938 $ 957 $ 976
Fuel & Operating Supplies $ 562 $ 584 $ 608 $ 632 $ 657
Insurance $ 55 $ 57 $ 58 $ 60 $ 62
Other Operating Expenses $ 219 $ 226 $ 232 $ 239 $ 246
Total Vessel Operations $ 1,468 $ 1,528 $ 2,008 $ 2,064 $ 2,122 $ 2,182 $ 2,244
Other Operations
Administration $ 180 $ 184 $ 187 $ 191 $ 195 $ 199 $ 203
Parking Lots
Lummi Island $ 11 $ 11 $ 12 $ 12 $ 12 $ 13 $ 13
Gooseberry Point $ 21 $ 22 $ 22 $ 23 $ 24 $ 24 $ 25
Staging Areas
Lummi Island $ 12 $ 12 $ 13 $ 13 $ 14 $ 14 $ 14
Gooseberry Point $ 12 $ 12 $ 13 $ 13 $ 14 $ 14 $ 14
Docks
Lummi Island $ 26 $ 27 $ 28 $ 28 $ 29 $ 30 $ 31
Gooseberry Point $ 26 $ 27 $ 28 $ 28 $ 29 $ 30 $ 31
Total Operations Expense $ 1,756 $ 1,823 $ 2,310 $ 2,373 $ 2,439 $ 2,506 $ 2,576
Other Expenditures
Vessel Depreciation $ 170 $ 400 $ 400 $ 400 $ 400 $ 400 $ 400
Facilities Depreciation $ 211 $ 240 $ 240 $ 240 $ 240 $ 240 $ 240
Financing Expense
Loan Principle $ 475 $ 495 $ 515 $ 535 $ 555 $ 580
Loan Interest $ 621 $ 601 $ 581 $ 561 $ 541 $ 518
Capital Expenditures
Vessel Replacement $ 150 $ 8,000
Vessel Major Overhaul
Gooseberry
Parking Lot
Staging Area
Dock
Dolphins $ 885
Wingwalls $ 860
Apron/Ramp $ 200
Electrical $ 144
Trestle $ 250
Lummi Island
Parking Lot
Access/Staging Area $ 1,025
Dock
Dolphins $ 259 $ 154
Mooring/Breakwater $ 200 $ 1,770 $ 250
Wingwalls $ 100 $ 1,104
Electrical $ 100
Apron/Ramp
Total Expenditures $ 3,950 $16,497 $ 4,046 $ 4,109 $ 4,175 $ 4,692 $ 4,564
User Fee @ 55% of Operations $ 966 $ 1,003 $ 1,270 $ 1,305 $ 1,341 $ 1,378 $ 1,417
17Whatcom County Public Works 14-Year Ferry Capital Program
All $ in 000's Table 2 Expenditures 2008-2021 Page 2.
2015 2016 2017 2018 2019 2020 2021
Operations Expenses:
Vessel Operations
Whatcom Chief
Personnel $ 121 $ 124 $ 126 $ 129 $ 131 $ 134 $ 137
Fuel & Operating Supplies $ 74 $ 77 $ 80 $ 83 $ 87 $ 90 $ 94
Insurance $ 48 $ 49 $ 50 $ 52 $ 53 $ 55 $ 57
Other Operating Expenses $ 67 $ 69 $ 71 $ 73 $ 76 $ 78 $ 80
New 35-Car Vessel
Personnel $ 996 $ 1,016 $ 1,036 $ 1,057 $ 1,078 $ 1,100 $ 1,122
Fuel & Operating Supplies $ 684 $ 711 $ 740 $ 769 $ 800 $ 832 $ 865
Insurance $ 64 $ 66 $ 68 $ 70 $ 72 $ 74 $ 76
Other Operating Expenses $ 254 $ 261 $ 269 $ 277 $ 286 $ 294 $ 303
Total Vessel Operations $ 2,308 $ 2,373 $ 2,441 $ 2,511 $ 2,583 $ 2,657 $ 2,734
Other Operations
Administration $ 207 $ 211 $ 215 $ 219 $ 224 $ 228 $ 233
Parking Lots
Lummi Island $ 14 $ 14 $ 14 $ 15 $ 15 $ 16 $ 16
Gooseberry Point $ 26 $ 27 $ 27 $ 28 $ 29 $ 30 $ 31
Staging Areas
Lummi Island $ 15 $ 15 $ 16 $ 16 $ 17 $ 17 $ 18
Gooseberry Point $ 15 $ 15 $ 16 $ 16 $ 17 $ 17 $ 18
Docks
Lummi Island $ 32 $ 33 $ 34 $ 35 $ 36 $ 37 $ 38
Gooseberry Point $ 32 $ 33 $ 34 $ 35 $ 36 $ 37 $ 38
Total Operations Expense $ 2,647 $ 2,721 $ 2,797 $ 2,875 $ 2,956 $ 3,039 $ 3,125
Other Expenditures
Vessel Depreciation $ 400 $ 400 $ 400 $ 400 $ 400 $ 400 $ 400
Facilities Depreciation $ 240 $ 240 $ 240 $ 240 $ 240 $ 240 $ 240
Financing Expense
Loan Principle $ 600 $ 625 $ 650 $ 675 $ 705 $ 735 $ 770
Loan Interest $ 495 $ 471 $ 446 $ 419 $ 391 $ 360 $ 328
Capital Expenditures
Vessel Replacement
Vessel Major Overhaul
Gooseberry
Parking Lot
Staging Area $ 50 $ 50 $ 50
Dock
Dolphins
Wingwalls
Apron/Ramp
Electrical
Bridge
Lummi Island
Parking Lot
Access/Staging Area $ 50 $ 50 $ 50 $ 50
Dock
Dolphins
Mooring/Breakwater
Wingwalls $ 150 $ -
Electrical
Apron/Ramp
Total Expenditures $ 4,582 $ 4,507 $ 4,583 $ 4,659 $ 4,742 $ 4,824 $ 4,913
User Fee @55% of Operations $ 1,456 $ 1,497 $ 1,538 $ 1,581 $ 1,626 $ 1,672 $ 1,719
18TABLE 3: FERRY SYSTEM CURRENT AND REPLACEMENT VALUES - 2008
VESSELS
M/V Whatcom
Current Statistics Chief
Length Overall 99’-10”
Length at Design Load Waterline, Salt Water 88’-0”
Breadth Over Guards 44’-1½”
Depth Molded, Main Deck at Side 10’-8”
Draft at Design Load Waterline, Salt Water 6’-0”
Full Load Displacement, Long Tons (2,240 pounds) 192
Gross Tonnage 78
CAPACITY -- Passengers 100
CAPACITY -- Cars 20
Year Built 1962
(1)
CURRENT INSURED VALUE - 2008 $860,000
TOTAL CURRENT VALUE - 2008 $860,000
Replacement Statistics
YEAR 2010
CAPACITY -- Passengers 100
CAPACITY -- Cars 20
REPLACEMENT VALUE - 2008(2) $2,900,000
TOTAL - REPLACEMENT VALUE - 2008 $2,900,000
FACILITIES
CURRENT REPLACEMEN
REPLACEMEN BOOK T VALUE -
LOCATION YEAR BUILT T YEAR VALUE(4) 2008(5)
Lummi Island Landing
Transfer Span 1982 2022 $195,000 $1,990,000
Dock 1978 2018 $23,000 $360,000
(3)
Dolphins/Wingwall 1978 2018 $485,000 $1,750,000
Parking Lots 2005 2045 $50,000 $85,000
Passenger Waiting/Office 1978 2018 $10,000 $25,000
Subtotal - Lummi Island Landing $763,000 $4,210,000
Gooseberry Point Landing
Transfer Span 1987 2027 $445,000 $2,200,000
Dock 1997 2037 $87,000 $590,000
Dolphins/Wingwall(3) 1997 2037 $640,000 $1,750,000
Subtotal - Gooseberry Point Landing $1,172,000 $4,540,000
TOTAL FACILITIES VALUE $1,935,000 $8,750,000
TOTAL VESSEL & FACILITIES VALUE $2,795,000 $11,650,000
NOTES:
(1)
Depreciated Columbia Sentinel Engineers (2005) Value plus Depreciated Improvements
(2)
Appreciated Columbia Sentinel Engineers (2005) Replacement Value
(3)
Replace with Steel Pilings
(4)
Estimated using a 40-year life and straightline depreciation (including depreciated improvements)
(5)
Replacement value based on cost estimates by Art Anderson Associates (2007)
197. Annual Report 2006
(The latest financial information)
7.1. Financial Reports
The following worksheets present the year-end financial information for the Lummi
Island Ferry System for the 2006 financial period.
7.1.1. Comparative Balance Sheet Year-end 2006
Comparative Balance Sheet
For the Year Ended December 31st, 2006
Ferry System Fund Current Prior Year End Net Change
Assets
Current Assets
Cash 1,525,973 0 1,525,973
Petty Cash/Revolvg Funds 1,000 0 1,000
Receivables (Net) 12,634 0 12,634
Prepaid Expenses 5 0 5
Total Current Assets 1,539,612 0 1,539,612
Fixed Assets
Total Fixed Assets 0 0 0
Other Assets 0 0 0
Deferred Charges 0 0 0
Total Assets 1,539,612 0 1,539,612
Liabilities and Fund Equity
Current Liabilities
Accounts Payable 19,670 0 19,670
Due to Other Funds 203,650 0 203,650
Accrued Payroll Liabilities 32,448 0 32,448
Total Current Liabilities 255,768 0 255,768
Long-Term Liabilities 90,613 0 90,613
Fund Equity
Contributed Capital 1,587,137 0 1,587,137
Reserved Fund Equity 1,000 0 1,000
Unreserved Retained Earnings (1,588,137) 0 (1,588,137)
Total Fund Equity 0 0 0
Operating Income(Loss) 1,193,231 0 1,193,231
Net Fund Equity 1,193,231 0 1,193,231
Total Liabilities and Fund Equity 1,539,612 0 1,193,231
Note: the ferry fund was established at the beginning of 2006, therefore there were no
balances at year-end 2005.
207.1.2. Revenues & Expenditures 2006
Revenues & Expenses Total Ferry System 2006
Revenues & Expenses
Total Ferry System 2006
Ending
December 31,
2006
State Grants Revenues & Entitlements Year to Date Budget Remaining % Used
Transportation 159,143 160,000 857 99.46%
Interest Earnings 663,803 771,744 107,941 86.01%
Other Misc. Revenue 68,747 0 (68,747) 0.00%
Transfers In 44 0 (44) 0.00%
Residual Equity Transfer In 566,435 767,137 200,702 73.84%
Net Revenue 1,587,137 1,587,137 0 100.00%
3,045,309 3,286,018 240,709 92.67%
Salaries & Wages 0 0 0 0.00%
Benefits 628,235 609,728 (18,507) 103.04%
Total Salaries & Benefits 277,051 341,833 64,782 81.05%
Office & Operating Supplies 972,492 1,053,307 80,816 92.33%
Printing-Interfund 6,294 2,500 (3,794) 251.74%
Books/Publications/Subscrip. 5,116 3,000 (2,116) 170.53%
Tools & Equipment 159 0 (159) 0.00%
Software 4,927 1,000 (3,927) 492.71%
Building Maintenance 635 0 (635) 0.00%
Office Equipment Maintenance 0 3,950 3,950 0.00%
Postage-Interfund 92 0 (92) 0.00%
Telephone 614 0 (614) 0.00%
Travel-Other 2,346 3,000 654 78.19%
Equipment Rental-Interfund 8,399 10,000 1,601 83.99%
Space Rental 300,028 252,000 (48,028) 119.06%
Repairs & Maintenance-Interfund 11,648 7,000 (4,648) 166.39%
Administrative Cost Allocation 157,430 92,000 (65,430) 171.12%
Other Miscellaneous 126,509 120,916 (5,593) 104.63%
Computer-Capital Outlays 2,123 13,500 11,377 15.73%
Total Non-Salary Expenditures 0 2,500 2,500 0.00%
Total Expenditures 879,586 750,566 (129,020) 117.19%
Net Income/(Loss) 1,852,078 1,803,873 (48,205) 102.67%
1,193,231 1,482,145 288,914 -
Note: revenues and expenses are shown as reported financially. Further adjustment to
reflect actual compare to “rental rate” for vessel operating costs are explained in the
section that follows
217.1.3. Actual vs. Rental Rate Calculations
Work Sheet to Determine Adjustment For Actual vs Rental Rate
Annual Report Lummi Island Ferry 2006
Whatcom County Public Works Equipment Costs - 2006
489 John 497 John
498 Deere Deere 499 CAT 3035 - 500
Whatcom 4045TFM JMT4045T 340C Ferry Gal Fuel
Chief Ferry 493 Radars Generator Generator Engines Tank - Diesel Total
Acct Account Description Year to Date Year to Date Year to Date Year to Date Year to Date Year to Date Year to Date
Rental Charged By ER&R to Ferry $ 298,000 $ 156 $ 720 $ 298,876
6105 Intrafund Labor $ 11,525 $ 630 $ 660 $ 1,924 $ 14,739
6320 Office & Op Supplies $ 25 $ 26 $ 77 $ 129
6320 Operating Supplies $ 461 $ 174 $ 143 $ 1,588 $ 2,365
6320 Intrafund Auto Parts $ 35,125 $ 2,725 $ 37,851
6320 Intrafund Oil/Grease $ 1,493 $ 1,493
6410 Fuel $ -
6410 Fuel - Ferry Diesel $ -
6410 Diesel-Ferry $ 126,361 $ 126,361
6410 Diesel-Ferry $ -
6630 Professional Services $ -
7060 Repairs & Maintenance $ 205,182 $ 4,747 $ 209,929
7060 Repairs & Maintenance $ 1,857 $ 1,857
7060 Repairs & Maint. - Wind $ 277 $ 277
7060 Repairs & Maint. - Radi $ -
7069 Repairs & Maint-Interfu $ -
Total Operating Costs In ER&R $ 380,424 $ - $ 829 $ 829 $ 12,919 $ - $ 395,000
Under/(Over) Recovery $ 82,424 $ (156) $ 829 $ 829 $ 12,919 $ (720) $ 96,124
Note: this calculation results in adding $96,124 to the reported cost of operations to
determine the “actual cost” to be used in the fare box recovery calculation shown below.
227.1.4. Fare Box Recovery Worksheet
Worksheet for Fare Box Recovery %
Lummi Island Ferry System 2006
Operating Costs $1,852,078
Adjustment to Actual From Rental Rate $96,124
Actual Operating Costs $1,948,202
55% of Operating Costs $1,071,511
Fare Box Revenues $663,803
Fare Box Deficit for CY2006 $407,708
Actual Recovery % 34.07%
Note: this table reflects the fact that the user fees only covered 34.07% of the actual
operating costs of the system in 2006. Under current County Code, the deficit of
$407,708 will need to be made up from future user fees, and may apply pressure to
increase rates if the under recovery continues into future periods.
7.2. Operating Statistical Information 2006
The graphs shown below represent long-term trends in utilization of the ferry system.
7.2.1. 10-Year Trend in Passenger Car Traffic
Total Cars 1997-2006
145000
140000
135000
130000
125000
120000
115000
1997 1998 1999 2000 2001 2002 2003 2004 2005 2006
237.2.2. 10-Year Trend in Total Vehicles
Total Vehicles
150000
145000
140000
135000
130000
125000
120000
1997 1998 1999 2000 2001 2002 2003 2004 2005 2006
7.2.3. 10-Year Trend in Total Non-Driver Passenger/Pedestrian Traffic
Total Non-Driver Passengers
235000
230000
225000
220000
215000
210000
1997 1998 1999 2000 2001 2002 2003 2004 2005 2006
7.3. Other Capital Expenditures in 2006
7.3.1. County Road Project #905014 Whatcom Chief Replacement
Total expenditures on this project in 2006 were $521,616. This brings the total project
cost to date to $1,051,011 at the end of 2006. Costs incurred during the year included
about $290,000 to Elliot Bay Design Group for the completion of the design of a 35-car
replacement vessel. The remaining costs in 2006 on this project were to Art Anderson
& Associates to continue the design for improvements to and preservation of the
terminal facilities.
7.3.2. County Road Project #904023 Lummi Island Ferry Parking Lot
During 2006 a total of $171,672 was expended on this project. The total spent on the
parking lot by the end of the year was $818,072. This project is scheduled to be
completed in 2007, and the projected total cost is nearly $1,400,000.
247.3.3. Lummi Island Ferry Dock Improvements
In 2006 $181,465 was spent during dry dock to improve the safety and extend the life of
the transfer span bearing seats at the Lummi Island Terminal
25Whatcom County Public Works Appendix A
2008- 2009 Construction Program
Project Narrative
8. Project Narratives
8.1. Vessel Replacement
26Whatcom County Public Works Appendix A
2008- 2009 Construction Program
Project Narrative
8.2. Terminal Upgrades Summary
27Whatcom County Public Works Appendix A
2008- 2009 Construction Program
Project Narrative
8.3. Gooseberry Point Relocation Summary
28You can also read