Trinity Christian Academy
←
→
Page content transcription
If your browser does not render page correctly, please read the page content below
Trinity Christian Academy
School: 1433 Trinity Christian Academy

 Combined 3-Year Education Plan and Annual Education
  Results Report (AERR) for Trinity Christian Academy
                    November 2017

Message from the Associate Principal

Trinity Christian Academy is dedicated to creating a positive learning culture for its students,
staff, parents and the greater community we serve. It is our mission to make TCA a better place
for students to learn and grow. Our planning reflects this focus.

The Annual Education Results Report for November 2017 describes and evaluates the
2016/2017 school year. This report includes both achievements to be celebrated and identifies
challenges to be addressed. We report on the multiple successes and the immediate issues we
face as a school.

We hope that by reviewing our past, we can ultimately improve our future through adequate,
thoughtful planning and community involved discussion. This document will serve as our three
year education plan for the 2017/2018, 2018/2019 and 2019/2020 school years.

Kristen M. Odegard
Associate Principal
Trinity Christian Academy

                   Honor Roll                               Honors With Distinction

                                                                                             Page 2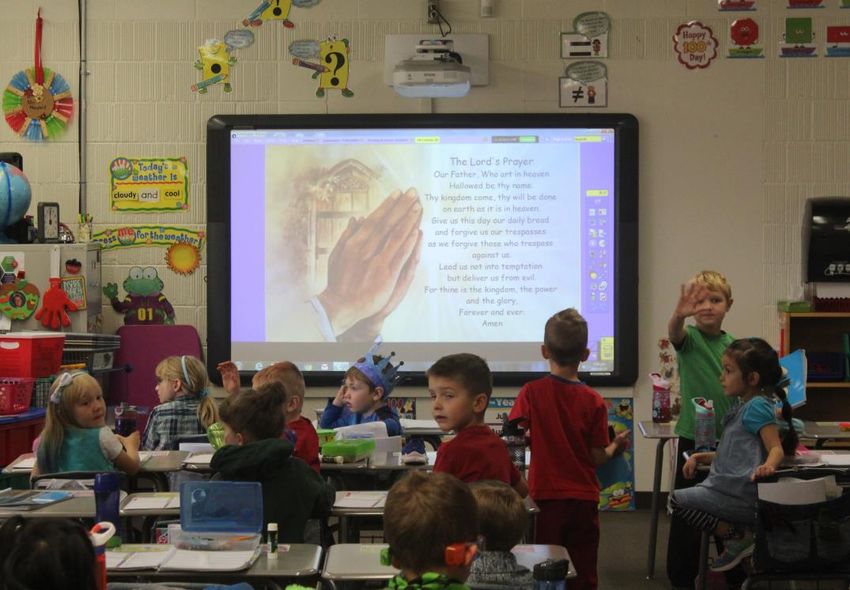
School: 1433 Trinity Christian Academy

Accountability Statement
The Annual Education Report for Trinity Christian Academy for the 2016/2017 school year was
prepared in accordance with the requirements of Alberta Education and Golden Hills School
Division. The school is committed to using the results in this report to improve outcomes for
students. We use the results to develop sound strategies for our Three Year Education Plan to
ensure all our students can acquire the knowledge, skills and attitudes they need to be
self-reliant, responsible, caring and contributing members of society.

School Profile
Trinity Christian Academy is an alternative faith-based program that encompasses Pre-
Kindergarten to Grade 9 programming. Our currently funded population is 181 students with the
majority of students living in Strathmore. Our programs include one class for each grade from
Kindergarten to Grade 7. The Grade 8/9 class is our only combined class. We have two Pre-
Kindergarten programs. Each class has sixteen students that attend two mornings per week.
When including the Pre-Kindergarten students, there are 213 students that attend and
contribute to the overall culture of Trinity Christian Academy. In addition, all students participate
in weekly Christian Education classes.

                     Chapel – The Jr. Highs are teaching the actions to a song
                                         during Chapel.

                                                                                                Page 3
School: 1433 Trinity Christian Academy

 Highlights of 2016/2017

 Mission and Vision
 Over the course of the 2016/2017 school year, the staff collaborated and collectively wrote
 Trinity Christian Academy’s new mission, vision statements and five values.

 Mission:
 Christ-centered education shaped by powerful learning and meaningful relationships.

 Vision:
 At Trinity Christian Academy, we are committed to ensuring an engaging spiritual community
 where all learners discover their God-given potential.

 Values:
 Respect, Responsibility, Empathy, Self-Awareness and Perseverance

The values have become the theme for the chapel sessions this year. Every second month, various
  classes make presentations on the different values that shape our Chapel and Christian Studies
                                             program.

                                                                                               Page 4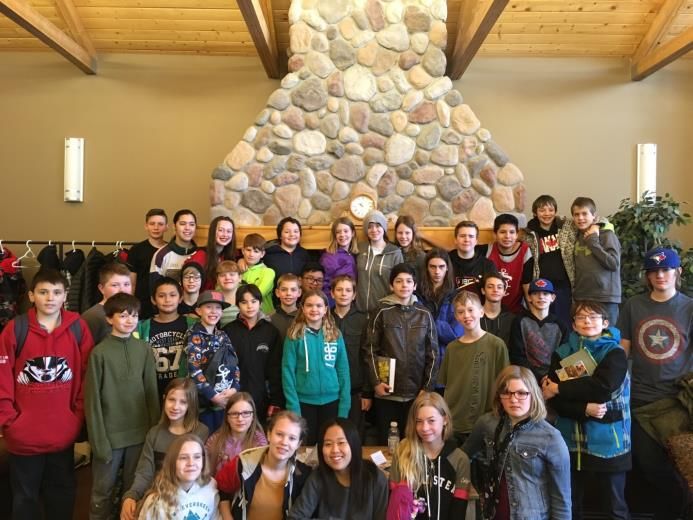
School: 1433 Trinity Christian Academy

   Christian Education Programming
   The staff uses the Christian Studies resource, “The Bible” by Purposeful Design. This resource
   influences our day to day Christian Studies and allows for deeper Christian conversations and
   understanding. The TCA Society oversees the spiritual aspects of our school. For the past
   three years we have employed a half-time chapel coordinator. This person is responsible for
   organizing weekly chapel services, using the school’s mission and vision as a guide for the
   chapel theme, as well as organizing various spiritual activities (Prayer at the Pole, Annual
   Christmas Concert). We will continue to use this valuable resource.

Jr. High Youth Retreat at Southern Alberta Bible Camp                  2016 Christmas Play & Concert

   Student Leadership
   The Leadership Club includes Grade 7- 9 students who are interested in planning various
   events, fundraisers and activities in the school. The Leadership Club runs the weekly canteen
   and provides relief in the office during the lunch hour. This year, they have also become peer
   supervisors on the playground during lunch recess times in hopes of building relationships with
   the younger students and acting as positive leaders within the school. In their fundraising
   efforts, the students are learning about various ways to serve and positively affect change at the
   local, national and international level. One of the goals of student leadership is to earn their way
   to attend “WE Day”. The students have “earned” this day for the past four years.

                                                                                                  Page 5
School: 1433 Trinity Christian Academy

Athletics
Trinity Christian Academy’s athletics program has significantly improved over the past two
years. This is an area that has helped us to improve our upper elementary and junior high
programs. TCA now has one Mixed Volleyball team, two Boys Basketball teams, one Girls
Basketball team and one Mixed Swim team. There are also TCA students who compete in both
Badminton and Track and Field every spring. We believe that with continued growth at the
junior high level, this will continue to be an area of growth for TCA.

Trends and Issues
                                                                          Swim Team

Student Enrollment
Trinity Christian Academy continues to recruit students to insure the financial viability of the
school. At the beginning of the 2017/2018 school year, we were eighteen students below the
March 2017 projection. In the past, we have seen consistent growth in student enrollment and
hope that, in the future, this trend will continue. We can celebrate the overall growth of TCA.
Our enrollment has grown from 75 students in June of 2012 to 181 funded students at our
September 30, 2017 funding cut-off date. Golden Hills School Division (GHSD), TCA staff,
School Council and the TCA Society are all dedicated to the growth and sustainability of the
school and will continue to plan for the success of Trinity Christian Academy going forward.

Physical Space
As TCA’s student population continues to grow, we are cognizant of our physical space
limitations. Since Golden Hills School Division owns the building, this has provided us with
opportunities to expand and further develop the facility. We currently have two detached
modular classrooms on the north side of the school. In previous years, we created classrooms
out of storage rooms and conference rooms and used some hallway space to create learning
environments. This year, with only one Kindergarten class, we were able to create a Music
room and the Library was moved back to a smaller classroom space, leaving the hallway
available for collaborative learning within the Junior High area.

                                                                                              Page 6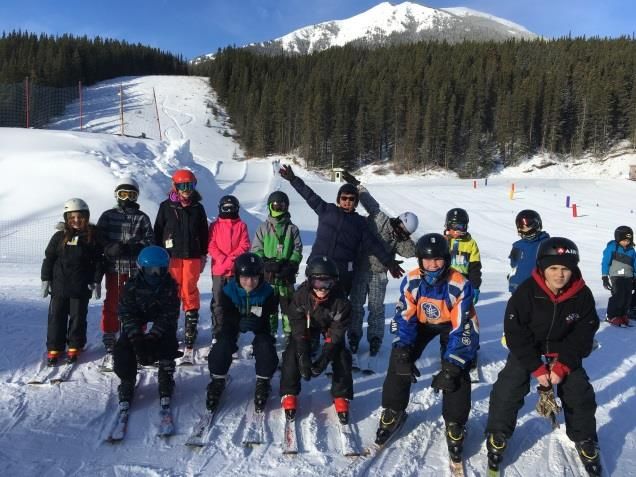
School: 1433 Trinity Christian Academy

           Boot Room

                                                     Students coming in from the Gr. 4 portable classroom.

Facility and Capital

We are grateful to the GHSD Building and Maintenance Department for their support in the
various facility improvements that have been made to TCA over the years. A long term building
plan will need to be put in place to alleviate our limited space issues. Currently, we are without
any meeting room or small breakout room space and, as our student population grows, we will
be in need of more functional classroom spaces and learning areas.

                                                             2017 Kindergarten Graduation Class
2009 Kindergarten Graduation Class                                      24 Students
           16 Students
                                                                                               Page 7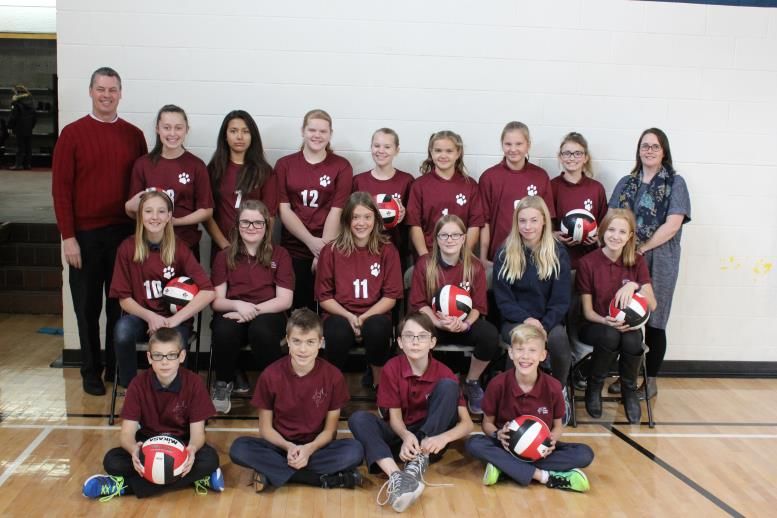
School: 1433 Trinity Christian Academy

Technology
In 2015, together with GHSD, TCA was able to purchase two carts of Chrome Books along with
a cart of mini iPads. There are also ten iPads which are dispersed to various classrooms, as
needed. With these purchases, the computer lab was removed. In September 2016, fifteen
digital cameras were purchased and a Photography class was added as a Junior High option.
The tools of technology are used extensively and the staff is striving to use them in the best way
to enhance student learning.

                                                                                              Page 8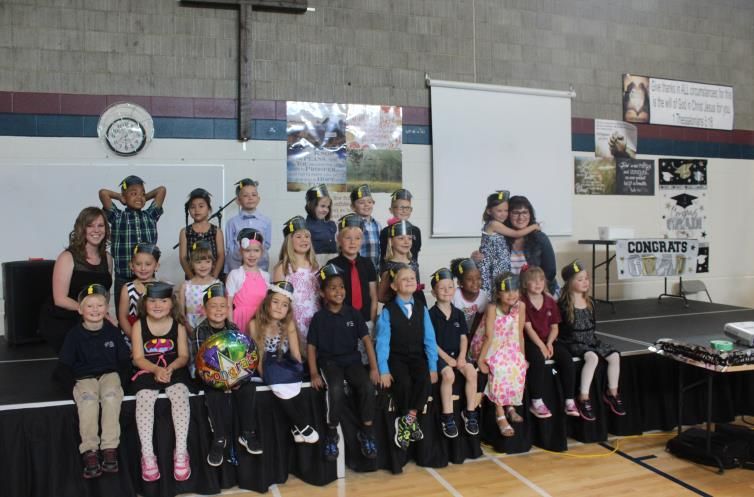
School: 1433 Trinity Christian Academy

Revenues and Expenditures

        Budgeted Operating Expenses 2017-2018                               %
        Allocation (includes prior year         $1,305,093
        carryover)
                                 Certified      $1,134,600                  86.9%

        STAFFING                 Non-           $116,893                    8.9%
                                 Certified
        Supplies & Services                     $52,600                     4.0%

                                                                                Page 9
School: 1433 Trinity Christian Academy

Combined 2017 Accountability Pillar Overall Summary
                                                         Trinity Christian Academy            Alberta                           Measure Evaluation

   Measure Category                   Measure                       Prev     Prev 3            Prev      Prev 3
                                                         Current                    Current
                                                                    Year      Year             Year       Year    Achievement      Improvement       Overall
                                                         Result                     Result
                                                                   Result   Average           Result    Average
Safe and Caring Schools    Safe and Caring                96.1      93.7     94.6     89.5     89.5       89.3     Very High        Maintained       Excellent
                           Program of Studies             82.1      71.9     75.7     81.9     81.9       81.5     Very High        Maintained       Excellent
                           Education Quality              98.1      95.8     95.9     90.1     90.1       89.6     Very High        Maintained       Excellent
Student Learning
Opportunities              Drop Out Rate                   0.0       *       10.5     3.0       3.2       3.3      Very High        Maintained       Excellent
                           High School Completion Rate
                                                           n/a      n/a       n/a     77.9     76.5       76.1        n/a              n/a             n/a
                           (3 yr)
Student Learning         PAT: Acceptable                  64.4      69.6     75.5     73.4     73.6       73.2     Very Low         Maintained       Concern
Achievement (Grades K-9) PAT: Excellence                   5.8      16.3     15.0     19.5     19.4       18.8     Very Low          Declined        Concern
                           Diploma: Acceptable             n/a      n/a       n/a     83.0     82.7       83.1        n/a              n/a             n/a
                           Diploma: Excellence             n/a      n/a       n/a     22.2     21.2       21.5        n/a              n/a             n/a
Student Learning
Achievement (Grades 10-    Diploma Exam Participation
                                                           n/a      n/a       n/a     54.9     54.6       53.1        n/a              n/a             n/a
12)                        Rate (4+ Exams)
                           Rutherford Scholarship
                                                           n/a      n/a       n/a     62.3     60.8       60.8        n/a              n/a             n/a
                           Eligibility Rate
                           Transition Rate (6 yr)          n/a      n/a       n/a     57.9     59.4       59.3        n/a              n/a             n/a
Preparation for Lifelong
Learning, World of Work,   Work Preparation               97.8      93.1     94.5     82.7     82.6       81.9     Very High        Maintained       Excellent
Citizenship
                           Citizenship                    93.8      84.4     90.8     83.7     83.9       83.6     Very High        Maintained       Excellent
Parental Involvement       Parental Involvement           98.0      95.9     97.4     81.2     80.9       80.7     Very High        Maintained       Excellent
Continuous Improvement     School Improvement             91.6      84.1     88.9     81.4     81.2       80.2     Very High        Maintained       Excellent

Notes:
1.   Data values have been suppressed where the number of respondents/students is fewer than 6. Suppression is marked with an asterisk (*).
2.   Overall evaluations can only be calculated if both improvement and achievement evaluations are available.
3.   Results for the ACOL measures are available in the detailed report: see "ACOL Measures" in the Table of Contents.
4.   Survey results for the province and school authorities were impacted by the changes in the number of students responding to the survey through
     the introduction of the OurSCHOOL/TTFM (Tell Them From Me) survey in 2014.
5.   Aggregated PAT results are based upon a weighted average of percent meeting standards (Acceptable, Excellence). The weights are the
     number of students enrolled in each course. Courses included: English Language Arts (Grades 6, 9, 9 KAE); Français (Grades 6, 9); French
     Language Arts (Grades 6, 9); Mathematics (6, 9, 9 KAE); Science (Grades 6, 9, 9 KAE); and Social Studies (Grades 6, 9, 9 KAE).
6.   Participation in Provincial Achievement Tests was impacted by the flooding in June 2013 (Grade 9 only) and by the fires in May to June 2016.
     Caution should be used when interpreting trends over time for the province and those school authorities affected by these events.
7.   Aggregated Diploma results are a weighted average of percent meeting standards (Acceptable, Excellence) on Diploma Examinations. The
     weights are the number of students writing the Diploma Examination for each course. Courses included: English Language Arts 30-1; English
     Language Arts 30-2; French Language Arts 30-1; Français 30-1; Mathematics 30-1; Mathematics 30-2; Chemistry 30; Physics 30; Biology 30;
     Science 30; Social Studies 30-1; and Social Studies 30-2.
8.   Caution should be used when interpreting evaluations and results over time for Mathematics 30-1/30-2, as equating was not in place until the
     2016/17 school year. Alberta Education does not comment on province wide trends until it has five years of equated examination data.
9.   Participation in Diploma Examinations was impacted by the flooding in June 2013 and by the fires in May to June 2016. Caution should be used
     when interpreting trends over time for the province and those school authorities affected by these events.
10. Weighting of school-awarded marks in diploma courses increased from 50% to 70% in the 2015/2016 school year. Caution should be used when
     interpreting trends over time.
11. Due to the change from previous data source systems to Provincial Approach to Student Information (PASI), Rutherford Scholarship Eligibility
     Rate results prior to 2015 are not available.

                                                                                                                                                      Page 10
School: 1433 Trinity Christian Academy
Measure Evaluation Reference
Achievement Evaluation
Achievement evaluation is based upon a comparison of Current Year data to a set of standards which remain consistent over time. The
Standards are calculated by taking the 3 year average of baseline data for each measure across all school jurisdictions and calculating the
5th, 25th, 75th and 95th percentiles. Once calculated, these standards remain in place from year to year to allow for consistent planning and
evaluation.
The table below shows the range of values defining the 5 achievement evaluation levels for each measure.
Measure Very Low Low Intermediate High Very High
Safe and Caring 0.00 - 77.62 77.62 - 81.05 81.05 - 84.50 84.50 - 88.03 88.03 - 100.00
Program of Studies 0.00 - 66.31 66.31 - 72.65 72.65 - 78.43 78.43 - 81.59 81.59 - 100.00
Education Quality 0.00 - 80.94 80.94 - 84.23 84.23 - 87.23 87.23 - 89.60 89.60 - 100.00
Drop Out Rate 100.00 - 9.40 9.40 - 6.90 6.90 - 4.27 4.27 - 2.79 2.79 - 0.00
High School Completion Rate (3 yr) 0.00 - 57.03 57.03 - 62.36 62.36 - 73.88 73.88 - 81.79 81.79 - 100.00
PAT: Acceptable 0.00 - 66.07 66.07 - 70.32 70.32 - 79.81 79.81 - 84.64 84.64 - 100.00
PAT: Excellence 0.00 - 9.97 9.97 - 13.44 13.44 - 19.56 19.56 - 25.83 25.83 - 100.00
Diploma: Acceptable 0.00 - 71.45 71.45 - 78.34 78.34 - 84.76 84.76 - 87.95 87.95 - 100.00
Diploma: Excellence 0.00 - 9.55 9.55 - 12.59 12.59 - 19.38 19.38 - 23.20 23.20 - 100.00
Diploma Exam Participation Rate (4+ Exams) 0.00 - 31.10 31.10 - 44.11 44.11 - 55.78 55.78 - 65.99 65.99 - 100.00
Transition Rate (6 yr) 0.00 - 39.80 39.80 - 46.94 46.94 - 56.15 56.15 - 68.34 68.34 - 100.00
Work Preparation 0.00 - 66.92 66.92 - 72.78 72.78 - 77.78 77.78 - 86.13 86.13 - 100.00
Citizenship 0.00 - 66.30 66.30 - 71.63 71.63 - 77.50 77.50 - 81.08 81.08 - 100.00
Parental Involvement 0.00 - 70.76 70.76 - 74.58 74.58 - 78.50 78.50 - 82.30 82.30 - 100.00
School Improvement 0.00 - 65.25 65.25 - 70.85 70.85 - 76.28 76.28 - 80.41 80.41 - 100.00
Notes:
1) For all measures except Drop Out Rate: The range of values at each evaluation level is interpreted as greater than or equal to the lower
value, and less than the higher value. For the Very High evaluation level, values range from greater than or equal to the lower value to
100%.
2) Drop Out Rate measure: As "Drop Out Rate" is inverse to most measures (i.e. lower values are "better"), the range of values at each
evaluation level is interpreted as greater than the lower value and less than or equal to the higher value. For the Very High evaluation
level, values range from 0% to less than or equal to the higher value.
Improvement Table
For each jurisdiction, improvement evaluation consists of comparing the Current Year result for each measure with the previous three-year
average. A chi-square statistical test is used to determine the significance of the improvement. This test takes into account the size of the
jurisdiction in the calculation to make improvement evaluation fair across jurisdictions of different sizes.
The table below shows the definition of the 5 improvement evaluation levels based upon the chi-square result.
Evaluation Category Chi-Square Range
Declined Significantly 3.84 + (current < previous 3-year average)
Declined 1.00 - 3.83 (current < previous 3-year average)
Maintained less than 1.00
Improved 1.00 - 3.83 (current > previous 3-year average)
Improved Significantly 3.84 + (current > previous 3-year average)
Overall Evaluation Table
The overall evaluation combines the Achievement Evaluation and the Improvement Evaluation. The table below illustrates how the
Achievement and Improvement evaluations are combined to get the overall evaluation.
Achievement
Improvement Very High High Intermediate Low Very Low
Improved Significantly Excellent Good Good Good Acceptable
Improved Excellent Good Good Acceptable Issue
Maintained Excellent Good Acceptable Issue Concern
Declined Good Acceptable Issue Issue Concern
Declined Significantly Acceptable Issue Issue Concern Concern
Category Evaluation
The category evaluation is an average of the Overall Evaluation of the measures that make up the category. For the purpose of the
calculation, consider an Overall Evaluation of Excellent to be 2, Good to be 1, Acceptable to be 0, Issue to be -1, and Concern to be -2. The
simple average (mean) of these values rounded to the nearest integer produces the Category Evaluation value. This is converted back to a
colour using the same scale above (e.g. 2=Excellent, 1=Good, 0=Intermediate, -1=Issue, -2=Concern)
Page 11School: 1433 Trinity Christian Academy
Outcome One: Alberta’s students are successful
Results (in percentages) Target Evaluation Targets
Performance Measure
2013 2014 2015 2016 2017 2017 Achievement Improvement Overall 2018 2019 2020
Overall percentage of students in
Grades 6 and 9 who achieved the
acceptable standard on Provincial 75.0 73.7 83.1 69.6 64.4 85.0 Very Low Maintained Concern 80.0 83.0 85.0
Achievement Tests (overall cohort
results).
Overall percentage of students in
Grades 6 and 9 who achieved the
standard of excellence on 10.7 9.2 19.5 16.3 5.8 20.0 Very Low Declined Concern 15.0 18.0 20.0
Provincial Achievement Tests
(overall cohort results).
Comment on Results
Overall, the staff are disappointed with the results. In a smaller school such as TCA, the data incorporated in this goal can
become easily skewed. The total number of students writing PAT exams in Grade 6 and Grade 9 was twenty-three. This
means that each student controlled 4.3% of our school’s results. The results can be easily increased or decreased
depending on a number of outside variables. The staff are disappointed with the number of students who met the acceptable
standard and the students who met the standard of excellence.
The 2016/2017 was not a year of instruction for the Grade 6 Science and Social Studies curriculum. The Grade 6 and 7
students were combined during those courses and were taught the Grade 7 curriculum.
It is our desire to provide the best possible education for our students while also providing them with an opportunity to
accomplish what our school mission proclaims: “Christ-centered education shaped through powerful learning and meaningful
relationships.”
Strategies
Reading
At Trinity Christian Academy, teachers use a wide variety of resources to teach reading skills and comprehension to
all the grade levels. The primary grades use Zoo Phonics and Animated Literacy to teach foundational reading skills.
The middle grades use the resource, Cornerstones, which is published by Gage Learning. Various novel studies are
integrated to teach comprehension strategies. The Junior High English classes use the Book Club Method to further
engage students in reading and responding to literature. Several of our teachers have been trained in and use the
“Daily Five” method to encourage independent study and buddy reading.
All teachers assess their students’ reading level by using Fountas and Pinnell to achieve consistency throughout the
school. Beginning in the 2015/2016 school year, a program called Emerging Readers was introduced, which
provides daily support to our lowest level readers in Grades 1 and 2.
Writing
Students in Kindergarten to Grade 3 use the program Handwriting Without Tears to learn the correct way to form
both printed and cursive letters. Other teachers use the resource, Words Their Way to increase vocabulary and
develop good spelling skills. The teachers include this as part of their Daily 5 rotations. Three teachers have
attended Barbara Mariconda’s Writing seminar as part of their professional development and have incorporated
these writing strategies into their daily instruction.
Junior High teachers use resources by Penny Kittle and Kelly Gallagher to teach various methods to further engage
adolescent writers.
Math
The main math resource for students in Grades 1 - 7 at TCA is JUMP Math. Other supplemental resources used by
the teachers include, Power of 10, Math for Success and Math Makes Sense.
Students in Grades 8 and 9 use the resource Math Links by McGraw-Hill Education. Each week students participate
in a critical challenge and/or lesson that promote critical thinking and inquiry. The teachers use Peter Liljedahl’s work
as a resource to support students’ thinking. To prepare the Grade 6 and 9 students for the non-calculator questions
on the PAT (Provincial Achievement Test), the teachers of those grades conduct on-going reviews and practice
strategies to increase student confidence when solving math problems without the use of a calculator.
Parental Involvement
All stakeholders at TCA would like to see an increase in the performance of TCA students on the PATs. To this end,
several opportunities are offered to parents by which they can become involved and support their children throughout
Page 12School: 1433 Trinity Christian Academy
the preparation and actual exam writing process. Teachers provide information to parents about the curricular
outcomes, expectations, and various ways they can support their child at home with regular review and study
materials.
Critical Thinking Strategies
Through various Professional Development opportunities and GHSD Collaborative Days, the teachers have
continued to learn, incorporate and implement critical thinking strategies into their daily instruction. TCA has several
copies of the resource Tools for Thought. The teachers continue to include these critical thinking tools in all subject
areas.
Page 13School: 1433 Trinity Christian Academy
Outcome One: Alberta’s students are successful (continued)
[No Data for Diploma Exam Results]
Results (in percentages) Target Evaluation Targets
Performance Measure
2012 2013 2014 2015 2016 2017 Achievement Improvement Overall 2018 2019 2020
High School Completion Rate -
Percentage of students who
n/a n/a n/a n/a n/a n/a n/a n/a
completed high school within three
years of entering Grade 10.
Drop Out Rate - annual dropout 0.0 0.0 0.0 0.0
* n/a 10.5 * 0.0 Very High Maintained Excellent
rate of students aged 14 to 18
High school to post-secondary
transition rate of students within n/a n/a n/a n/a n/a n/a n/a n/a
six years of entering Grade 10.
Percentage of Grade 12 students
eligible for a Rutherford n/a n/a n/a n/a n/a n/a n/a n/a
Scholarship.
Percentage of students writing
four or more diploma exams within n/a n/a n/a n/a n/a n/a n/a n/a
three years of entering Grade 10.
Comment on Results
Our goal is that all students who complete the Grade 9 program at TCA will be fully prepared for a rewarding high school
experience.
Strategies
The focus of the staff and administration over the past few years has been to have the junior high program at TCA
feel like a junior high unto itself, rather than an extension of an elementary school. With this in mind, the following
additions to the TCA junior high course load have been added over the last few years.
A partnership with Crowther Memorial Junior High to offer shop classes to the Grade 8/9 students
A Photography/Video option class for students in Grades 7 – 9
Outdoor Education class for Grades 7 – 9
Student leadership and mentoring opportunities
Teachers are teaching subject specific loads as opposed to being grade specific generalists
Introduced the use of a Physical Education specialist to increase the skill level being taught in junior high PE
classes
Drama and Art classes are taught as Fine Arts courses for junior high students
Introduction to Business Innovation class for Grades 8 – 9
Practicing cooking for Out-door Ed.
Page 14School: 1433 Trinity Christian Academy
Outcome One: Alberta’s students are successful (continued)
Results (in percentages) Target Evaluation Targets
Performance Measure
2013 2014 2015 2016 2017 2017 Achievement Improvement Overall 2018 2019 2020
Percentage of teachers, parents
and students who are satisfied
that students model the 93.9 93.9 94.2 84.4 93.8 90.0 Very High Maintained Excellent 92.0 94.0 95.0
characteristics of active
citizenship.
Percentage of teachers and
parents who agree that students
are taught attitudes and
95.7 95.0 95.5 93.1 97.8 95.0 Very High Maintained Excellent 97.0 97.0 97.0
behaviours that will make them
successful at work when they
finish school.
Comment on Results
As an alternative program with a Christian focus, excellent results in this outcome are an expectation. In our Christian Studies
classes and weekly chapel time, our commitment to citizenship education is foremost. Our Mission Statement, Vision
Statement and Values are reflected in the performance measure of “modeling the characteristics of active citizenship.” This
latest data confirms that our strategies are working. The data has improved by 14% from the previous year, and we are
excited that the various strategies are making a positive impact.
Strategies
Through our Christian Studies program we will continue to develop students that model active citizenship
by encouraging them to become involved in various activities around the school, such as leading chapel,
leadership club, peer supervisors on the playground, various fundraising events and involvement in the
Christmas Musical.
The leadership club (Grades 7 – 9) will be responsible for planning and implementing a comprehensive
school spirit plan. Through this planning and implementation process, our oldest students will be
encouraged to attain attitudes and behaviors that will make them successful productive citizens once they
have completed their formal education.
Some of the strategies we have employed this past year and will continue to use in the future, include are:
o Introduction to Outdoor Education class and Business class
o School swim team – in its third year
o Various sports teams (competitive and non-competitive) – Basketball, Volleyball, Badminton,
Track and Field for Grades 6 - 9
o Weekly chapel time focusing on TCA’s values
o Student involvement in creating props, staging, costumes and setting up the sound system for the
Christmas Musical
o After school choir for Grades 3 – 6
o Art Club (Elementary)
Page 15School: 1433 Trinity Christian Academy
Outcome Two: The systemic education achievement gap between First
Nations, Métis and Inuit students and all other students is
eliminated
(Results and evaluations for First Nations, Métis and Inuit measures are required for
Public/Separate/Francophone schools only)
Results (in percentages) Target Evaluation Targets
Performance Measure
2013 2014 2015 2016 2017 2017 Achievement Improvement Overall 2018 2019 2020
Overall percentage of self-identified
FNMI students in Grades 6 and 9
who achieved the acceptable * n/a * * * * * *
standard on Provincial Achievement
Tests (overall cohort results).
Overall percentage of self-identified
FNMI students in Grades 6 and 9
who achieved the standard of
* n/a * * * * * *
excellence on Provincial
Achievement Tests (overall cohort
results).
Overall percentage of self-identified
FNMI students who achieved the
n/a n/a n/a n/a n/a n/a n/a n/a
acceptable standard on diploma
examinations (overall results).
Overall percentage of self-identified
FNMI students who achieved the
n/a n/a n/a n/a n/a n/a n/a n/a
standard of excellence on diploma
examinations (overall results).
Comment on Results
While we do not have any data that to reflect this outcome, our belief would be that any students who attend TCA, regardless
of cultural background, will achieve academic success at the same rate as other students.
Page 16School: 1433 Trinity Christian Academy
Outcome Two: The systemic education achievement gap between First
Nations, Métis and Inuit students and all other students is
eliminated (continued)
Results (in percentages) Target Evaluation Targets
Performance Measure
2012 2013 2014 2015 2016 2017 Achievement Improvement Overall 2018 2019 2020
High School Completion Rate -
Percentage of self-identified FNMI
students who completed high n/a n/a n/a n/a n/a n/a n/a n/a
school within three years of entering
Grade 10.
Drop Out Rate - annual dropout rate
of self-identified FNMI students n/a n/a * n/a n/a n/a n/a n/a
aged 14 to 18
High school to post-secondary
transition rate of self-identified FNMI
n/a n/a n/a n/a n/a n/a n/a n/a
students within six years of entering
Grade 10.
Percentage of Grade 12 self-
identified FNMI students eligible for n/a n/a n/a n/a n/a n/a n/a n/a
a Rutherford Scholarship.
Percentage of self-identified FNMI
students writing four or more
n/a n/a n/a n/a n/a n/a n/a n/a
diploma exams within three years of
entering Grade 10.
Comment on Results
This outcome does not apply to Trinity Christian Academy as we are a Kindergarten to Grade 9 school.
Page 17School: 1433 Trinity Christian Academy
Outcome Three: Alberta’s education system is inclusive
Results (in percentages) Target Evaluation Targets
Performance Measure
2013 2014 2015 2016 2017 2017 Achievement Improvement Overall 2018 2019 2020
Percentage of teacher, parent and
student agreement that: students
are safe at school, are learning the
95.0 94.5 95.7 93.7 96.1 95.0 Very High Maintained Excellent 95.0 95.0 95.0
importance of caring for others,
are learning respect for others and
are treated fairly in school.
Comment on Results
We feel very positive about this outcome. This performance measure scored above our target and above previous year’s
results. Our belief is that an alternative program public school must be enthusiastically accepted by parents so that there is a
desire to send their children to TCA. This comes through extensive consultation with our TCA School Council, TCA Society
and through general parent interaction and feedback. We must maintain these relationships to continue meeting the needs
of both our students and parents. All stakeholders at TCA are committed to this outcome.
Strategies
To increase the number of people who feel students are safe at TCA, are learning the importance of caring for others,
respecting others and who are treated fairly in school, the following steps have, and will continue to be taken.
The administration team – the Associate Principal is in the building at all times with an increase in
administrative time
Discipline procedure at TCA is consistent, fair and prompt. If an issue arises, there is an administrator that
can deal with the issue immediately rather than waiting for an administrator to come from another school
Our Christian Studies classes focus on virtues of good learners as well as Christian values. Values such as
honesty, respect, truth and wisdom are highlighted in weekly chapel as well as intentionally integrated into
all subjects throughout the day.
Re-enforcement of positive behaviors in students by all adults in the school
Several of our older grades are buddies with younger grades – this provides a framework for strong
relationships to develop between all students
Christmas Hampers
Page 18School: 1433 Trinity Christian Academy
Outcome Four: Alberta has excellent teachers, school and school authority
leaders
Results (in percentages) Target Evaluation Targets
Performance Measure
2013 2014 2015 2016 2017 2017 Achievement Improvement Overall 2018 2019 2020
Percentage of teachers, parents
and students satisfied with the
opportunity for students to receive 82.0 85.0 87.0
a broad program of studies 78.7 79.6 75.7 71.9 82.1 80.0 Very High Maintained Excellent
including fine arts, career,
technology, and health and
physical education.
Comment on Results
This is an outcome that we are excited about and look forward to continue working on this year as we move closer towards
our goal. This past year, we have improved by 10% and would like to continue to grow and improve in the variety of learning
opportunities for our students. Since we are a relatively small K – 9 school, our potential to offer a wide variety of
programming, especially for our junior high students remains an area where we are striving to improve. We have made
significant progress in this area over the past three years but it is something that we need to continue to improve upon.
Through consultation, we have come to realize that our leadership students, TCA School Council, TCA Society and teaching
staff have all identified this as our most pressing area of need.
This past year, a survey was completed by staff to gain an understanding of the programming they would like to see
throughout the school. It was discovered that teachers were happy with the programming being offered but would like to see
second languages being offered at the junior high level.
Strategies
To broaden the range of programs our students encounter during the school year, the following steps have
been taken.
Through the support of the TCA Council, we are able to offer Industrial Arts Education programming to our
Grade 8/9 students at Crowther Memorial Junior High School. During the second semester, one to two
times per week, our students are bussed to CMJHS to take a course offered by a certified teacher. This
continues to be a major initiative for our school and we are excited to be able to offer this program for our
older students.
During the first semester, students in the TCA junior high classes will have an opportunity to take part in a
photography option as well as a business planning option. The school has purchased 15 cameras and are
excited about the optional course learning this will provide to our students
Art and Drama are also Fine Arts options that are offered to all of our students (K – 9)
For the past two years, we have hired a music specialist who teaches music to our Kindergarten to Grade 6
students weekly
Every year, we put on a Christmas Musical where students have the opportunity to act, sing, participate in
stage management, light and sound management, etc. Students rehearse during class and recess time to
prepare for the December production. This musical is performed live before an audience of family and the
general public.
With the help of GHSD, we have purchased two carts of Chrome Books and 1 cart of iPads for school use.
These tools will help our students further engage in various learning tasks as they move through their school
career
Our student leadership group is embarking on a project to broaden their Missions horizon. The goal is to
help our oldest students find ways to positively impact their school, community and an international area of
need
In the past, the Grade 5 – 9 students have participated in downhill ski lessons at Nakiska, as an alternative
PE environment. We will continuing to look for other options to broaden our scope of alternative PE options
Junior High students work towards attending WE day. This is an opportunity for students to participate in
leadership activities at different levels (local, national and global)
Since February of 2015, on an annual basis, the Grade 6 – 9 students attend Southern Alberta Bible Camp
for a weekend of fellowship mixed with indoor and outdoor activities with other Christian students from
across Alberta.
In April 2018, the Grade 8/9 students will be going on the first Eastern Canada Trip with EF Tours. This
correlates directly with several outcomes from the Alberta Program of Studies
Page 19School: 1433 Trinity Christian Academy
Outcome Five: Alberta’s education system is well governed and managed
Results (in percentages) Target Evaluation Targets
Performance Measure
2013 2014 2015 2016 2017 2017 Achievement Improvement Overall 2018 2019 2020
Percentage of teachers, parents
and students indicating that their
school and schools in their
89.5 90.4 92.3 84.1 91.6 90.0 Very High Maintained Excellent 92.0 93.0 94.0
jurisdiction have improved or
stayed the same the last three
years.
Percentage of teachers and
parents satisfied with parental
96.2 98.6 97.8 95.9 98.0 95.0 Very High Maintained Excellent 98.0 98.0 98.0
involvement in decisions about
their child's education.
Percentage of teachers, parents
and students satisfied with the 94.6 95.6 96.2 95.8 98.1 95.0 Very High Maintained Excellent 98.0 98.0 98.0
overall quality of basic education.
Comment on Results
We are very pleased with the results of all of these performance measures. For all three standards, we exceeded our goal
from the previous year.
One thing we need to be conscious of as TCA continues to grow and move forward is that we do not become complacent. It
must be our goal to continue to improve, implement best practices and create the school culture that enables students to
achieve their highest academic potential. This is evident in our strategies listed below.
Strategies
To have stakeholders believe that their school has improved over time, it is imperative to allow for growth and
change to occur. At TCA we will do this by taking the following steps.
Continue to add relevant programming whenever and wherever possible
Celebrate the conclusion of student’s time at TCA with a Grade 9 recognition ceremony in June of the
school year
Continue to hire staff members who are quality educators, but also believe strongly in the mission, vision
and values of Trinity Christian Academy
To increase the number of parents who feel involved in decisions about their child’s education the following steps will
be taken.
To make sure that parents are consulted, in person or by phone, in regards to a child’s Individual Program
Plan or their child’s Behavior Plan
Increase the number of parents that attend the TCA School Council meetings and get them involved in
decision making. We hope to do this though increased advertisement, guest speakers and creating an
atmosphere of improvement and open dialogue
Use various forms of social media (Facebook, Instagram, School website and digital school newsletter) to
keep parents informed of the activities at TCA
To increase the number of people who are satisfied with the quality of our basic education the following steps have
been taken.
Over the course of the last few years, we have continued to staff our classrooms to reflect the number of
students enrolled. As a result, we now have only one combined class for the 2017/2018 school year. The
Kindergarten to Grade 7 classes are stand-alone classes which is a positive increase from just two years
ago.
All classes will see an increase in their access to technological tools, thus allowing them to become more
engaged in their basic education
Continue to encourage Professional Learning Communities at the school level
Page 20School: 1433 Trinity Christian Academy
APPENDIX – Measure Details
The following pages include tables and graphs that provide detailed data for the performance measures. Schools may
include these under each measure/outcome to provide context and help in interpreting the results
Page 21School: 1433 Trinity Christian Academy
Drop Out Rate – Measure Details
Drop Out Rate - annual dropout rate of students aged 14 to 18
School Authority Province
2012 2013 2014 2015 2016 2012 2013 2014 2015 2016 2012 2013 2014 2015 2016
Drop Out Rate * n/a 10.5 * 0.0 5.1 3.4 3.8 3.1 3.4 3.6 3.3 3.5 3.2 3.0
Returning Rate n/a n/a n/a * n/a 23.7 17.1 13.3 10.1 10.1 22.8 20.7 20.9 18.2 18.9
Graph of School Results Graph of School Results
Notes:
1. Data values have been suppressed where the number of respondents/students is fewer than 6. Suppression is marked with an asterisk (*).
Page 22School: 1433 Trinity Christian Academy
Citizenship – Measure Details
Percentage of teachers, parents and students who are satisfied that students model the characteristics of active citizenship.
School Authority Province
2013 2014 2015 2016 2017 2013 2014 2015 2016 2017 2013 2014 2015 2016 2017
Overall 93.9 93.9 94.2 84.4 93.8 83.6 84.3 84.7 84.0 86.0 83.4 83.4 83.5 83.9 83.7
Teacher 100.0 100.0 100.0 96.0 100.0 94.5 93.5 94.0 94.5 96.3 93.6 93.8 94.2 94.5 94.0
Parent 95.0 100.0 98.3 93.1 96.0 79.2 81.9 81.4 80.1 82.8 80.3 81.9 82.1 82.9 82.7
Student 86.6 81.6 84.3 64.1 85.5 77.2 77.5 78.6 77.4 78.9 76.2 74.5 74.2 74.5 74.4
Graph of Overall School Results Graph of Detailed School Results
Notes:
1. Data values have been suppressed where the number of respondents/students is fewer than 6. Suppression is marked with an asterisk (*).
2. Survey results for the province and school authorities were impacted by the changes in the number of students responding to the survey through the
introduction of the OurSCHOOL/TTFM (Tell Them From Me) survey in 2014.
Work Preparation – Measure Details
Percentage of teachers and parents who agree that students are taught attitudes and behaviours that will make them successful at
work when they finish school.
School Authority Province
2013 2014 2015 2016 2017 2013 2014 2015 2016 2017 2013 2014 2015 2016 2017
Overall 95.7 95.0 95.5 93.1 97.8 84.2 82.4 82.5 85.5 82.3 80.3 81.2 82.0 82.6 82.7
Teacher 100.0 100.0 100.0 100.0 100.0 93.7 89.7 92.4 94.4 92.2 89.4 89.3 89.7 90.5 90.4
Parent 91.3 90.0 90.9 86.2 95.7 74.6 75.0 72.7 76.6 72.5 71.1 73.1 74.2 74.8 75.1
Graph of Overall School Results Graph of Detailed School Results
Notes:
1. Data values have been suppressed where the number of respondents/students is fewer than 6. Suppression is marked with an asterisk (*).
Page 23School: 1433 Trinity Christian Academy
Provincial Achievement Test Results – Measure Details
PAT Course by Course Results by Number Enrolled.
Results (in percentages) Target
2013 2014 2015 2016 2017 2017
A E A E A E A E A E A E
School * * 84.6 7.7 100.0 30.0 75.0 6.3 88.9 11.1 90.0 15.0
English Language Arts 6 Authority 82.8 16.1 78.3 10.8 85.7 17.1 84.8 14.0 83.9 14.8
Province 82.5 16.3 81.9 17.6 82.8 19.5 82.9 20.4 82.5 18.9
School n/a n/a n/a n/a n/a n/a n/a n/a n/a n/a n/a n/a
French Language Arts 6 Authority n/a n/a n/a n/a n/a n/a n/a n/a n/a n/a
Province 88.6 16.3 88.0 15.6 87.5 13.6 87.7 14.2 85.1 13.5
School n/a n/a n/a n/a n/a n/a n/a n/a n/a n/a n/a n/a
Français 6 Authority n/a n/a n/a n/a n/a n/a n/a n/a n/a n/a
Province 94.0 21.6 90.6 17.1 89.0 15.0 91.4 17.2 92.1 21.6
School * * 76.9 7.7 90.0 40.0 75.0 18.8 61.1 5.6 90.0 20.0
Mathematics 6 Authority 74.1 15.6 69.4 11.5 73.6 9.7 73.9 11.7 64.6 8.4
Province 73.0 16.4 73.5 15.4 73.2 14.1 72.2 14.0 69.4 12.6
School * * 84.6 30.8 90.0 20.0 75.0 25.0 66.7 11.1 90.0 20.0
Science 6 Authority 75.5 22.2 67.7 16.6 79.9 21.9 76.6 22.6 77.6 24.6
Province 77.5 25.9 75.9 24.9 76.3 25.3 78.0 27.1 76.9 29.0
School * * 69.2 0.0 80.0 10.0 62.5 12.5 44.4 0.0 90.0 20.0
Social Studies 6 Authority 71.3 17.7 60.3 9.6 72.3 19.0 70.6 15.0 67.4 17.9
Province 72.7 19.0 70.4 16.6 69.8 18.1 71.4 22.0 72.9 21.7
School * * 83.3 0.0 80.0 20.0 71.4 28.6 75.0 0.0 80.0 20.0
English Language Arts 9 Authority 73.1 12.7 72.7 16.0 74.1 12.1 76.1 15.8 74.9 12.9
Province 76.7 14.8 76.3 15.0 75.6 14.4 77.0 15.2 76.8 14.9
School n/a n/a n/a n/a n/a n/a n/a n/a n/a n/a n/a n/a
English Lang Arts 9 KAE Authority 71.4 4.8 65.9 7.3 70.0 10.0 73.3 10.0 65.9 9.8
Province 62.4 4.3 62.8 3.5 63.0 4.5 59.8 6.2 58.8 5.9
School n/a n/a n/a n/a n/a n/a n/a n/a n/a n/a n/a n/a
French Language Arts 9 Authority n/a n/a n/a n/a n/a n/a n/a n/a n/a n/a
Province 87.2 13.9 86.5 11.1 85.8 10.1 83.0 10.8 83.1 11.2
School n/a n/a n/a n/a n/a n/a n/a n/a n/a n/a n/a n/a
Français 9 Authority n/a n/a n/a n/a n/a n/a n/a n/a n/a n/a
Province 84.0 14.5 86.1 17.8 88.5 20.2 86.4 26.8 88.9 26.1
School * * 50.0 0.0 66.7 0.0 42.9 14.3 37.5 0.0 75.0 15.0
Mathematics 9 Authority 59.4 12.2 62.7 13.2 63.7 14.0 65.1 12.6 65.8 16.1
Province 66.8 18.3 67.1 17.3 65.3 17.9 67.8 17.5 67.2 19.0
School n/a n/a n/a n/a n/a n/a n/a n/a n/a n/a n/a n/a
Mathematics 9 KAE Authority 75.0 12.5 58.5 12.2 53.8 23.1 60.3 25.9 71.4 38.1
Province 65.8 14.7 63.4 14.5 60.9 14.4 61.2 13.0 57.5 13.3
School * * 50.0 0.0 77.8 22.2 71.4 14.3 62.5 0.0 80.0 20.0
Science 9 Authority 65.8 11.3 68.6 15.8 71.6 17.8 73.9 15.4 68.5 16.0
Province 72.9 20.0 73.2 22.1 74.1 22.8 74.2 22.4 74.0 21.4
School n/a n/a n/a n/a n/a n/a n/a n/a n/a n/a n/a n/a
Science 9 KAE Authority 68.2 18.2 57.1 14.3 52.6 10.5 70.7 10.3 74.4 20.5
Province 68.4 17.1 64.1 14.9 64.5 15.1 63.8 14.3 63.9 13.3
School * * 66.7 16.7 77.8 11.1 71.4 14.3 75.0 12.5 80.0 20.0
Social Studies 9 Authority 60.6 16.0 59.1 15.6 65.1 15.0 62.6 13.8 66.4 18.2
Province 65.5 18.8 65.5 19.9 65.1 19.8 64.7 18.0 67.0 20.2
School n/a n/a n/a n/a n/a n/a n/a n/a n/a n/a n/a n/a
Social Studies 9 KAE Authority 75.0 12.5 58.5 12.2 55.0 7.5 58.6 8.6 58.5 12.2
Province 64.6 13.0 61.8 10.7 57.3 11.2 58.0 11.6 56.3 12.7
Page 24School: 1433 Trinity Christian Academy
Graph of Overall Provincial Achievement Test Results
Notes:
1. Data values have been suppressed where the number of respondents/students is fewer than 6. Suppression is marked with an asterisk (*).
2. Participation in Provincial Achievement Tests was impacted by the flooding in June 2013 (Grade 9 only) and by the fires in May to June 2016.
Caution should be used when interpreting trends over time for the province and those school authorities affected by these events.
Page 25School: 1433 Trinity Christian Academy
Graph of Provincial Achievement Test Results by Course
[No Data for French Language Arts 6]
[No Data for Français 6]
Notes:
1. Data values have been suppressed where the number of respondents/students is fewer than 6. Suppression is marked with an asterisk (*).
2. Participation in Provincial Achievement Tests was impacted by the flooding in June 2013 (Grade 9 only) and by the fires in May to June 2016.
Caution should be used when interpreting trends over time for the province and those school authorities affected by these events.
Page 26School: 1433 Trinity Christian Academy
Graph of Provincial Achievement Test Results by Course
[No Data for English Lang Arts 9 KAE]
[No Data for French Language Arts 9] [No Data for Français 9]
[No Data for Mathematics 9 KAE]
Notes:
1. Data values have been suppressed where the number of respondents/students is fewer than 6. Suppression is marked with an asterisk (*).
2. Participation in Provincial Achievement Tests was impacted by the flooding in June 2013 (Grade 9 only) and by the fires in May to June 2016.
Caution should be used when interpreting trends over time for the province and those school authorities affected by these events.
Page 27School: 1433 Trinity Christian Academy
Graph of Provincial Achievement Test Results by Course
[No Data for Science 9 KAE]
[No Data for Social Studies 9 KAE]
Notes:
1. Data values have been suppressed where the number of respondents/students is fewer than 6. Suppression is marked with an asterisk (*).
2. Participation in Provincial Achievement Tests was impacted by the flooding in June 2013 (Grade 9 only) and by the fires in May to June 2016.
Caution should be used when interpreting trends over time for the province and those school authorities affected by these events.
Page 28School: 1433 Trinity Christian Academy
PAT Results Course By Course Summary By Enrolled With Measure Evaluation
Trinity Christian Academy Alberta
Achievement Improvement Overall 2017 Prev 3 Year Average 2017 Prev 3 Year Average
Course Measure N % N % N % N %
Acceptable Standard High Maintained Good 18 88.9 13 86.5 49,572 82.5 46,989 82.5
English Language Arts 6
Standard of Excellence Low Maintained Issue 18 11.1 13 14.6 49,572 18.9 46,989 19.2
Acceptable Standard n/a n/a n/a n/a n/a n/a n/a 3,185 85.1 2,864 87.7
French Language Arts 6
Standard of Excellence n/a n/a n/a n/a n/a n/a n/a 3,185 13.5 2,864 14.4
Acceptable Standard n/a n/a n/a n/a n/a n/a n/a 542 92.1 524 90.3
Français 6
Standard of Excellence n/a n/a n/a n/a n/a n/a n/a 542 21.6 524 16.5
Acceptable Standard Very Low Declined Concern 18 61.1 13 80.6 49,507 69.4 46,906 73.0
Mathematics 6
Standard of Excellence Very Low Declined Concern 18 5.6 13 22.1 49,507 12.6 46,906 14.5
Acceptable Standard Low Declined Issue 18 66.7 13 83.2 49,501 76.9 46,914 76.7
Science 6
Standard of Excellence Very Low Declined Concern 18 11.1 13 25.3 49,501 29.0 46,914 25.8
Acceptable Standard Very Low Declined Concern 18 44.4 13 70.6 49,485 72.9 46,903 70.5
Social Studies 6
Standard of Excellence Very Low Declined Concern 18 0.0 13 7.5 49,485 21.7 46,903 18.9
Acceptable Standard Low Maintained Issue 8 75.0 8 78.3 45,487 76.8 43,746 76.3
English Language Arts 9
Standard of Excellence Very Low Declined Concern 8 0.0 8 16.2 45,487 14.9 43,746 14.9
Acceptable Standard n/a n/a n/a n/a n/a n/a n/a 1,428 58.8 1,576 61.9
English Lang Arts 9 KAE
Standard of Excellence n/a n/a n/a n/a n/a n/a n/a 1,428 5.9 1,576 4.8
Acceptable Standard n/a n/a n/a n/a n/a n/a n/a 2,763 83.1 2,625 85.1
French Language Arts 9
Standard of Excellence n/a n/a n/a n/a n/a n/a n/a 2,763 11.2 2,625 10.7
Acceptable Standard n/a n/a n/a n/a n/a n/a n/a 379 88.9 392 87.0
Français 9
Standard of Excellence n/a n/a n/a n/a n/a n/a n/a 379 26.1 392 21.6
Acceptable Standard Very Low Maintained Concern 8 37.5 7 53.2 45,020 67.2 43,295 66.7
Mathematics 9
Standard of Excellence Very Low Maintained Concern 8 0.0 7 4.8 45,020 19.0 43,295 17.6
Acceptable Standard n/a n/a n/a n/a n/a n/a n/a 1,848 57.5 2,026 61.8
Mathematics 9 KAE
Standard of Excellence n/a n/a n/a n/a n/a n/a n/a 1,848 13.3 2,026 14.0
Acceptable Standard Intermediate Maintained Acceptable 8 62.5 7 66.4 45,445 74.0 43,808 73.8
Science 9
Standard of Excellence Very Low Declined Concern 8 0.0 7 12.2 45,445 21.4 43,808 22.4
Acceptable Standard n/a n/a n/a n/a n/a n/a n/a 1,440 63.9 1,547 64.1
Science 9 KAE
Standard of Excellence n/a n/a n/a n/a n/a n/a n/a 1,440 13.3 1,547 14.8
Acceptable Standard High Maintained Good 8 75.0 7 72.0 45,484 67.0 43,722 65.1
Social Studies 9
Standard of Excellence Low Maintained Issue 8 12.5 7 14.0 45,484 20.2 43,722 19.2
Acceptable Standard n/a n/a n/a n/a n/a n/a n/a 1,393 56.3 1,533 59.0
Social Studies 9 KAE
Standard of Excellence n/a n/a n/a n/a n/a n/a n/a 1,393 12.7 1,533 11.2
Notes:
1. Data values have been suppressed where the number of respondents/students is fewer than 6. Suppression is marked with an asterisk (*).
2. Achievement Evaluation is not calculated for courses that do not have sufficient data available, either due to too few jurisdictions offering the
course or because of changes in tests.
3. Participation in Provincial Achievement Tests was impacted by the flooding in June 2013 (Grade 9 only) and by the fires in May to June 2016.
Caution should be used when interpreting trends over time for the province and those school authorities affected by these events.
Page 29School: 1433 Trinity Christian Academy
Measure Evaluation Reference - Achievement Evaluation
Achievement evaluation is based upon a comparison of Current Year data to a set of standards which remain consistent over time. The
Standards are calculated by taking the 3 year average of baseline data for each measure across all school jurisdictions and calculating the
5th, 25th, 75th, and 95th percentiles. Once calculated, these standards remain in place from year to year to allow for consistent planning and
evaluation.
The table below shows the range of values defining the 5 achievement evaluation levels for each measure.
Course Measure Very Low Low Intermediate High Very High
Acceptable Standard 0.00 - 67.95 67.95 - 78.40 78.40 - 86.09 86.09 - 91.37 91.37 - 100.00
English Language Arts 6
Standard of Excellence 0.00 - 6.83 6.83 - 11.65 11.65 - 17.36 17.36 - 22.46 22.46 - 100.00
Acceptable Standard 0.00 - 41.69 41.69 - 73.54 73.54 - 92.32 92.32 - 97.93 97.93 - 100.00
French Language Arts 6
Standard of Excellence 0.00 - 2.72 2.72 - 8.13 8.13 - 15.29 15.29 - 23.86 23.86 - 100.00
Acceptable Standard 0.00 - 63.91 63.91 - 70.73 70.73 - 79.61 79.61 - 88.67 88.67 - 100.00
Mathematics 6
Standard of Excellence 0.00 - 8.53 8.53 - 11.31 11.31 - 18.13 18.13 - 25.17 25.17 - 100.00
Acceptable Standard 0.00 - 60.36 60.36 - 78.51 78.51 - 86.46 86.46 - 90.64 90.64 - 100.00
Science 6
Standard of Excellence 0.00 - 11.74 11.74 - 17.42 17.42 - 25.34 25.34 - 34.31 34.31 - 100.00
Acceptable Standard 0.00 - 58.97 58.97 - 68.15 68.15 - 76.62 76.62 - 83.55 83.55 - 100.00
Social Studies 6
Standard of Excellence 0.00 - 7.30 7.30 - 12.45 12.45 - 19.08 19.08 - 30.09 30.09 - 100.00
Acceptable Standard 0.00 - 63.55 63.55 - 75.66 75.66 - 83.70 83.70 - 90.27 90.27 - 100.00
English Language Arts 9
Standard of Excellence 0.00 - 5.96 5.96 - 9.43 9.43 - 14.72 14.72 - 20.46 20.46 - 100.00
Acceptable Standard 0.00 - 29.97 29.97 - 53.86 53.86 - 76.19 76.19 - 91.85 91.85 - 100.00
English Lang Arts 9 KAE
Standard of Excellence 0.00 - 0.00 0.00 - 0.30 0.30 - 10.00 10.00 - 20.31 20.31 - 100.00
Acceptable Standard 0.00 - 67.59 67.59 - 81.33 81.33 - 92.06 92.06 - 97.26 97.26 - 100.00
French Language Arts 9
Standard of Excellence 0.00 - 1.67 1.67 - 6.81 6.81 - 17.11 17.11 - 28.68 28.68 - 100.00
Acceptable Standard 0.00 - 52.42 52.42 - 60.73 60.73 - 73.88 73.88 - 78.00 78.00 - 100.00
Mathematics 9
Standard of Excellence 0.00 - 8.18 8.18 - 12.49 12.49 - 18.10 18.10 - 24.07 24.07 - 100.00
Acceptable Standard 0.00 - 28.14 28.14 - 53.85 53.85 - 75.83 75.83 - 94.44 94.44 - 100.00
Mathematics 9 KAE
Standard of Excellence 0.00 - 0.00 0.00 - 6.07 6.07 - 20.43 20.43 - 31.67 31.67 - 100.00
Acceptable Standard 0.00 - 50.57 50.57 - 60.14 60.14 - 72.50 72.50 - 76.89 76.89 - 100.00
Science 9
Standard of Excellence 0.00 - 3.39 3.39 - 6.71 6.71 - 11.81 11.81 - 15.85 15.85 - 100.00
Acceptable Standard 0.00 - 38.75 38.75 - 59.30 59.30 - 78.33 78.33 - 87.58 87.58 - 100.00
Science 9 KAE
Standard of Excellence 0.00 - 0.00 0.00 - 7.47 7.47 - 21.41 21.41 - 40.82 40.82 - 100.00
Acceptable Standard 0.00 - 56.26 56.26 - 62.27 62.27 - 74.04 74.04 - 79.85 79.85 - 100.00
Social Studies 9
Standard of Excellence 0.00 - 10.03 10.03 - 12.78 12.78 - 19.76 19.76 - 24.03 24.03 - 100.00
Acceptable Standard 0.00 - 38.79 38.79 - 53.82 53.82 - 72.42 72.42 - 84.88 84.88 - 100.00
Social Studies 9 KAE
Standard of Excellence 0.00 - 0.00 0.00 - 5.71 5.71 - 17.19 17.19 - 36.26 36.26 - 100.00
Notes:
1. The range of values at each evaluation level is interpreted as greater than or equal to the lower value, and less than the higher value. For the
Very High evaluation level, values range from greater than or equal to the lower value to 100%.
2. Participation in Provincial Achievement Tests was impacted by the flooding in June 2013 (Grade 9 only) and by the fires in May to June 2016.
Caution should be used when interpreting trends over time for the province and those school authorities affected by these events.
3. Achievement Evaluation is not calculated for courses that do not have sufficient data available, either due to too few jurisdictions offering the
course or because of changes in tests.
Improvement Table
For each jurisdiction, improvement evaluation consists of comparing the Current Year result for each measure with the previous three-year
average. A chi-square statistical test is used to determine the significance of the improvement. This test takes into account the size of the
jurisdiction in the calculation to make improvement evaluation fair across jurisdictions of different sizes.
The table below shows the definition of the 5 improvement evaluation levels based upon the chi-square result.
Evaluation Category Chi-Square Range
Declined Significantly 3.84 + (current < previous 3-year average)
Declined 1.00 - 3.83 (current < previous 3-year average)
Maintained less than 1.00
Improved 1.00 - 3.83 (current > previous 3-year average)
Improved Significantly 3.84 + (current > previous 3-year average)
Page 30School: 1433 Trinity Christian Academy
Overall Evaluation Table
The overall evaluation combines the Achievement Evaluation and the Improvement Evaluation. The table below illustrates how the
Achievement and Improvement evaluations are combined to get the overall evaluation.
Achievement
Very High High Intermediate Low Very Low
Improved Significantly Excellent Good Good Good Acceptable
Improved Excellent Good Good Acceptable Issue
Maintained Excellent Good Acceptable Issue Concern
Declined Good Acceptable Issue Issue Concern
Declined Significantly Acceptable Issue Issue Concern Concern
Page 31School: 1433 Trinity Christian Academy
Program of Studies – Measure Details
Percentage of teachers, parents and students satisfied with the opportunity for students to receive a broad program of studies
including fine arts, career, technology, and health and physical education.
School Authority Province
2013 2014 2015 2016 2017 2013 2014 2015 2016 2017 2013 2014 2015 2016 2017
Overall 78.7 79.6 75.7 71.9 82.1 80.1 81.2 77.9 79.6 81.1 81.5 81.3 81.3 81.9 81.9
Teacher 87.2 90.9 84.7 78.5 90.9 87.0 85.8 83.5 84.5 87.8 87.9 87.5 87.2 88.1 88.0
Parent 83.1 85.4 84.5 77.2 86.3 78.1 80.6 75.0 77.3 77.7 78.9 79.9 79.9 80.1 80.1
Student 65.6 62.5 58.0 60.1 69.0 75.2 77.3 75.2 77.1 77.7 77.8 76.6 76.9 77.5 77.7
Graph of Overall School Results Graph of Detailed School Results
Notes:
1. Data values have been suppressed where the number of respondents/students is fewer than 6. Suppression is marked with an asterisk (*).
2. Survey results for the province and school authorities were impacted by the changes in the number of students responding to the survey through the
introduction of the OurSCHOOL/TTFM (Tell Them From Me) survey in 2014.
Parental Involvement – Measure Details
Percentage of teachers and parents satisfied with parental involvement in decisions about their child's education.
School Authority Province
2013 2014 2015 2016 2017 2013 2014 2015 2016 2017 2013 2014 2015 2016 2017
Overall 96.2 98.6 97.8 95.9 98.0 80.8 80.2 79.4 80.3 84.4 80.3 80.6 80.7 80.9 81.2
Teacher 96.7 100.0 100.0 100.0 100.0 88.8 86.1 87.9 87.8 91.5 88.5 88.0 88.1 88.4 88.5
Parent 95.8 97.1 95.7 91.8 96.0 72.8 74.3 70.9 72.8 77.3 72.2 73.1 73.4 73.5 73.9
Graph of Overall School Results Graph of Detailed School Results
Notes:
1. Data values have been suppressed where the number of respondents/students is fewer than 6. Suppression is marked with an asterisk (*).
2. Survey results for the province and school authorities were impacted by the changes in the number of students responding to the survey through the
introduction of the OurSCHOOL/TTFM (Tell Them From Me) survey in 2014.
Page 32You can also read