Learning Provision Organisation: Key Data Report Hall Cross Pyramid - Spring 2019 Release
←
→
Page content transcription
If your browser does not render page correctly, please read the page content below
Learning Provision
Organisation:
Key Data Report
Hall Cross Pyramid
Spring 2019 Release
Analysis of learning provision within the Hall Cross pyramid.

                                                                    1

                                                                Final Vs. 02/2019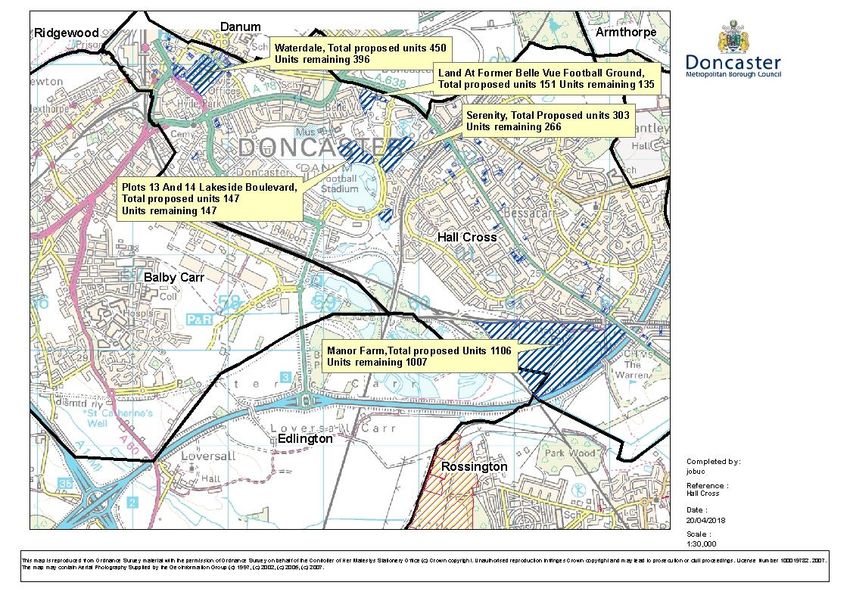
Contents
1. Executive Summary ............................................................................................................................. 4
   1a. Demographic ................................................................................................................................. 4
   1b. Schools .......................................................................................................................................... 4
   1c. Childcare and Early Years .............................................................................................................. 5
   1d. SEND.............................................................................................................................................. 6
   1e. Key Points ...................................................................................................................................... 6
2. The Pyramid in Context ...................................................................................................................... 7
   2a. Overview ....................................................................................................................................... 7
   2b. Demographics and Population...................................................................................................... 7
   2c. Pyramid Profile .............................................................................................................................. 8
   2d. Ethnicity and Migration ................................................................................................................ 9
   2e. Indices of Multiple Deprivation (IMD) Overview ........................................................................ 10
   2f. Working Tax Credits ..................................................................................................................... 10
   2g. Free School Meals (FSM) ............................................................................................................. 10
   2h. Birth Trends................................................................................................................................. 11
   2i. Social Care Referrals..................................................................................................................... 12
3. Structure of Learning Provision ........................................................................................................ 13
   3a. Locality of Provision .................................................................................................................... 15
   3b. Academy Conversions ................................................................................................................. 16
   3c. Social Mobility ............................................................................................................................. 17
   3d. English as Other Language (EAL) ................................................................................................. 19
   3e. Admissions .................................................................................................................................. 20
   3f. Pupil Absence............................................................................................................................... 21
   3g. Exclusions .................................................................................................................................... 22
4. Pupil Place Planning .......................................................................................................................... 23
   4a. Housing Growth and S106 Contributions ................................................................................... 23
   4b. Locality of Development Sites .................................................................................................... 27
5. Schools capacity (SCAP) .................................................................................................................... 28
   5a. South Hall Cross Primary School Projections .............................................................................. 28
   5b. South Hall Cross Primary Totals .................................................................................................. 29
   5c. North Hall Cross Primary School Projections .............................................................................. 30
   5d. North Hall Cross Primary Totals .................................................................................................. 31
   5e. All Hall Cross Primary Totals ....................................................................................................... 31
   5f. Secondary School Projections (Hall Cross Academy) ................................................................... 32
   5g. Childcare Places & Availability .................................................................................................... 34

                                                                                                                                                         2
5i. Childcare Projections ................................................................................................................... 38
5j. Capital Projects ............................................................................................................................ 39
5k. SEND Provision ............................................................................................................................ 40
5l. Childcare Costs ............................................................................................................................. 42
6. Early Education Funding.................................................................................................................... 43
6a. 2 Year Old Early Education .......................................................................................................... 43
6b. 3 and 4 Year Old Early Education (Universal) ............................................................................. 44
6c. 30 Hours Free Childcare for Eligible 3 and 4 Year Olds ............................................................... 44
6d. Future Plans ................................................................................................................................ 47
7. Parent Feedback ............................................................................................................................... 48
31. Executive Summary
1a. Demographic
The Hall Cross pyramid is located in the central area of Doncaster and consists of 12% of the Doncaster population.
Within this pyramid 72% of the children are White British, the other 33% are made up of other nationalities, the next largest group
being any other white background’ which is Polish, Kurdish, Turkish and Czech.
In 2010 the Hall Cross pyramid had an IMD of 32.70% and was the 11th most deprived area in Doncaster, 2015 data shows that the
Hall Cross IMD has increased to 34.80% however it remains the 11th most deprived area in Doncaster. The Hall Cross pyramid is
consistently lower than the Doncaster average.
Birth rates for Hall Cross have increased in recent years.
Within Hall Cross pyramid 21% of primary pupils and 19% of secondary pupils have EAL, the most common first language other
than English locally is Urdu and then Polish in the primary schools and Polish and then Urdu in secondary.
74% of primary children in Hall Cross access school places outside of their catchment school, 1% of these were out of pyramid.
48% of secondary children access outside of their catchment school, of which 57% moved to faith schools.
There are a number of planned housing developments, totalling 2709 dwellings coming to the Hall Cross area over the next few
years.
The Hall Cross pyramid consists of a range of learning provision types from the school / academy and PVI sector offering a mix of
flexible provision.
1b. Schools
There are ten schools in Hall Cross, five of these have converted to academy status, three remain maintained schools and there
are two free schools, XP and XP East.
There is a program of capital and S106 investment in Doncaster. Within this pyramid three schools have accessed funding.
Across Doncaster there are a number of sites identified for LOCYP. One site is available in the Hall Cross pyramid.
4Within this pyramid pupil absence rates in primary schools have remained fairly static; however secondary absence rates have
been quite unstable.
Primary school sector projections for the next five years show an emerging shortfall of places in south Hall Cross with sufficient
places remaining available in north Hall Cross. Secondary data shows that Hall Cross has significant shortfalls moving forwards,
however in contrast neighbouring Outwood Danum has surplus places throughout. When looking at the two localities as a cluster
there remains a shortfall in 2021/22.
1c. Childcare and Early Years
Childcare places are based on summer term as this shows the highest occupancy throughout the year. In summer 2018 there were
vacant places in all provision types, including provisions that cover weekends and shift patterns.
Based on current birth rates and average take up over previous terms Hall Cross projections show that there is a potential for a
shortfall of childcare places for children aged between 11 to 14 years.
In this pyramid Childminder costs are lower than the Doncaster and Yorkshire and Humber averages; however Full Day-care is
higher than the Doncaster average but significantly lower than Yorkshire and Humber average. Breakfast and afterschool clubs are
higher than the Doncaster average and holiday play scheme averages are significantly higher than the Doncaster and Yorkshire and
Humber average. Doncaster as a borough remains below the Yorkshire and Humber average.
The take up of 2 year old early education funding borough wide was 80% in Autumn 2017, 75% in Spring 2018 and 80% in
Summer 2018.
The take up of the 3 and 4 year old universal provision borough wide was 92% in Autumn 2017, 98% in Spring 2018 and 98% in
Summer 2018.
The take up of the 30 hours extended entitlement borough wide was 78% in Autumn 2017, 79% in Spring 2018 and 76% in
Summer 2018.
There are no identified concerns from families in the Hall Cross area highlighting shortfalls in provision for Spring term 2018.
51d. SEND
Within this pyramid is St Wilfrid’s, a Pupil Referral Unit.
1e. Key Points
Based on current birth rates, projections for this area show that over the next five years in the primary sector there is an emerging
shortfall of places in south Hall Cross but sufficient places remaining available in north Hall Cross. However in secondary there is
an increasing shortfall of places across all year groups. There are no identified childcare concerns in the Hall Cross area.
62. The Pyramid in Context
2a. Overview
The data within this report aims to provide an overview of the Hall Cross pyramid, the available learning provision within the
pyramid and identify any pressures or shortfalls which will form part of the borough wide Learning Provision Organisation Strategy.
The first section gives an overview of the dynamics of the area and then moves onto analysis of pupil place provision.
2b. Demographics and Population
Doncaster is an ambitious borough and very few places in the UK come close to us in terms of delivering major projects over the
last 10 years. These projects are world class and have changed Doncaster considerably, with several more multi-million pound
developments already underway and in the pipeline.
Landmark developments include:
The Great Yorkshire Way Project (FARRS)
iPort
Aero Centre, Yorkshire
Project Unity (DN7)
National Rail College
Institute of Technology
PGA European Tour Development at Rossington Hall
Doncaster Corn Exchange Restoration
Bader School
DUTC
Big Picture Learning
The Urban Centre Master Plan including; City Gateway, Enterprise Market Place, Waterfront, Minster Canal Side, Civic/Business
District, Parklands, Retail Core, Innovation Quarter, Waterfront Phase 2.
72c. Pyramid Profile
The catchment area for Hall Cross Academy is children living in the central area of Doncaster which includes Hyde Park, Belle Vue,
Lakeside, Cantley and Bessacarr.
The town centre is Doncaster’s central business district, a major sub-regional shopping centre and the place of employment for
tens of thousands of people. Home to the North’s biggest traditional market, the inspiring minster, Mansion House, theatres,
museums and leisure facilities, there are significant new developments such as the transport interchange with regular train services
to London and Edinburgh, there is the Hub (Doncaster College), the Doncaster Keepmoat is home to Doncaster Rovers Football
Club, Doncaster Rugby League FC, and Doncaster Rovers Belles. Weddings, conferences, exhibitions and concerts can all be held
in this 15’000 capacity stadium. A mini stadium at the side containing a six lane running track is home to Doncaster Athletics Club
and the local American football team. At the moment Doncaster is building on previous successes and has set out a new
framework for the development of the town centre, the urban centre master plan, key projects are; City Gateway, Enterprise Market
Place, Waterfront, Minster Canal Side, Civic/Business District, Parklands, Retail Core, Innovation Quarter and phase 2 of the
Waterfront.
Hyde Park is a defined area within Doncaster’s Central area. The area extends east and includes the majority of the housing that
lies south of Carr House Road; it also includes Elmfield Park.
Bessacarr is mainly an affluent and prospering suburb with fewer children and young people and more people aged over 50
compared with the Doncaster average.
Cantley has a high population of older residents aged over 70 compared with the Doncaster average. The picturesque village of
Old Cantley is placed alongside Cantley and is classed as countryside living. Old Cantley has a smaller population with a low
proportion of children and young adults under 35.
Lakeside The Lakeside district is one of Doncaster’s flagship development areas, encompassing the recently re-developed world
famous ‘Doncaster Racecourse’, the new National College for High Speed Rail, the Dome leisure complex, the impressive
Keepmoat Stadium and the popular Lakeside Village Outlet Shopping Centre. A relatively affluent district, Lakeside provides
Doncaster with an array of stylish modern apartments and new high quality family homes in an attractive waterside setting.
82d. Ethnicity and Migration
This data shows the breakdown of significant ethnicities of the children within the Hall Cross pyramid, 72% of the children are White
British. The main nationalities of any other white background are Polish, Kurdish, Turkish and Czech
4% 3% White British
8%
Any other White
Background
13% Pakistani
72% Any other Asian
Background
Indian
*Source: School Census Spring 2018
92e. Indices of Multiple Deprivation (IMD) Overview
This data shows a comparison between the 2015 IMD and the 2010 IMD. The data shows that although the Hall Cross pyramid
remains below the Doncaster average the IMD has increased by 2.1% since 2010.
2015 IMD 2010 IMD
Pyramid 2015 1 most deprived, 16 Pyramid 2010 1 most deprived, 16
least deprived least deprived
Hall Cross Pyramid 34.80% 11 Hall Cross Pyramid 32.70% 11
Doncaster Average 35.40% - Doncaster Average 33.56% -
* Source: 2015 Indices of Multiple Deprivation https://www.gov.uk/government/collections/english-indices-of-deprivation
2f. Working Tax Credits
The table below shows the percentage take up of the Childcare Element of Working Tax Credits. The take up in this pyramid is
comparable to the Doncaster and National averages.
School Pyramid Area 2013 - 2014 Tax Year
Hall Cross Pyramid 14.07%
Doncaster Average 14.74%
National Average 14.30%
2g. Free School Meals (FSM)
The table below shows the number of children accessing Free School Meals within the pyramid. Data shows that the Hall Cross
pyramid has a lower level of FSM take up than the Doncaster average.
School Pyramid Area % FSM
Hall Cross Pyramid 13%
Non-geographic (includes all special schools and PRUs, plus McAuley & XP 17%
secondary schools)
Doncaster Average 16%
102h. Birth Trends
Baseline data for pupil place planning is based on health data. This data identifies children’s residency at time of birth, and is widely
accepted as the most accurate dataset of children residing within the borough. The data shows the birth trends for children residing
in Hall Cross at birth against the borough wide trends.
1st September 2013 1st September 2014
1st September 2015 1st September 2016 1st September 2017
Pyramid to 31st August 2014 to 31st August 2015
to 31st August 2016 to 31st August 2017 to 31st August 2018
(Current Reception) (Current Nursery)
Hall Cross Pyramid 360 257 353 372 380
Doncaster 3610 2719 3557 3478 3529
*Source: NHS Birth Data September 2018
Hall Cross Pyramid Doncaster
400 4000
350 3500
300 3000
250
200 2500
150 2000
100 1500
50 1000
0
500
1st 1st 1st 1st 1st 0
September September September September September 1st September 1st September 1st September 1st September 1st September
2013 to 31st 2014 to 31st 2015 to 31st 2016 to 31st 2017 to 31st 2013 to 31st 2014 to 31st 2015 to 31st 2016 to 31st 2017 to 31st
August 2014 August 2015 August 2016 August 2017 August 2018 August 2014 August 2015 August 2016 August 2017 August 2018
(Current (Current (Current (Current
Reception) Nursery) Reception) Nursery)
112i. Social Care Referrals
The data below shows the number of children who are subject to a Social Care Referral and the category they fall in to.
January 2018 Children in Children in Child February 2018 Children in Children in Child
Care Need Protection Care Need Protection
Hall Cross Hall Cross
31 131 23 34 121 22
Pyramid Pyramid
% of Borough % of Borough
wide Total 9% 7% 6% Wide Total 10% 7% 6%
Doncaster Total 348 1878 371 Doncaster Total 343 1840 393
123. Structure of Learning Provision
The following pages set out the context of the local provision within the Hall Cross pyramid. Below is a table showing all the
provision by type.
Secondary School Hall Cross Academy
XP School
XP East
Infant Schools None
Junior Schools None
Primary Schools Bessacarr Primary School
Hawthorn Primary School
Hatchell Wood Primary Academy
Willow Primary School
St Peters Catholic Primary School
Atlas Academy
Lakeside Primary School
Special Schools None
Alternative Provision (PRU’s) St Wilfrid’s Academy (Delta)
School Nurseries Bessacarr Primary School
Hawthorn Primary School
Atlas Academy
Lakeside Primary School
13Full Day-care Provider (PVI Sector Nurseries) Building Blocks Montessori
Little Stars Day Nursery
St Mary’s Day Nursery
Toy Box Day Nursery
Cavendish House Private Nursery
Stickymits Childcare Centre
Little Learners Day Nursery
Stadium Stars Day Nursery
Sessional Care Providers / Pre-School Playgroups Hatchell Wood Pre-school
Tiddlywinks Pre-school
Out of School Provision (Breakfast Clubs, After School Care and Bessacarr Primary School
Holiday Schemes)
Hatchell Wood Primary School
Hawthorn Primary School
Willow Primary School
Lakeside Primary School
Little Learners Day Nursery
Stickymits Childcare Centre
Childminders 37 Childminders
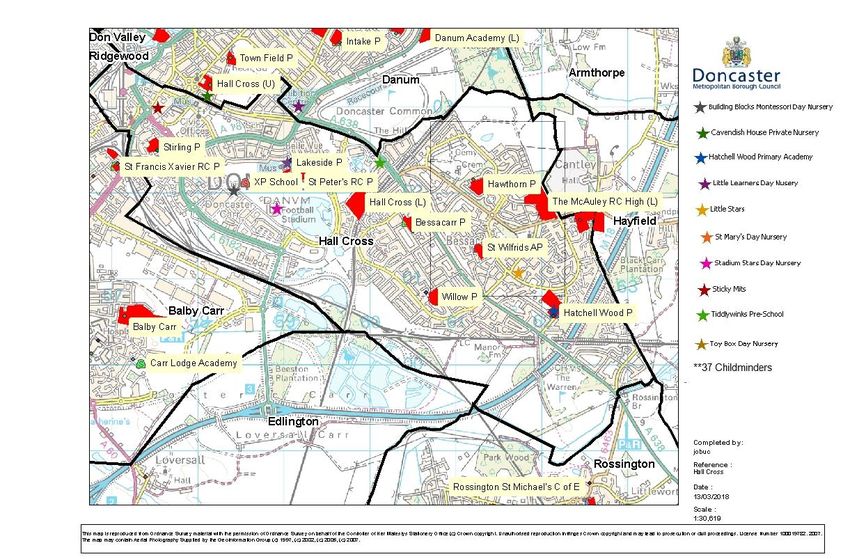
143a. Locality of Provision
To help to visualise the local provision the map below shows the geographical location of each provision from both the School /
Academy and PVI Sector. The exception is that childminders are not plotted. Although they work to the same Ofsted standards as
all childcare provision they operate from their home address and therefore are summarised within the key. The pyramid is 5.7
square miles in size.
153b. Academy Conversions
There has been a drive in recent years for schools to convert to academy status. Academies are independent, state-funded
schools, which receive their funding directly from central government, rather than through the local authority.
In Doncaster 54% of schools have converted to academies. This includes all of our secondary schools.
In Hall Cross pyramid 5 schools are converted to academies and 2 are free schools. The remaining maintained schools are
Hawthorn Primary School, Lakeside Primary School and St Peters Catholic Primary School.
Maintained Schools Academies
Hawthorn Primary School Bessacarr Primary School
Lakeside Primary School Hatchell Wood Primary Academy
St Peters Catholic Primary School Willow Primary School
Hall Cross Academy
Atlas Academy
XP School
XP East
163c. Social Mobility
The data below shows the most common moves out of pyramid schools and their destination school outside of the usual leaving
point over a 2 year period for academic years 2016/17 and 2017/18.
Joined Left
Stable 1st Most Common 2nd Most Common 3rd Most Common
School Name In In
Places Destination Destination Destination
Year Year
Bessacarr Primary 442 51 37 OOA (28) Willow Primary (2) Hayfield Lane Primary (1)
St Peter's Catholic
Lakeside Primary 352 89 67 OOA (32) Primary (5) Sandringham Primary (3)
Hawthorn Primary 245 75 42 OOA (18) Tranmoor Primary (4) Town Field Primary (2)
Atlas Academy 230 118 78 OOA (46) *Atlas Academy (4) Balby Central Primary (4)
Willow Primary 341 112 53 OOA (32) Bessacarr Primary (6) Hawthorn Primary (2)
Hatchell Wood Intake Primary Academy
419 58 40 OOA (18) Barnburgh Primary (2)
Primary Academy (2)
St Peter's Catholic Conisbrough Ivanhoe
Primary 223 17 13 OOA (7) Carr Lodge Academy (1) Junior/Infant (1)
Hall Cross Academy 2037 308 262 OOA (217) *Hall Cross Academy (10) The Hayfield School (7)
Pyramid Total 4289 828 592
Doncaster Total 48746 5762 5792
* Schools denoted with an Asterisk identify where a pupil has moved from a Doncaster school to an out of area school then returned to their original Doncaster school.
17Primary Movement Within or Mobility Vs Stable Secondary
Outside of Pyramid Parents
Out of Pyramid Within Pyramid Secondary School Total Stable Secondary School Left
9% 11%
91% 89%
183d. English as Other Language (EAL)
Within the Hall Cross pyramid 21% of the primary pupils and 19% of the secondary pupils are EAL. The Doncaster total shows that
9% of primary pupils and 6% of secondary pupils are EAL; therefore Hall Cross is above the borough wide average.
The data below shows most common first languages (other than English) within this pyramid compared to borough wide:
Primary
Hall Cross Pyramid Borough wide
Urdu 79 Polish 893
Polish 72 Romanian 205
Slovakian 64 Urdu 164
Kurdish 53 Kurdish 136
Punjabi 31 Slovakian 136
Secondary
Hall Cross Pyramid Borough wide
Polish 121 Polish 701
Urdu 81 Romanian 217
Punjabi 48 Urdu 126
Romanian 42 Slovakian 114
Slovakian 37 Punjabi 110
The local authority delivers bilingual classroom support to four schools within this pyramid, as detailed below:
School EMTAS Support Languages Supported
Hawthorn Primary School Yes Romanian, Polish, Lithuanian, Czech/Slovak
Hatchell Wood Primary Academy Yes Polish
Bessacarr Primary School No
St Peters Catholic Primary School Yes Polish, Russian, Latvian
Willow Primary School No
Lakeside Primary School Yes Russian, Kurdish, Romanian, Czech/Slovak, Polish, Turkish, Bulgarian
Atlas Academy No
Hall Cross Academy No
193e. Admissions
The data below shows the non-catchment children on role and their identified catchment school.
Primary Spring Census 2018
% Attending
Catchment Catchment Catchment Catchment Catchment
School from out of
School School School School School
Catchment
27% Atlas Academy Town Field Bessacarr Sandringham Intake Primary
Lakeside Primary (54) Primary (8) Primary (6) Primary (5) Academy (4)
32% Lakeside Primary Hexthorpe Balby Central Town Field Woodfield
Atlas Academy
(50) Primary (9) Primary (7) Primary (5) Primary (3)
Hatchell Wood Willow Primary Tranmoor Branton St Lakeside Primary
Hawthorn Primary 26% Wilfrid’s CofE
Primary (40) (7) Primary (3) (2)
Primary (3)
Hatchell Wood Hawthorn Willow Primary Bessacarr Hayfield Lane Lakeside Primary
40%
Primary Primary (79) (15) Primary (9) Primary (8) (7)
Hatchell Wood Hawthorn Willow Primary Lakeside Primary Intake Primary
Bessacarr Primary 59%
Primary (54) Primary (52) (49) (15) (12)
St Peters Catholic 0% VA Schools are borough wide and do not have an allocated catchment area
Primary
Hatchell Wood Bessacarr Hawthorn Lakeside Primary Grange Lane
Willow Primary 61%
Primary (69) Primary (62) Primary (48) (10) Infant (8)
Secondary Spring Census 2018
% Attending
Catchment Catchment Catchment Catchment Catchment
Catchment School from out of
School School School School School
Catchment
Outwood Sir Thomas Rossington All
Astrea Academy Ash Hill
Hall Cross Academy 55% Academy Danum Wharton Saints Academy
Woodfields (224) Academy (62)
(333) Academy (99) (83)
203f. Pupil Absence
The table below shows a 5 year trend for authorised and unauthorised absences by Primary and Secondary.
Primary
2016/17 2015/16 2014/15 2013/14 2012/13
Auth Unauth Total Auth Unauth Total Auth Unauth Total Auth Unauth Total Auth Unauth Total
Hawthorn Primary 3.2 1.8 5.0 3.4 2.8 6.2 3.9 2.2 6.1 4.4 1.9 6.2 3.8 1.6 5.4
Hatchell Wood
3.4 1.3 4.7 3.3 1.2 4.5 3.5 0.6 4.1 3.8 0.7 4.5 4.1 0.4 4.5
Primary Academy
Bessacarr Primary 2.8 0.5 3.3 2.8 0.7 3.5 3.1 0.7 3.8 2.5 0.4 2.9 4.7 0.2 4.9
St Peters Catholic
2.6 0.4 3.0 2.9 0.3 3.2 3.3 0.1 3.4 3.3 0.2 3.5 5.6 0.2 5.8
Primary
Willow Primary 3.3 0.7 4.0 2.7 0.7 3.4 2.8 0.7 3.5 2.9 0.5 3.4 5.1 0.2 5.3
Lakeside Primary 3.4 1.2 4.6 2.5 2.5 4.9 2.9 1.6 4.5 2.7 2.0 4.7 3.8 1.7 5.5
Atlas Academy 2.0 3.4 5.4 1.6 4.1 5.8 2.1 4.3 6.4 2.7 3.3 5.9 4.3 2.8 7.1
Hall Cross 3.0% 1.2% 4.3% 2.8% 1.6% 4.4% 3.0% 1.4% 4.4% 3.1% 1.2% 4.3% 4.5% 0.9% 5.4%
Doncaster 3.0% 1.2% 4.2% 3.0% 1.1% 4.1% 3.0% 1.1% 4.1% 3.1% 0.9% 4.0% 4.2% 1.0% 5.1%
National 3.1% 0.9% 4.0% 3.2% 0.8% 3.9% 3.3% 0.7% 4.0% 3.2% 0.7% 3.9% 4.1% 0.7% 4.8%
Secondary
2016/17 2015/16 2014/15 2013/14 2012/13
Auth Unauth Total Auth Unauth Total Auth Unauth Total Auth Unauth Total Auth Unauth Total
Hall Cross 3.9 2.3 6.3 3.7 2.0 5.7 3.5 2.0 5.5 3.9 1.9 5.7 5.3 1.7 7.0
Academy
Doncaster 4.1% 2.5% 6.6% 3.8% 2.1% 5.9% 3.6% 2.0% 5.7% 3.7% 1.9% 5.6% 4.6% 1.9% 6.5%
National 3.8% 1.3% 5.2% 3.8% 1.2% 5.0% 4.0% 1.2% 5.2% 3.9% 1.2% 5.1% 4.6% 1.2% 5.8%
The data shows that for primary over the last 5 years the absence rates have remained static, however secondary absence rates
have been quite unstable.
213g. Exclusions
This data summarises the number of permanent exclusions by school.
Number of Permanent Exclusions
School Name
2016 / 17
Willow Primary School 1
Pyramid Total 1
Doncaster Total 13
224. Pupil Place Planning
4a. Housing Growth and S106 Contributions
The annual SCAP return to the DfE requires each local authority to aggregate birth and housing growth data into pupil yields and
pupil projections alongside actual pupil numbers. The birth and housing data can, for interested parties, be shown separately. The
following represents this combined data for the Hall Cross area from the 2017 SCAP return.
The housing element projects the number of additional children from the proposed developments using this formula:
4 to 10 year old children (Year groups R to 6) = 21 children (3 per year group) per 100 planned dwellings
11 to 16 year old children (Year groups 7 to 11) = 15 children (3 per year group) per 100 planned dwellings
Current applications contributing to housing growth in Hall Cross pyramid (as at Sept 17)
Lakeside Primary School (North Hall Cross pyramid)
No. of
Application Decision Development Proposal Dwellings
Proposed
Granted Change of use premises into restaurant, retail unit
Park Hotel, Carr House Road 10
No contribution requested and 10 apartments
Granted (Subject to S106) Development of 147 dwellings (amended from
Lakeside Plots 13/14 147
Contribution requested £376,433.00 170)
Granted Erection of 123 houses and associated highways
Land south west of Carr House Road 123
No contribution requested and landscaping
Granted
Rockingham House 10 dwellings 10
No contribution requested
Granted subject to S106 Land at former Belle Vue football Erection of 151 dwellings and associated
151
Contribution requested £180,000.00 ground, Bawtry Road infrastructure
Lakeside Primary Total 441
23Atlas Academy (North Hall Cross pyramid)
No. of
Application Decision Development Proposal Dwellings
Proposed
Granted Denison House, 15 South Parade, COU from offices to 11 self- contained
11
No contribution requested DN1 2DR apartments 9 x 1 bed & 2 x 2 bed
Granted Electricity Substation Young Street Erection of 3-storey building incorporating 10 10
No contribution requested DN1 3EL apartments
Granted Change of use to 12 residential apartments on
Cussins House 22-28 Wood Street 12
No contribution requested floor 3/4 with office accommodation at floor 1/2
Granted Land at Chequer Road Details of appearance, layout & Scale for 97 97
No contribution requested dwellings
Granted 87-89 St Sepulchre Gate Change of use from play area to 12 residential 12
No contribution requested flats
Granted 87 St Sepulchre Drive 11 dwellings 11
No contribution requested
Decided Prior approval not required Notification for prior approval for proposed
Consort House, Waterdale change of use of floors 1 - 5 from offices to 65 65
No contribution requested
flats
Granted Princegate House, Ground Floor. Change of use from Job Centre to 14 Self-
14
No contribution requested Princegate, Doncaster contained flats
Granted (Subject to S106) Multi-use development, including civic quarter,
Land at Waterdale 399
No contribution requested theatre, hotels, housing etc.
Granted Danum House, St Sepulchre Gate - Change of use from retail units to 78 one
78
No contribution requested floors 1, 2, 3 & 4 bedroom apartments
Decided Prior approval not required Old Guildhall Yard Building, Old Notification for prior approval for proposed
change of use of offices to 10 flats on first and 10
No contribution requested Guildhall Yard
second floors
Atlas Academy Primary Total 719
24Bessacarr Primary School (South Hall Cross pyramid)
No. of
Application Decision Development Proposal Dwellings
Proposed
Granted subject to S106 Land South East of Lakeside
Erection of 51 dwellings 51
Contribution of £60,000.00 agreed Boulevard (Winscar Road) Plot 5b
Granted Serenity Lakeside Boulevard/Gliwice Residential Development of 19 Dwellings and
19
No contribution requested Way associated infrastructure
Granted
Lakeside Boulevard/Gliwice Way 258 Dwellings 258
No contribution requested
Granted subject to S106 Erection of 105 dwellings with associated
Land off Gliwice Way 105
No contribution requested landscaping and infrastructure
Bessacarr Primary Total 433
Hatchell Wood Primary Academy (South Hall Cross pyramid)
No. of
Application Decision Development Proposal Dwellings
Proposed
Granted Manor Farm, Bessacarr Lane Phase 1 Phase 1 - 205 dwellings 205
No contribution requested only
Granted subject to S106 Manor Farm, Bessacarr Lane Mixed use development 901
School Land Granted
Granted Garage Site, Newlands Close Erection of 10 dwellings 10
No contribution requested
Hatchell Wood Primary Total 1116
25Pyramid Grand Totals
Locality Number of Proposed Developments
North Hall Cross Pyramid 1160
South Hall Cross Pyramid 1549
Pyramid Total 2709
Final Overview of Status
Catchment Primary Schools Application Decision
15 Granted
4 Schools Affected 6 Granted Subject to S106
2 Decided – Prior Approval Not Required
*Source: Learning Provision Organision - Projected Housing Growth (inc. SCAP 2017)
264b. Locality of Development Sites
The map below shows the locality of the potential development sites within the pyramid with 90 plus dwellings.
275. Schools Capacity (SCAP)
Below are the projected school places which were submitted in the 2018 SCAP survey. Primary Places are projected for 5 years
including the current year due to the children starting school at 5 years, and secondary places are projected beyond this point due to
the age of the children. The row titled CAP shows the capacity within each year group. Where cells are highlighted red, this is due to
the projected capacity exceeding the actual places available. The Hall Cross pyramid is geographically disjointed with some
provision incapable of supporting other areas, for clarity of data we have split the below information into North and South Hall Cross.
The data is based on the Autumn 2017 census.
5a. South Hall Cross Primary School Projections
PAN-NOR
PAN-NOR
PAN-NOR
PAN-NOR
PAN-NOR
PAN-NOR
PAN-NOR
PRI ALL
YEAR CAP CAP
R 1 2 3 4 5 6 SUB BAL
Hawthorn Primary School
2018/19 40 280 39 1 29 11 34 6 38 2 46 -6 36 4 28 12 250 30
2019/20 40 280 27 13 39 1 29 11 34 6 38 2 46 -6 36 4 249 31
2020/21 40 280 25 15 27 13 39 1 29 11 34 6 38 2 46 -6 238 42
2021/22 40 280 32 8 25 15 27 13 39 1 29 11 34 6 38 2 224 56
2022/23 40 280 26 14 32 8 25 15 27 13 39 1 29 11 34 6 212 68
Hatchell Wood Primary Academy
2018/19 60 420 60 0 58 2 56 4 60 0 62 -2 59 1 57 3 412 8
2019/20 60 420 40 20 60 0 58 2 56 4 60 0 62 -2 59 1 395 25
2020/21 60 420 31 29 40 20 60 0 58 2 56 4 60 0 62 -2 367 53
2021/22 60 420 43 17 31 29 40 20 60 0 58 2 56 4 60 0 348 72
2022/23 60 420 55 5 43 17 31 29 40 20 60 0 58 2 56 4 343 77
28PAN-NOR
PAN-NOR
PAN-NOR
PAN-NOR
PAN-NOR
PAN-NOR
PAN-NOR
PRI ALL
YEAR CAP CAP
R 1 2 3 4 5 6 SUB BAL
Bessacarr Primary School
2018/19 60 420 60 0 59 1 60 0 58 2 60 0 60 0 61 -1 418 2
2019/20 60 420 56 4 61 -1 60 0 61 -1 59 1 61 -1 61 -1 419 1
2020/21 60 420 56 4 56 4 61 -1 60 0 61 -1 59 1 61 -1 414 6
2021/22 60 420 62 -2 56 4 56 4 61 -1 60 0 61 -1 59 1 415 5
2022/23 60 420 70 -10 62 -2 56 4 56 4 61 -1 60 0 61 -1 426 -6
Willow Primary School
2018/19 60 420 48 12 52 8 46 14 55 5 60 0 56 4 56 4 373 47
2019/20 60 420 53 7 50 10 54 6 48 12 57 3 62 -2 58 2 382 38
2020/21 60 420 44 16 55 5 52 8 56 4 50 10 59 1 64 -4 380 40
2021/22 60 420 45 15 46 14 57 3 54 6 58 2 52 8 61 -1 373 47
2022/23 60 420 46 14 47 13 48 12 59 1 56 4 60 0 54 6 370 50
5b. South Hall Cross Primary Totals
PAN-NOR
PAN-NOR
PAN-NOR
PAN-NOR
PAN-NOR
PAN-NOR
PAN-NOR
PRI ALL
YEAR CAP CAP
R 1 2 3 4 5 6 SUB BAL
2018/19 220 1540 207 13 198 22 196 24 211 9 228 -8 211 9 202 18 1453 87
2019/20 220 1540 176 44 210 10 201 19 199 21 214 6 231 -11 214 6 1445 95
2020/21 220 1540 156 64 178 42 212 8 203 17 201 19 216 4 233 -13 1399 141
2021/22 220 1540 182 38 158 62 180 40 214 6 205 15 203 17 218 2 1360 180
2022/23 220 1540 197 23 184 36 160 60 182 38 216 4 207 13 205 15 1351 189
295c. North Hall Cross Primary School Projections
PAN-NOR
PAN-NOR
PAN-NOR
PAN-NOR
PAN-NOR
PAN-NOR
PAN-NOR
PRI ALL
YEAR CAP CAP
R 1 2 3 4 5 6 SUB BAL
Lakeside Primary School
2018/19 60 420 34 26 52 8 59 1 50 10 54 6 40 20 46 14 335 85
2019/20 60 420 54 6 35 25 53 7 60 0 51 9 55 5 41 19 349 71
2020/21 60 420 52 8 55 5 36 24 54 6 61 -1 52 8 56 4 366 54
2021/22 60 420 36 24 53 7 56 4 37 23 55 5 62 -2 53 7 352 68
2022/23 60 420 40 20 37 23 54 6 57 3 38 22 56 4 63 -3 345 75
Atlas Academy
2018/19 60 420 50 10 38 22 37 23 37 23 39 21 34 26 29 31 264 156
2019/20 60 420 35 25 51 9 39 21 38 22 38 22 40 20 35 25 276 144
2020/21 60 420 40 20 36 24 52 8 40 20 39 21 39 21 41 19 287 133
2021/22 60 420 46 14 41 19 37 23 53 7 41 19 40 20 40 20 298 122
2022/23 60 420 49 11 47 13 42 18 38 22 54 6 42 18 41 19 313 107
St Peter’s Catholic Primary School
2018/19 30 210 30 0 30 0 30 0 30 0 30 0 29 1 30 0 209 1
2019/20 30 210 26 4 30 0 30 0 30 0 30 0 30 0 29 1 205 5
2020/21 30 210 26 4 26 4 30 0 30 0 30 0 30 0 30 0 202 8
2021/22 30 210 26 4 26 4 26 4 30 0 30 0 30 0 30 0 198 12
2022/23 30 210 28 2 26 4 26 4 26 4 30 0 30 0 30 0 196 14
305d. North Hall Cross Primary Totals
PAN-NOR
PAN-NOR
PAN-NOR
PAN-NOR
PAN-NOR
PAN-NOR
PAN-NOR
PRI ALL
YEAR CAP CAP
R 1 2 3 4 5 6 SUB BAL
2018/19 150 1050 114 36 120 30 126 24 117 33 123 27 103 47 105 45 808 242
2019/20 150 1050 115 35 116 34 122 28 128 22 119 31 125 25 105 45 830 220
2020/21 150 1050 118 32 117 33 118 32 124 26 130 20 121 29 127 23 855 195
2021/22 150 1050 108 42 120 30 119 31 120 30 126 24 132 18 123 27 848 202
2022/23 150 1050 117 33 110 40 122 28 121 29 122 28 128 22 134 16 854 196
5e. All Hall Cross Primary Totals
PAN-NOR
PAN-NOR
PAN-NOR
PAN-NOR
PAN-NOR
PAN-NOR
PAN-NOR
PRI ALL
YEAR CAP CAP
R 1 2 3 4 5 6 SUB BAL
2018/19 370 2590 321 49 318 52 322 48 328 42 351 19 315 55 307 63 2262 328
2019/20 370 2590 291 79 326 44 323 47 327 43 333 37 355 15 319 51 2274 316
2020/21 370 2590 274 96 295 75 330 40 327 43 331 39 337 33 360 10 2254 336
2021/22 370 2590 290 80 278 92 299 71 334 36 331 39 335 35 341 29 2208 382
2022/23 370 2590 314 56 294 76 282 88 303 67 338 32 335 35 339 31 2205 385
315f. Secondary School Projections (Hall Cross Academy)
PAN-
PAN-
PAN-
PAN-
PAN-
NOR
NOR
NOR
NOR
NOR
ALL
YEAR CAP 7 8 9 10 11 SUB BAL 12 13 14 6TH
CAP
2018/19 280 1400 283 -3 274 6 271 9 280 0 261 19 1369 31 292 275 - 567
2019/20 280 1400 315 -35 288 -8 279 1 276 4 285 -5 1443 -43 275 232 - 507
2020/21 280 1400 334 -54 319 -39 292 -12 283 -3 280 0 1508 -108 295 219 - 514
2021/22 280 1400 343 -63 338 -58 323 -43 296 -16 287 -7 1587 -187 285 235 - 520
2022/23 280 1400 386 -106 347 -67 342 -62 327 -47 300 -20 1702 -302 289 227 - 516
2023/24 280 1400 358 -78 389 -109 350 -70 345 -65 330 -50 1772 -372 298 230 - 528
2024/25 280 1400 351 -71 361 -81 392 -112 353 -73 348 -68 1805 -405 330 237 - 567
2025/26 280 1400 346 -66 354 -74 364 -84 395 -115 356 -76 1815 -415 339 262 - 601
Contributing Factors
Outwood Academy Danum
PAN-
PAN-
PAN-
PAN-
PAN-
NOR
NOR
NOR
NOR
NOR
ALL
YEAR CAP 7 8 9 10 11 SUB BAL 12 13 14 6TH
CAP
2018/19 280 1400 176 104 193 87 179 101 214 66 193 87 955 445 102 45 - 147
2019/20 280 1400 187 93 177 103 194 86 180 100 215 65 953 447 107 83 - 190
2020/21 280 1400 248 32 187 93 177 103 194 86 180 100 986 414 121 88 - 209
2021/22 280 1400 241 39 248 32 187 93 177 103 194 86 1047 353 107 99 - 206
2022/23 280 1400 232 48 244 36 251 29 190 90 180 100 1097 303 110 88 - 198
2023/24 280 1400 226 54 235 45 247 33 254 26 193 87 1155 245 108 90 - 198
2024/25 280 1400 233 47 228 52 237 43 249 31 256 24 1203 197 117 88 - 205
2025/26 280 1400 233 47 235 45 230 50 239 41 251 29 1188 212 134 96 - 230
32Cluster Totals
PAN-
PAN-
PAN-
PAN-
PAN-
NOR
NOR
NOR
NOR
NOR
ALL
YEAR CAP 7 8 9 10 11 SUB BAL 12 13 14 6TH
CAP
2018/19 560 2800 459 101 467 93 450 110 494 66 454 5 2324 476 394 320 - 714
2019/20 560 2800 502 58 465 95 473 87 456 104 500 2 2396 404 382 315 - 697
2020/21 560 2800 582 -22 506 54 469 91 477 83 460 122 2494 306 416 307 - 723
2021/22 560 2800 584 -24 586 -26 510 50 473 87 481 103 2634 166 392 334 - 726
2022/23 560 2800 618 -58 591 -31 593 -33 517 43 480 138 2799 1 399 315 - 714
2023/24 560 2800 584 -24 624 -64 597 -37 599 -39 523 61 2927 -127 406 320 - 726
2024/25 560 2800 584 -24 589 -29 629 -69 602 -42 604 -20 3008 -208 447 325 - 772
2025/26 560 2800 579 -19 589 -29 594 -34 634 -74 607 -28 3003 -203 473 358 - 831
Secondary Summary
The data shows that Hall Cross has significant shortfalls moving forwards, however in contrast neighbouring Outwood Danum has
surplus places throughout. When looking at the two localities as a cluster there remains a continuous shortfall from 2020/21.
335g. Childcare Places & Availability
The tables below show the occupancy levels and the availability of the childcare provision for the Summer Term 2018.
Childcare Provision within Schools, PVI Sector Full Day-care and Sessional Care and Childminders
0 to 1 Yrs 2 Yrs 3 & 4 Yrs 5 to 10 Yrs 11 to 14 Yrs Total Availability
VACANY RATE
Shift Patterns
8am to 6pm
Before 8am
NOR (FTE)
NOR (FTE)
NOR (FTE)
NOR (FTE)
NOR (FTE)
NOR (FTE)
Weekends
BALANCE
BALANCE
BALANCE
BALANCE
BALANCE
BALANCE
School, PVI and Childminder
After 6pm
PLACES
PLACES
PLACES
PLACES
PLACES
PLACES
Annual
Provision
Atlas Academy 26 17 9 26 17 9 35% TT 1
Bessacarr Primary School 26 26 0 26 26 0 0% TT 1
Hawthorn Primary School 8 7 1 26 23 3 34 30 4 12% TT 1
Lakeside Primary School 26 19 7 26 19 7 27% TT 1
School Totals 8 7 1 104 85 19 112 92 20 18% - 0 4 0 0 0
Little Learners Day Nursery 24 16 8 20 18 2 72 68 4 116 102 14 12% AY 1 1
St Mary's Day Nursery 35 27 8 54 50 4 60 55 5 149 132 17 11% AY 1 1
Tiddlywinks Pre-School
0 0 0 8 4 4 24 20 4 32 24 8 25% AY 1
(Bessacarr) Ltd.
Stadium Stars Day Nursery 9 6 3 16 10 6 8 3 5 33 19 14 42% AY 1 1
Little Stars 3 0 3 16 8 8 24 18 6 43 26 17 40% AY 1 1
Toy Box Day Nursery 16 8 8 16 14 2 28 24 4 60 46 14 23% AY 1 1
Cavendish House Private Day
12 6 6 24 12 12 23 13 10 59 31 28 47% AY 1
Nursery
Sticky Mits Childcare Centre 12 5 7 49 20 29 53 32 21 114 57 57 50% AY 1 1 1
Building Blocks Montessori 12 10 2 18 15 3 26 21 5 56 46 10 18% AY 1 1
Hatchell Wood Pre-School 48 34 14 48 34 14 29% TT 1
PVI Totals 123 78 45 221 151 70 366 288 78 710 517 193 27% - 6 10 0 0 2
33 x Childminder 30 23 7 32 23 9 40 28 12 207 140 67 30 7 23 339 221 118 35% - 26 33 12 1 9
All Sector Total 153 101 52 261 181 80 510 401 109 207 140 67 30 7 23 1161 830 331 29% - 32 47 12 1 11
AY (All Year), TT (Term Time Only), SH (School Holidays Only).
The data shows that 29% of places overall remain vacant within the school, PVI and childminder provision. There are childminders
who are available after 6pm and there are provisions that accommodate parents at weekends and on shift patterns
34School Based and PVI Sector Breakfast Childcare Provision
0 to 1 Yrs 2 Yrs 3 & 4 Yrs 5 to 10 Yrs 11 to 14 Yrs Total Availability
VACANY RATE
Shift Patterns
8am to 6pm
Before 8am
NOR (FTE)
NOR (FTE)
NOR (FTE)
NOR (FTE)
NOR (FTE)
NOR (FTE)
Weekends
BALANCE
BALANCE
BALANCE
BALANCE
BALANCE
BALANCE
School & PVI Breakfast
After 6pm
PLACES
PLACES
PLACES
PLACES
PLACES
PLACES
Annual
Provision
Hatchell Wood Primary
5 5 0 25 20 5 30 25 5 17% TT 1
Academy
Lakeside Primary School 10 10 0 20 15 5 30 25 5 17% TT 1 1
Willow Primary School 10 6 4 50 32 18 60 38 22 37% TT 1
School Totals 25 21 4 95 67 28 120 88 32 27% - 1 3 0 0 0
Little Learners Day Nursery 4 3 1 4 3 1 8 6 2 25% TT 1 1
PVI Totals 4 3 1 4 3 1 8 6 2 25% - 1 1 0 0 0
All Sector Total 29 24 5 99 70 29 128 94 34 27% - 2 4 0 0 0
AY (All Year), TT (Term Time Only), SH (School Holidays Only).
The data shows that 27% of places overall remain vacant for School & PVI Breakfast Provision, allowing flexibility for any increase
in requirements. The data also shows that there is availability before 8am.
35School Based and PVI Sector After School Childcare Provision
0 to 1 Yrs 2 Yrs 3 & 4 Yrs 5 to 10 Yrs 11 to 14 Yrs Total Availability
VACANY RATE
Shift Patterns
8am to 6pm
Before 8am
NOR (FTE)
NOR (FTE)
NOR (FTE)
NOR (FTE)
NOR (FTE)
NOR (FTE)
Weekends
BALANCE
BALANCE
BALANCE
BALANCE
BALANCE
BALANCE
School & PVI After School
After 6pm
PLACES
PLACES
PLACES
PLACES
PLACES
PLACES
Annual
Provision
Lakeside Primary School 40 40 0 65 65 0 105 105 0 0% TT 1
Willow Primary School 4 3 1 26 18 8 30 21 9 30% TT 1
School Totals 44 43 1 91 83 8 135 126 9 7% - 0 2 0 0 0
Little Learners Day Nursery 8 7 1 16 15 1 24 22 2 8% TT 1 1
PVI Totals 8 7 1 16 15 1 24 22 2 8% - 0 1 1 0 0
All Sector Total 52 50 2 107 98 9 159 148 11 7% - 0 3 1 0 0
AY (All Year), TT (Term Time Only), SH (School Holidays Only).
The data shows that 7% of places overall remain vacant for the school & PVI. The data also shows that there is availability for most age
groups, and one provision that operates after 6pm.
36School Based and PVI Sector Holiday Childcare Provision
0 to 1 Yrs 2 Yrs 3 & 4 Yrs 5 to 10 Yrs 11 to 14 Yrs Total Availability
VACANY RATE
Shift Patterns
8am to 6pm
Before 8am
NOR (FTE)
NOR (FTE)
NOR (FTE)
NOR (FTE)
NOR (FTE)
NOR (FTE)
Weekends
BALANCE
BALANCE
BALANCE
BALANCE
BALANCE
BALANCE
After 6pm
PLACES
PLACES
PLACES
PLACES
PLACES
PLACES
School & PVI Holiday Provision
Annual
No school holiday provision
School Totals
Little Learners Day Nursery 4 3 1 12 8 4 16 11 5 31% SH 1 1
PVI Totals 4 3 1 12 8 4 16 11 5 31% - 1 1 0 0 0
All Sector Total 4 3 1 12 8 4 16 11 5 31% - 1 1 0 0 0
AY (All Year), TT (Term Time Only), SH (School Holidays Only).
The data shows that holiday provision in this pyramid is very limited over all sectors however, 31% of places are vacant.
375i. Childcare Projections
This table below measures the birth rates of children to anticipate the future projected need for childcare places within this pyramid.
This data shows the anticipated projected place requirements for the spring and summer 2018 terms. This information is displayed
using a red, amber, green (RAG rating)
Green depicts sufficient available places
Amber depicts the potential for a shortfall of places if demand increases
Red shows an identified need where supply does not meet local demand.
Summary of Projected Places Spring 2018
Spring Term 2018 0 and 1 Years 2 Years 3 and 4 Years 5 to 10 Years 11 to 14 Years
Hall Cross Pyramid
Doncaster Total
Hall Cross projections show that there is a potential for a shortfall of places for children aged between 11 to 14 years. This supports
the outcome of the gap analysis where more flexibility in provision is required around childcare provision after 6pm and on
weekends. We will continue to monitor this over the coming terms. On a borough wide basis early indications of birth vs previous
occupancy rates show that there are a sufficient number of places available for all ages in Spring 2018.
Summary of Projected Places Summer 2018
Summer Term 2018 0 and 1 Years 2 Years 3 and 4 Years 5 to 10 Years 11 to 14 Years
Hall Cross Pyramid
Doncaster Total
Hall Cross projections show that there is a potential for a shortfall of places for children aged between 11 to 14 years. This supports
the outcome of the gap analysis where more flexibility in provision is required around childcare provision after 6pm and on
weekends. We will continue to monitor this over the coming terms. On a borough wide basis, early indications of birth vs. previous
occupancy rates show that there are a sufficient number of places available for all ages in summer 2018.
385j. Capital Projects
Below is an overview of Hall Cross pyramid capital projects.
School / Academy Projects Status PVI Sector Projects Status
Atlas Academy - Build of 4 new classrooms Approved N/A
Safeguarding and Access Projects
School Description of Project Status
Atlas Academy Security Fencing (Round 3) Complete
Bessacarr Primary School Safe and secure playground access (Round 2) Complete
Bessacarr Primary School Fire Safety (Round 4) Approved
Hall Cross Academy (Lower Site) Security Fencing (Round 4) Approved
Hall Cross Academy (Upper Site) Security Fencing (Round 4) Complete
Hall Cross Academy (Upper Site) Access Improvements (Round 4) Approved
395k. SEND Provision
This data shows the number of pupils identified as SEND per school, what proportion of the total cohort this represents and their
SEND status.
Number of SEND Education, Health
School Name % of Total Cohort SEN Support
Pupils and Care Plan
Atlas Academy 47 17 1 46
Willow Primary School 41 11 4 37
Bessacarr Primary 39 9 6 33
Lakeside Primary School 47 13 2 45
Hawthorn Primary 37 13 2 35
Hatchell Wood Primary Academy 47 11 8 39
St Peter's Catholic Primary 20 10 0 20
Hall Cross Academy 186 9 22 164
Pyramid Total 464 11 45 419
Doncaster Total 6,544 14% 1,187 5,357
There were a total of 1400 children / young people living in Doncaster with a special educational need or disability aged 0 to
19 years old registered with Together Information Exchange (TIE), at November 2018. This shows an increase of 153
children / young people since 2017.
At October 2018, there were a total of 154 children known to the Pre-School Inclusion Team living in Doncaster with a
special educational need or disability aged 0 to 5 years old, this was an increase of 23 children from the previous year.
At September 2018 there were 70 Ofsted registered group childcare providers and 221 childminders on the Local Authority
Directory registered to provide the free early years entitlement (2, 3 & 4 year old funding). All have to meet the requirements
of the SEN Code of Practice and Disability Discrimination Act requirements. These figures are comparable to the previous
year.
40 A specialist provision for pre-school children with SEND is delivered by the Local Authority (Seedlings). The setting is
registered with Ofsted and offers sessions for funded 2, 3 & 4 year old children.
There were a total of 1,187children educated within schools that accessed support through an Education, Health & Care
Plan. An additional 5,357children had SEN support, as reported at the Autumn Schools Census 2018.
There are five special schools within Doncaster. Three schools offer places from 3 years to 19 years old (North Ridge
Community School, Coppice School and Heatherwood School) and two schools offer places for 7 years to 16 year olds (
Stone Hill School and Pennine View).
Pyramid Name of School Age range Type of provision offered
Adwick North Ridge Community School 3 to 19 Breakfast and After school
Ridgewood Stone Hill School 7 to 16 Breakfast
Conisbrough Pennine View School 7 to 16 No provision
Hatfield Coppice School 3 to 19 After school
Danum Heatherwood School 3 to 19 No provision
A new special school for communication and interaction special educational needs is to be established in Doncaster.
The school will primarily be for children and young people with Autism Spectrum Disorder, specifically high functioning ASD and
Asperger’s. This cohort may also have social, emotional and mental health needs and specific learning difficulties.
Working with the Department for Education, the new school is envisaged to be on the Hungerhill Enterprise Park site. This school
would have places for 100 children and young people, 80 of which would be filled by the council, with the remaining 20 offered to
neighbouring authorities.
The school will be closely associated with another secondary school to enable pupils to access a mainstream curriculum where this
is appropriate. The development will take place as part of the programme creating 1,600 new special free school places across
England, made up of a total of 19 new schools.
415l. Childcare Costs
The average costs are indicated across the different Ofsted registered childcare types in the table below. As the opening times for
day nurseries and childminders can vary, the weekly costs are based on average opening hours of 8am to 6pm. Breakfast and
after-school are grouped within ‘out of school’ costs in line with the Yorkshire and Humber format to allow an easy comparison. This
table shows the average costs of childcare for this pyramid in comparison to borough wide and Yorkshire and Humber averages.
Holiday
Childminder Full Day-care Sessional Care Out of School Childcare P/scheme
Pyramid Average Per Session
Average Average Average Average
Per Day Per Week Per Session Before After Per Day
School School
Hall Cross £31.82 £175.50 £15.00 £8.00 £11.10 £32.50
Doncaster £34.30 £185.98 £13.89 £6.34 £9.38 £29.59
Yorkshire and Humber* £37.97 £204.96 Not Known Not Known £10.96 £26.18
Average childcare costs across the Hall Cross pyramid area indicate:
Childminders costs are lower than the average for Doncaster and Yorkshire & Humber.
Day nurseries (Full Day-care) costs are lower than the average for Doncaster and significantly lower compared to the
Yorkshire & Humber average.
Sessional care costs for Hall Cross are slightly higher than the Doncaster average. There are no Yorkshire and Humber
costs to compare with.
Out of school childcare for before school and after school care is higher than the Doncaster average. There are no costs
to compare with for the Yorkshire & Humber ‘before school childcare’, but after school care is again slightly higher.
The cost of holiday play schemes is significantly higher than both the Doncaster and Yorkshire & Humber averages.
School childcare costs - The range of costs submitted by the schools in this area can vary a great deal therefore we cannot
calculate an average cost as this may not be a true reflection. It is recommended to ascertain the service and actual cost for a
particular school, contact the Doncaster Families Information Service or the school directly.
426. Early Education Funding
6a. 2 Year Old Early Education
Eligibility Criteria
The provision of early education for up to 15 hours per week for eligible 2 year olds starting the term after their 2 nd birthday.
Families must be in receipt of one or more of the following:
Income Support Children are also entitled to a place if:
Income-based Jobseeker’s Allowance (JSA)
Your child is looked after by the local council
Income-related Employment and Support Allowance
Your child has a current statement of special educational
(ESA)
needs (SEN) or an education, health and care plan
Support through Part 6 of the Immigration and Asylum Act
Your family is in receipt of Disability Living Allowance for
Have an annual household income under £16,190 and
the child
claim Child Tax Credit and / or Working Tax Credit
A child who has left care through special guardianship
Guaranteed Element of State Pension Credit
order, child arrangement order or adoption order
The Working Tax Credit 4-week run on (the payment you
get when you stop qualifying for Working Tax Credit)
Universal Credit
2YO Take Up (Borough wide)
Autumn 2017 Spring 2018 Summer 2018
80% 75% 80%
436b. 3 and 4 Year Old Early Education (Universal)
Eligibility Criteria
This is an entitlement for all children starting the term following their third birthday for up to 15 hours per week.
Universal Entitlement Take Up (Borough wide)
Autumn 2017 Spring 2018 Summer 2018
92% 98% 98%
6c. 30 Hours Free Childcare for Eligible 3 and 4 Year Olds
Eligibility Criteria
Eligibility for working parents includes: employed, self-employed and workers on a zero hour’s contract. To take up the 30 hours of
free childcare families need to meet all the following criteria:
Each parent earns less than £100,000 per year
Both parents are working and in a lone parent family the sole parent must work
Each parent works a minimum of 16 hours a week or earns on average a weekly minimum amount that is equivalent to 16
hours a week at either the National Minimum Wage or National Living Wage, for example, £120 a week based on National
Living Wage
There are exceptions to both parents having to work. Families where one parent does not work (or neither parent works) will not
usually be entitled to the 15 hours extended entitlement; however, they will be eligible where:
both parents are employed but one (or both parents) is temporarily away from the workplace on: parental, maternity or
paternity leave; adoption leave; or on statutory sick pay
one parent is employed and one parent:
has substantial caring responsibilities based on specific benefits received for caring
is disabled or incapacitated based on receipt of specific benefits
44Take Up (Borough wide)
Autumn 2017 Spring 2018 Summer 2018
78% 79% 76%
This shows a greater number of children accessed places against those that were identified as potentially eligible; this is due to
mobility from another pyramid.
We have assessed where families who access their additional hours and their home locality, the data can be seen below:
Number Number
Total Number
Home Locality Accessing in Accessing in % of Cohort
Accessing
School PVI
Cantley & Bessacarr 7 83 90 54
Rossington + FTV 0 22 22 13
Central 0 13 13 8
Intake & Belle Vue 0 9 9 5
Wheatley 0 9 9 5
OOA 0 7 7 4
Armthorpe 0 6 6 4
Balby 0 3 3 2
Adwick 0 2 2 1
Denaby & Conisbrough 0 1 1 1
Dunscroft & Hatfield 0 1 1 1
Great North Road 0 1 1 1
Sprotbrough 0 1 1 1
Bentley 0 1 1 1
TOTAL 7 159 166 100
45Home Locality of Families Accessing Additional Hours Within Pyramid
Cantley & Bessacarr
Rossington + FTV
Central
Intake & Belle Vue
Wheatley
OOA
Armthorpe
Balby
Adwick
Denaby & Conisbrough
Dunscoft & Hatfield
Great North Road
Sprotbrough
Bentley
466d. Future Plans
We anticipate an increase in take up over the coming terms. As part of our sufficiency strategy we have applied a methodology to
predict future place needs. The following table shows the pyramid demand by term with potential maximum vs. minimum take up
and any potential shortfall of places. This data is based on the combined need for places for both 30 hours and universal
entitlement.
This information is displayed using a red, amber, green (RAG rating)
Green depicts sufficient available places
Amber depicts the potential for a shortfall of places if demand increases
Red shows an identified need where supply does not meet local demand.
Spring 18 Summer 18
MIN MIN
MAX MAX
Sub Locality Area (Current Universal (Current Universal
(100% Take Up) (100% Take Up)
Take Up) Take Up)
Hall Cross
Doncaster Total
This data shows that Hall Cross pyramid has sufficient places in Spring 2018 with the potential for a shortfall in Summer 2018
should take up reach 100%, however the Doncaster total show a surplus of places for the year ahead.
47You can also read