2020-2021; 2021-2022; 2022-2023 - GEORGE FREEMAN SCHOOL "Building Everyday Heroes!" - Golden Hills School Division
←
→
Page content transcription
If your browser does not render page correctly, please read the page content below
School: 2196 George Freeman School

   GEORGE FREEMAN SCHOOL
        “Building Everyday Heroes!”

Three Year Education Plan
   2020-2021; 2021-2022; 2022-2023
            Wayne Funk – November 2020

                                                                     Page 1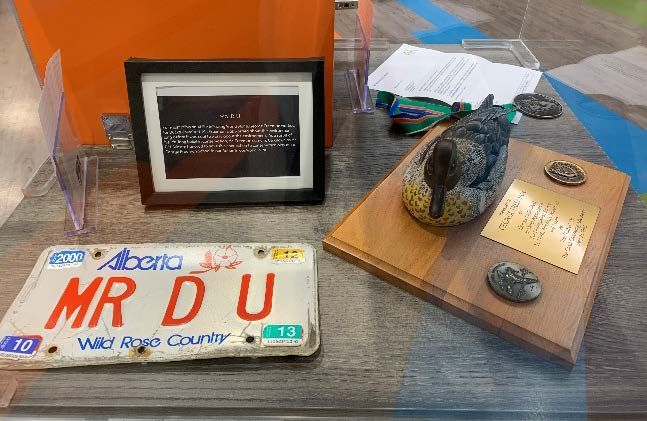
School: 2196 George Freeman School

        3-Year Education Plan for George Freeman School

Message from the Principal

George Freeman School is in our third year of existence in Strathmore, Alberta, and we are committed to being
dedicated to the students, staff, parents and greater community that we serve. With everything that we do; our
focus is on making George Freeman School a great place for our students to learn.

We understand that we have an amazing opportunity to engage with our stakeholders to form and shape our
school’s beliefs, ideals and culture from the very beginning of the school’s opening. This document will serve as
our three year education plan for the 2020/2021, 2021/2022, 2022/2023 school years.

Wayne Funk
Principal
George Freeman School
November 2020

School Profile
George Freeman School has grown to a Kindergarten to Grade 9 school that has a current student population of
380 students. As we move into future years of our existence, we will continue to expand our population to around
450 - 500 students. Our current programs include 1 full time kindergarten class (with part time students added in
on alternating days), two grade 1, one and a half grade 5, two grade 6, 7 and 8 classes. All of the other grades
(grade 2, 3, 4 and 9) are single classes. Additionally, we have a Physical Education program taught by a PE
specialist. Our Kindergarten to grade 5 classrooms are taught by elementary generalist teachers while grade 6,
7, 8 and 9 are taught by subject specialists.

Mission and Vision
As our new school staff was being hired in the spring of 2018, we consciously developed our motto and
three pillars that our school would grow into. It is our desired goal for these words to surround us in all we
do at George Freeman School.

    •   Slogan
             o    Building Everyday Heroes
    •   Pillars
             o    Action in Character
             o    Action in our World
             o    Action in Life

As we move further into the 2020/2021 school year, we will be working with our parents, students and staff
to further develop these pillars and put our ideas into meaningful practice.

                                                                                                          Page 2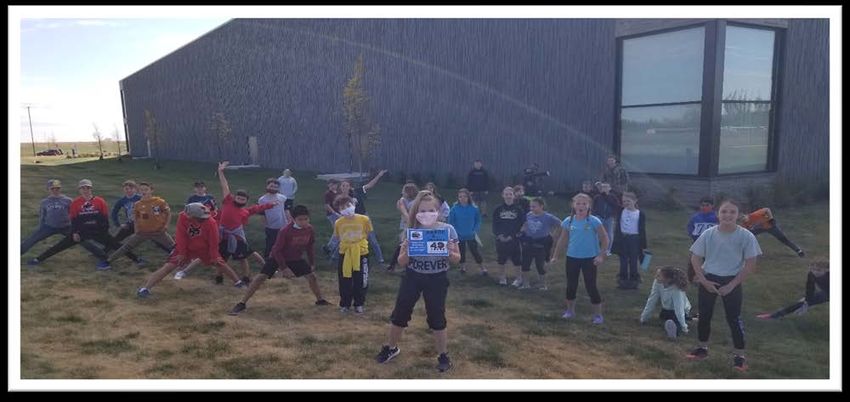
School: 2196 George Freeman School

George Freeman School – Honoring George Freeman
When the family of George Freeman was approached about our school honoring their patriarch with the
name of our school, they were overjoyed and very appreciative. As a result, we have a cachet of artifacts
that have been loaned to George Freeman School that tell a bit of the life story of Mr. Freeman. Last year
we commissioned a local cabinet maker to create some creative display pillars for us to display these
artifacts of Mr. Freeman’s life. Each display pillar follows one of our ideological pillars listed above.

Mr. Freeman was born and raised in Strathmore and lived a long illustrious life here. He was a decorated
World War II veteran and spent many years working as a conservationist for Ducks Unlimited. Mr. Freeman
was a life-long volunteer and connected to the community in a wide variety of ways. We are proud to
consider our school to be a continuation of the works that Mr. Freeman dedicated his life to.

Powerful Learning
Golden Hills School Division continues to be a driving force in the development of teachers who work
together with their students to form and create powerful learning opportunities in their classrooms. At
George Freeman School, we intend to fulfill those expectations with a variety of student learning
opportunities at all grades. Our teachers will build a culture where they can create opportunities for:
    • Students to explore topics of interest
    • Students to connect with experts both locally and further afield
    • Students to demonstrate their understanding in a variety of ways
    • Students to discover their passions

                                                                                                    Page 3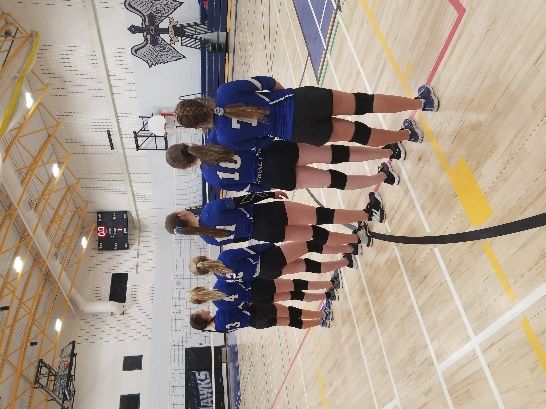
School: 2196 George Freeman School

Career and Technology Foundations
As we began to plan for our school, one of the many things that our older students were excited about was
the variety of course options that we would be providing to our grade 6, 7, 8 and 9 students. After much
research and discussion, the following courses are being offered at GFS for the 2020/2021 school year.
Courses in bold are new to the school this year.

    •   Entrepreneurship                                      •   Indigenous Art
    •   Leadership                                            •   Robotics and Coding
    •   Introductory French                                   •   Outdoor Education
    •   Film Studies                                          •   Drama
    •   Sports Performance                                    •   Drafting and Design
    •   Art and Design                                        •   Environmental Studies

We believe this wide offering of courses is second to none in a school with a total of 180 grade 6, 7, 8 and
9 students.

                                                                                                      Page 4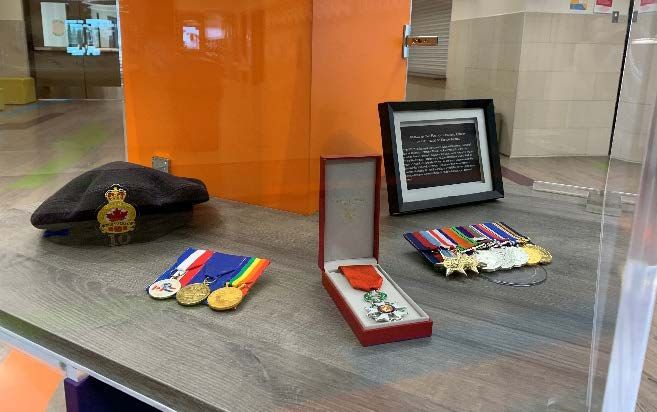
School: 2196 George Freeman School
Intramural Program
During the course of the 2018/2019 school year, every George Freeman student was welcomed to George
Freeman School with a new blue Falcons t-shirt. We purposefully spent the 2018-2019 school year creating
a culture of togetherness. During our third year of operation, in 2020-2021 we are continuing to develop
an intramural program that will create three distinct intramural houses based on the colors of our school
design. The Purple, Green and Orange teams will all show team spirit by competing against the other
houses in athletic events, spirit days and a variety of other activities. Our goal is to create opportunities for
competition that also allow for team building and school spirit.
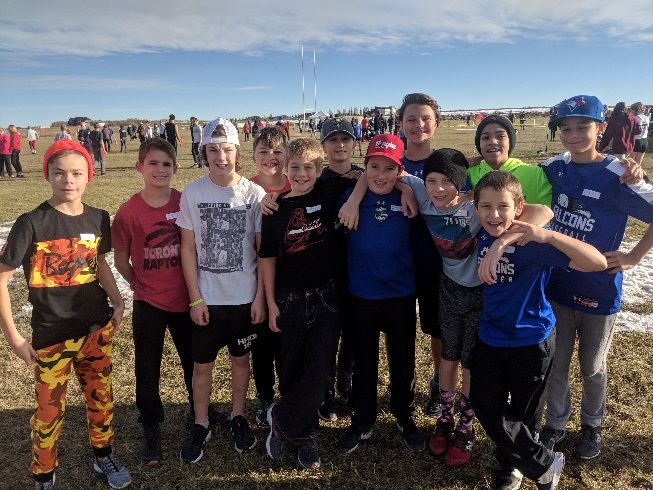
George Freeman School Athletics
Our school intends to sponsor the following Athletic Teams for our students:
• Cross Country (suspended due to the pandemic)
• Boys Volleyball – 3 teams
• Girls Volleyball – 3 teams
• Boys Basketball – 3 teams
• Girls Basketball – 3 teams
• Badminton
• Track and Field
Page 5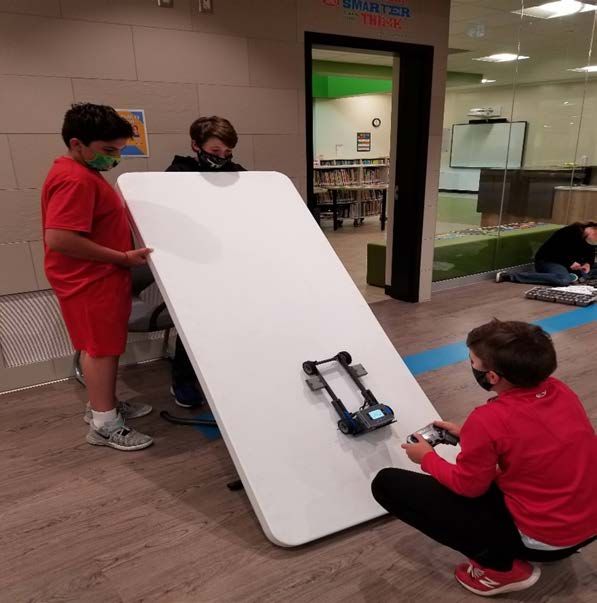
School: 2196 George Freeman School

Student Leadership
One of our greatest strengths is the students that we have in our school. As a result we are in the process
of implementing a student government. During our second semester of the 2020-2021 school year we are
beginning a “Falcon Council” that will enable our student leaders to have a regular impact on the daily
operation of George Freeman School.

George Freeman School Athletic Academies
GFS has a tremendous advantage in that the facility that we share with the Town of Strathmore and the
County of Wheatland, we have an incredible amount of athletic fields and spaces within our building. For
the third consecutive year we will be holding baseball, soccer and fastball academies for our students to
grow in skill development during the course of the school day. We have hired teachers to fulfill the coaching
duties of these academies and our students are excited to grow in skill development in their sport of choice.

Students are welcome to sign up for two academies during the school year. Soccer runs in the late fall and
early winter months while fastball and baseball run during the late winter early spring months. This year
we have over 175 athletes registered into at least one of the academies.

Trends and Issues
As we readied ourselves for the third year of enrolled students, it became apparent that we were the school
of choice for many current Strathmore families. Additionally, many families that were new to Strathmore
chose to bring their children to become Falcons at George Freeman School. Our school grew by 130
students when you compare September 2018 to September 2019. Despite the pandemic, our school grew
by a further 31 students. We predict that we will see another year of substantial growth before the start of
school in September 2021.

As students were enrolling this summer, we realized that we may have some capacity issues in some of
our grades. Many of the graduating grade 6 students within Strathmore are recognizing an additional option
for junior high within Golden Hills School Division in Strathmore. The junior high grades now essentially
become full as we move into this new school year. It will be important in future years to continue to monitor
growth within our community so that certain grades do not become overfull.

                                                                                                       Page 6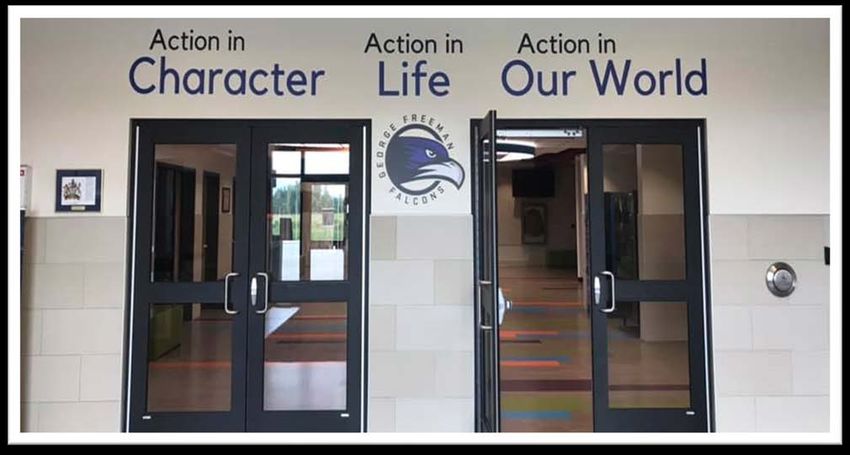
School: 2196 George Freeman School

Facility and Capital
We feel incredibly fortunate to be the staff and students that get to come school in this wonderful building!
With GFS sharing the Strathmore Motor Products Sports Center with the Town of Strathmore, we have
some amazing advantages and exciting opportunities ahead.

Our School Council has been an integral partner in getting our playground built on the south side of the
school. The playground was designed by parents, for students and is easily the top playground in our
community. We are excited to announce that our playground is fully paid for through the tremendous
fundraising efforts of our George Freeman School Council.

Revenues and Expenditures

                      Budgeted Operating Expense 2020-2021
 Allocation (includes prior year         $2,202,755.00                                                                                %
 carry-over)
 Certificated Staffing
 (Substitutes & Certificated                                                    $1,915,490.00                                         87%
 Staffing)
 Non-Certificated                                                               $150,919.00                                           7%
 (Support & Other Staffing)
 Supplies & Services                                                            $136,346.00                                           6%

Combined May 2020 Accountability Pillar Overall Summary

                                                          George Freeman School               Alberta                            Measure Evaluation
   Measure Category                  Measure                        Prev     Prev 3            Prev      Prev 3
                                                         Current                    Current
                                                                    Year      Year             Year       Year    Achievement      Improvement         Overall
                                                         Result                     Result
                                                                   Result   Average           Result    Average
Safe and Caring Schools    Safe and Caring                87.3      92.7     92.7     89.4     89.0      89.2        High             Declined        Acceptable
                           Program of Studies             73.6      68.3     68.3     82.4     82.2      82.0     Intermediate       Maintained       Acceptable
                           Education Quality              92.6      95.1     95.1     90.3     90.2      90.1      Very High         Maintained       Excellent
Student Learning
Opportunities              Drop Out Rate                   n/a      n/a       n/a     2.7       2.6       2.7         n/a               n/a              n/a
                           High School Completion Rate
                                                           n/a      n/a       n/a     79.7     79.1      78.4         n/a               n/a              n/a
                           (3 yr)
Student Learning         PAT: Acceptable                   n/a      93.9     93.9     n/a      73.8      73.6         n/a               n/a              n/a
Achievement (Grades K-9) PAT: Excellence                   n/a      20.5     20.5     n/a      20.6      20.0         n/a               n/a              n/a
                           Diploma: Acceptable             n/a      n/a       n/a     n/a      83.6      83.4         n/a               n/a              n/a
                           Diploma: Excellence             n/a      n/a       n/a     n/a      24.0      23.5         n/a               n/a              n/a
Student Learning
Achievement (Grades 10-    Diploma Exam Participation
                                                           n/a      n/a       n/a     56.4     56.3      55.6         n/a               n/a              n/a
12)                        Rate (4+ Exams)
                           Rutherford Scholarship
                                                           n/a      n/a       n/a     66.6     64.8      63.5         n/a               n/a              n/a
                           Eligibility Rate
                           Transition Rate (6 yr)          n/a      n/a       n/a     60.1     59.0      58.5         n/a               n/a              n/a
Preparation for Lifelong
Learning, World of Work,   Work Preparation               92.3      83.3     83.3     84.1     83.0      82.7      Very High          Improved        Excellent
Citizenship
                           Citizenship                    83.1      89.5     89.5     83.3     82.9      83.2      Very High          Declined          Good
Parental Involvement       Parental Involvement           82.0      79.2     79.2     81.8     81.3      81.2        High            Maintained         Good
Continuous Improvement     School Improvement             79.9      68.6     68.6     81.5     81.0      80.9        High             Improved          Good

                                                                                                                                                          Page 7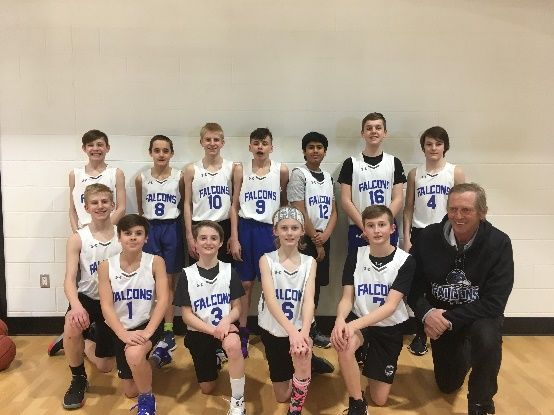
School: 2196 George Freeman School

Measure Evaluation Reference
Achievement Evaluation
Achievement evaluation is based upon a comparison of Current Year data to a set of standards that remain consistent over time. The Standards
are calculated by taking the 3-year average of baseline data for each measure across all school jurisdictions and calculating the 5th, 25th, 75th
and 95th percentiles. Once calculated, these standards remain in place from year to year to allow for consistent planning and evaluation.
The table below shows the range of values defining the 5 achievement evaluation levels for each measure.
Measure                                                    Very Low          Low                Intermediate          High             Very High
Safe and Caring                                            0.00 - 77.62      77.62 - 81.05      81.05 - 84.50         84.50 - 88.03    88.03 - 100.00
Program of Studies                                         0.00 - 66.31      66.31 - 72.65      72.65 - 78.43         78.43 - 81.59    81.59 - 100.00
Education Quality                                          0.00 - 80.94      80.94 - 84.23      84.23 - 87.23         87.23 - 89.60    89.60 - 100.00
Drop Out Rate                                              100.00 - 9.40     9.40 - 6.90        6.90 - 4.27           4.27 - 2.79      2.79 - 0.00
High School Completion Rate (3 yr)                         0.00 - 57.03      57.03 - 62.36      62.36 - 73.88         73.88 - 81.79    81.79 - 100.00
PAT: Acceptable                                            0.00 - 66.07      66.07 - 70.32      70.32 - 79.81         79.81 - 84.64    84.64 - 100.00
PAT: Excellence                                            0.00 - 9.97       9.97 - 13.44       13.44 - 19.56         19.56 - 25.83    25.83 - 100.00
Diploma: Acceptable                                        0.00 - 71.45      71.45 - 78.34      78.34 - 84.76         84.76 - 87.95    87.95 - 100.00
Diploma: Excellence                                        0.00 - 9.55       9.55 - 12.59       12.59 - 19.38         19.38 - 23.20    23.20 - 100.00
Diploma Exam Participation Rate (4+ Exams)                 0.00 - 31.10      31.10 - 44.11      44.11 - 55.78         55.78 - 65.99    65.99 - 100.00
Rutherford Scholarship Eligibility Rate                    0.00 - 47.98      47.98 - 55.78      55.78 - 68.95         68.95 - 74.96    74.96 - 100.00
Transition Rate (6 yr)                                     0.00 - 39.80      39.80 - 46.94      46.94 - 56.15         56.15 - 68.34    68.34 - 100.00
Work Preparation                                           0.00 - 66.92      66.92 - 72.78      72.78 - 77.78         77.78 - 86.13    86.13 - 100.00
Citizenship                                                0.00 - 66.30      66.30 - 71.63      71.63 - 77.50         77.50 - 81.08    81.08 - 100.00
Parental Involvement                                       0.00 - 70.76      70.76 - 74.58      74.58 - 78.50         78.50 - 82.30    82.30 - 100.00
School Improvement                                         0.00 - 65.25      65.25 - 70.85      70.85 - 76.28         76.28 - 80.41    80.41 - 100.00

Notes:
1) For all measures except Drop Out Rate: The range of values at each evaluation level is interpreted as greater than or equal to the lower
   value, and less than the higher value. For the Very High evaluation level, values range from greater than or equal to the lower value to
   100%.
2) Drop Out Rate measure: As "Drop Out Rate" is inverse to most measures (i.e. lower values are "better"), the range of values at each
   evaluation level is interpreted as greater than the lower value and less than or equal to the higher value. For the Very High evaluation level,
   values range from 0% to less than or equal to the higher value.

Improvement Table
For each jurisdiction, improvement evaluation consists of comparing the Current Year result for each measure with the previous three-year
average. A chi-square statistical test is used to determine the significance of the improvement. This test takes into account the size of the
jurisdiction in the calculation to make improvement evaluation fair across jurisdictions of different sizes.
The table below shows the definition of the 5 improvement evaluation levels based upon the chi-square result.
Evaluation Category                               Chi-Square Range
Declined Significantly                            3.84 + (current < previous 3-year average)
Declined                                          1.00 - 3.83 (current < previous 3-year average)
Maintained                                        less than 1.00
Improved                                          1.00 - 3.83 (current > previous 3-year average)
Improved Significantly                            3.84 + (current > previous 3-year average)

Overall Evaluation Table
The overall evaluation combines the Achievement Evaluation and the Improvement Evaluation. The table below illustrates how the
Achievement and Improvement evaluations are combined to get the overall evaluation.
                                          Achievement
Improvement                               Very High           High                 Intermediate                 Low                   Very Low
Improved Significantly                    Excellent           Good                 Good                         Good                  Acceptable
Improved                                  Excellent           Good                 Good                         Acceptable            Issue
Maintained                                Excellent           Good                 Acceptable                   Issue                 Concern
Declined                                  Good                Acceptable           Issue                        Issue                 Concern
Declined Significantly                    Acceptable          Issue                Issue                        Concern               Concern

Category Evaluation
The category evaluation is an average of the Overall Evaluation of the measures that make up the category. For the purpose of the calculation,
consider an Overall Evaluation of Excellent to be 2, Good to be 1, Acceptable to be 0, Issue to be -1, and Concern to be -2. The simple average
(mean) of these values rounded to the nearest integer produces the Category Evaluation value. This is converted back to a colour using the
same scale above (e.g. 2=Excellent, 1=Good, 0=Intermediate, -1=Issue, -2=Concern)

                                                                                                                                                     Page 8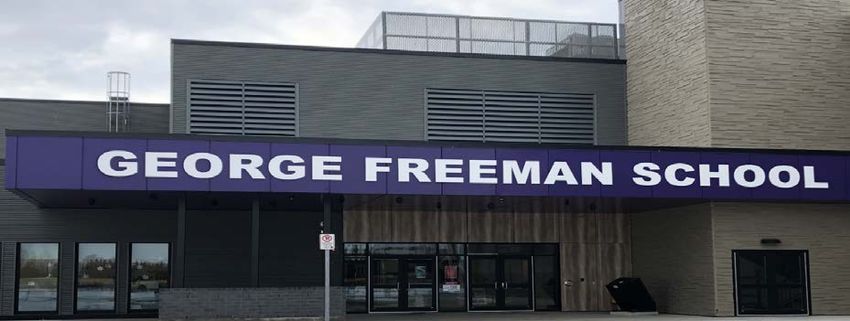
School: 2196 George Freeman School

Outcome One: Alberta’s students are successful
Strategies
Powerful Learning
Teachers at George Freeman School focus on strategic instruction strategies and utilize numerous high-yield teaching
techniques. Staff regularly seek out professional development opportunities through GHSD and other organizations
in order to hone their knowledge and skill. We are proud of the creativity that our teachers display in their planning
and we have seen teacher collaboration develop as teachers seek to expand unique initiatives to other grade levels.
For example, Junior High students spend a portion of their weekly Language Arts time researching and presenting
topics of interest to their peers during Genius Hour. This opportunity for authentic engagement has been seen as
valuable and effective by other educators and younger grades have also started a modified version of Genius Hour.
Another specific example of authentically engaging students and providing opportunities for cross-curricular learning
and building connections with others is the Language Arts 6 and 7 Town program where student writing tasks are all
related to developing a fictional town with social and economic capital. Students write authentic business proposals,
newspaper articles, press releases, and even present court cases as part of this powerful learning experience.

Early Literacy and Early Numeracy Initiatives
Golden Hills School Division provides itinerant teachers to support learners in grades one and two as a way to boost
those students up to grade level expectations. Without this district level support some of our younger learners would
have trouble getting to grade level expectations by the time Provincial Achievement Tests are a reality in grade 6 and
9.

Levelled Literacy
This program allows for more individualized instruction for our young struggling learners. This program boasts smaller
class sizes that reinforce basic literacy strategies. In addition, the leader of these programs connects regularly with
the homeroom teacher to maximize effectiveness of the instructional time.

Collaborative Teacher Opportunities
With the design of our new building, allowing for teacher collaboration opportunities is an obvious administrative
requirement. Each of our grade partner teachers is allotted three common non-assigned duties periods in a 4 day
week. These times naturally allow for the grade partner teachers to plan and discuss high quality learning opportunities
for their students. Each pair of classrooms is outfitted with a barn door to allow for students to migrate back and forth
between the two classrooms. Professional collaboration is an expectation of all of our teaching staff and our building
supports that through the design and construction.

Collaboration is happening between teachers that have similar teaching assignments, as well as across grade/subject
levels. Social studies 7, 8, and 9 teachers have been working together to focus on developing the essential skills
students require to be successful in class. They plan and team teach the skill (ex. Inferencing), then embed the skill
in their course content. Teachers have also collaborated numerous times to provide students opportunities to teach
younger grades, as we know that one strategic instruction strategy is “Teach It!” and our unique grade configuration
provides many opportunities for this.

                                                                                                                   Page 9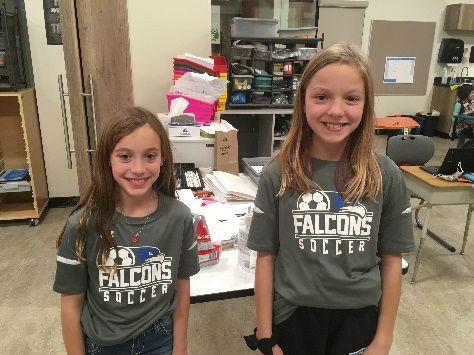
School: 2196 George Freeman School

Outcome One: Alberta’s students are successful (continued)

[No Data for Diploma Exam Results]

                                      Results (in percentages)       Target Evaluation                       Targets
Performance Measure
                                      2014 2015 2016 2017 2018 2019        Achievement Improvement Overall 2020 2021 2022
High School Completion Rate –
Percentage of students who
                                   n/a       n/a   n/a   n/a   n/a         n/a           n/a        n/a
completed high school within three
years of entering Grade 10.
Percentage of students writing four
or more diploma exams within three n/a       n/a   n/a   n/a   n/a         n/a           n/a        n/a
years of entering Grade 10.
Drop Out Rate - annual dropout
                               n/a           n/a   n/a   n/a   n/a         n/a           n/a        n/a
rate of students aged 14 to 18
High school to post-secondary
transition rate of students within six n/a   n/a   n/a   n/a   n/a         n/a           n/a        n/a
years of entering Grade 10.
Percentage of Grade 12 students
eligible   for  a    Rutherford n/a          n/a   n/a   n/a   n/a         n/a           n/a        n/a
Scholarship.

Comment on Results
As we are a kindergarten to grade 9 school for the current year, this set of measures does not apply to our school.

Strategies

                                                                                                                       Page 10
School: 2196 George Freeman School
Outcome One: Alberta’s students are successful (continued)
Results (in percentages) Target Evaluation Targets
Performance Measure
2016 2017 2018 2019 2020 2020 Achievement Improvement Overall 2021 2022 2023
Percentage of teachers, parents
and students who are satisfied that
n/a n/a n/a 89.5 83.1 90.0 Very High Declined n/a 90.0 92.0 94.0
students model the characteristics
of active citizenship.
Comment on Results
This is another strong result for our school. We feel that our continued work with our student population on our three pillars
has enabled us to put the characteristics of active citizenship at the forefront of our work with students. As our school culture
continues to grow and develop, we fell that this measure should continue to be a strong one for George Freeman School.
Strategies
George Freeman
Our namesake was a lifelong resident of Strathmore who gave his life to volunteerism in our community. When Mr.
Freeman returned to Strathmore as a decorated veteran following the conclusion of World War II he began to work for
Ducks Unlimited while raising his young family. Throughout the years he volunteered for the Strathmore Volunteer
Fire Department, was an integral member in planning the Strathmore Rodeo weekend and was always a loyal and
involved member of the Strathmore Legion. Anybody growing up in Strathmore will have memories of Mr. Freeman
speaking at their annual school Remembrance Day Ceremony. As a result of all of this volunteering, Mr. Freeman
was twice voted as Strathmore’s citizen of the year. We are proud to have George Freeman as our namesake as we
strive to “Build Everyday Heroes”.
Motto and Pillars
Modelling our school after Mr. Freeman, we have chosen “Building Everyday Heroes” as our motto for the school.
Using the life of Mr. Freeman we have decided to build our school philosophy around the following three pillars.
• Action in Life
o Fitness and Sport
o Health and Wellness
• Action in Character
o Acceptance
o Support of Others
o Teamwork
• Action in our World
o Environmental Stewardship
o Volunteering
o Citizenship
o Impacting our Local and Global Community
We strive as a staff to use this language in the majority of our student interactions both individually and in our classes.
Active Citizenship
This is developed through projects that allow students to recognize that there are problems within our community and
world and to work towards helping to resolve these problems. Organizing activities that bring community members
into the school and having students going out to work with community members also develops a sense of community
and commitment to our town. Some of these opportunities include:
• Students participate in the Terry Fox run to raise funds for cancer research,
• Grades 6 - 9 students raise money through “Entrepreneurship” to donate to a charity of their choice (e.g.,
Strathmore Crisis Shelter and Ronald McDonald House).
• Our Grade 2 class organizes and participates in a weekly Walk and Read club with local seniors. Students
and Seniors take turns reading and walking on the track.
• To learn the importance of “giving back” to one’s community and to develop a sense of gratitude for all the
support volunteers provide to the school, students perform at a thank you tea put on for parents and school
volunteers.
• Junior High CTF Course – Connecting and Contributing to the Community – provides students the opportunity
to learn more about their community and develop and implement their ideas to make it an even better place.
Page 11School: 2196 George Freeman School
Roots of Empathy
Every year our grade 5 students are given the opportunity to participate in the Roots of Empathy program. In this
program, a new baby and mother are part of a classroom for the year. Monthly visits with the baby highlight many
factors that affect the baby during the months of most extreme development. Additionally, the instructor of the Roots
of Empathy program holds weekly classes that include conversations and dialogue about the growth and development
of a helpless baby into a toddler.
Page 12School: 2196 George Freeman School
Outcome Two: First Nations, Métis, and Inuit students in Alberta are
successful
(Results and evaluations for First Nations, Métis and Inuit measures are required for
Public/Separate/Francophone schools only)
Results (in percentages) Target Evaluation Targets
Performance Measure
2015 2016 2017 2018 2019 2019 Achievement Improvement Overall 2020 2021 2022
Overall percentage of self-identified
FNMI students in Grades 6 and 9
who achieved the acceptable 90.0 85.0 85.0 85.0
n/a n/a n/a n/a * * * *
standard on Provincial
Achievement Tests (overall cohort
results).
Overall percentage of self-identified
FNMI students in Grades 6 and 9
who achieved the standard of 20.0 20.0 20.0 20.0
n/a n/a n/a n/a * * * *
excellence on Provincial
Achievement Tests (overall cohort
results).
Overall percentage of self-identified
FNMI students who achieved the
n/a n/a n/a n/a n/a n/a n/a n/a
acceptable standard on diploma NA NA NA NA
examinations (overall results).
Overall percentage of self-identified
FNMI students who achieved the
n/a n/a n/a n/a n/a n/a n/a n/a
standard of excellence on diploma NA NA NA NA
examinations (overall results).
Comment on Results
As our student population has very few First Nations/Metis/Inuit students who self-identify, we have no PAT data to support
our goals. As a Kindergarten to grade 9 school we have no students who are writing diploma exams.
Strategies
The same strategies that are mentioned earlier in this report (Outcome 1; page 7) are evident on a daily basis for all
of our students. Any student that self-identifies as First Nations/Metis/Inuit will have easy access to any of the
programs and initiatives that would support greater academic growth and achievement.
Staff members have made an effort to seek out opportunities to develop their understanding of indigenous history and
culture, as well as engage with indigenous community members and provide indigenous educational opportunities to
all students.
Page 13School: 2196 George Freeman School
Outcome Two: First Nations, Métis, and Inuit students in Alberta are successful (continued)
Results (in percentages) Target Evaluation Targets
Performance Measure
2014 2015 2016 2017 2018 2019 Achievement Improvement Overall 2020 2021 2022
High School Completion Rate –
Percentage of self-identified FNMI
students who completed high n/a n/a n/a n/a n/a n/a n/a n/a
school within three years of
entering Grade 10.
Percentage of self-identified FNMI
students writing four or more
n/a n/a n/a n/a n/a n/a n/a n/a
diploma exams within three years
of entering Grade 10.
Drop Out Rate - annual dropout
rate of self-identified FNMI students n/a n/a n/a n/a n/a n/a n/a n/a
aged 14 to 18
High school to post-secondary
transition rate of self-identified
n/a n/a n/a n/a n/a n/a n/a n/a
FNMI students within six years of
entering Grade 10.
Percentage of Grade 12 self-
identified FNMI students eligible for n/a n/a n/a n/a n/a n/a n/a n/a
a Rutherford Scholarship.
Comment on Results
As we are a Kindergarten to grade 9 school currently, this set of measures does not apply to our school.
Page 14School: 2196 George Freeman School
Outcome Three: Alberta has excellent teachers, school leaders, and school
authority leaders
Results (in percentages) Target Evaluation Targets
Performance Measure
2016 2017 2018 2019 2020 2020 Achievement Improvement Overall 2021 2022 2023
Percentage of teachers, parents
and students satisfied with the
opportunity for students to receive a
n/a n/a n/a 68.3 73.6 90.0 Intermediate Improved n/a 90.0 90.0 90.0
broad program of studies including
fine arts, career, technology, and
health and physical education.
Comment on Results
As our school continues to grow into our third year, this is an area of growth that we have identified. We are not happy or
satisfied with this result and we will continue to strive to offer a variety of programming options to our students.
Strategies
Grade 6 – 9
• For our older students we do offer a variety of CTF courses for our students to choose from.
o All grade 6 students take French, Indigenous Art, Outdoor Education and Robotics
o Grade 7 students all take Sports Performance, French, Drama, Art, Robotics, Entrepreneurship,
Music History and Outdoor Education
o Grade 8 students all take Indigenous Art, Film Studies, Robotics, Sports Performance, Travel and
Communication Studies.
o Grade 9 students all take Leadership, Sports Performance, Fitness, Entrepreneurship, Indigenous
Art, Drafting and Design and Environmental Studies
• As well, all students take part in our regular Physical Education classes which are taught by a PE specialist.
• We also run three different sports skills academies. These academies are skill based and offer skill sessions
with similarly skilled peers during the course of the school day for a 16 one hour sessions. These skill session
are taught by a certified teacher who has a singular level of expertise regarding the specific sport.
o Soccer – grade 2 to grade 9 students are eligible. Sessions runs every Tuesday and Thursday from
early October through early December.
o Baseball – grade 4 to grade 9 students are eligible. Sessions run every Tuesday and Thursday
from early February through mid April.
o Fastball – grade 4 to grade 9 students are eligible. Sessions run every Monday and Wednesday
from early February through mid April
Kindergarten to Grade 5
• Students in kindergarten through grade 5 have regular Physical Education classes taught by our PE expert.
• Classroom teachers work collaboratively to teach the Fine Arts with a teaching partner or through grade
buddies.
• Students in grade 2 through grade 5 are eligible to participate in our sports skills academies. Please see the
notes directly above.
Areas for Growth
• We are using our George Freeman School Council as a sounding board for further improvements to our
program offerings. So far the parents have identified two areas they would like to see us working to include
in our school programming for the 2020-2021 school year.
o Second Language
o Fine Arts
• We will also petition our student population regarding alternate programming options to include in future
years.
Page 15School: 2196 George Freeman School
Outcome Four: Alberta’s education system is well governed and managed
Results (in percentages) Target Evaluation Targets
Performance Measure
2016 2017 2018 2019 2020 2020 Achievement Improvement Overall 2021 2022 2023
Percentage of teacher, parent and
student agreement that: students
are safe at school, are learning the
n/a n/a n/a 92.7 87.3 90.0 High Maintained n/a 90.0 92.0 94.0
importance of caring for others, are
learning respect for others and are
treated fairly in school.
Percentage of teachers, parents
and students satisfied with the n/a n/a n/a 95.1 92.6 92.0 Very High Maintained n/a 92.0 93.0 94.0
overall quality of basic education.
Percentage of teachers and
parents who agree that students
are taught attitudes and
n/a n/a n/a 83.3 92.3 90.0 Very High Improved n/a 90.0 92.0 94.0
behaviours that will make them
successful at work when they
finish school.
Percentage of teacher and parent
satisfaction that students
demonstrate the knowledge, skills
and attitudes necessary for lifelong
n/a n/a n/a 56.7 67.2 80.0 n/a n/a n/a 80.0 85.0 88.0
learning.(This measure is required
for charter and private school
authorities that do not have grades
10-12.)
Percentage of teachers and
parents satisfied with parental
n/a n/a n/a 79.2 82.0 85.0 High Improved n/a 85.0 87.0 89.0
involvement in decisions about
their child's education.
Percentage of teachers, parents
and students indicating that their
school and schools in their Improved
n/a n/a n/a 68.6 79.9 90.0 High n/a 90.0 92.0 94.0
jurisdiction have improved or Significantly
stayed the same the last three
years.
Comment on Results
Once again, we are very pleased with this set of results. It is clear to us that our students, parents and staff believe we are
working to “Build Everyday Heroes” here at George Freeman School. While we will continue to strive to get better each and
every year, our school is already a great school to be a part of.
Strategies
Parent Engagement
To make sure that our parents are engaged and involved at the school, we provide multiple opportunities for them to
give input and hear directly from the administrative and teaching staff at George Freeman School. Some of our
strategies are listed below:
• Continue asking parents for input in regards to their own children’s Individual Program Plan and Individual
Support Plan.
• Continue the very effective relationship we have with our School Council. We hold monthly evening meetings
each year and ask for guidance and support in building planning documents, determining budgets and
making effective programming decisions.
• Continue to communicate regularly with parents through a variety of Social Media (Instagram, Facebook and
Twitter) while still providing regular classroom emails. Every six weeks, a message from the office comes
home to parents through School Messenger and relays many opportunities for connection with the school
administration.
• To provide for our students and families a hard cover yearbook that will capture the highlights of the school
year.
• Each year through our school council and during staff meetings parents and staff are strongly encouraged to
communicate with the administration to reflect on possible improvements that our school can make.
• Work on developing a Student Government that meets regularly and has a direct line of communication to
the school administration.
Page 16School: 2196 George Freeman School
• George Freeman School Council is asked many times a year to reflect on educational practices happening at
George Freeman School. This process allows for parents to question practices and praise positives which provides
for an overall positive feeling of the educational practices at George Freeman School.
• Teaching staff are always able to make decisions regarding the programs and options available at George
Freeman School. These decisions take place during monthly staff meetings, and at our yearly planning
session in May.
School Growth and Change
As our school continues through the first few years of existence, it is important to remember that even though we have
a fabulous building, our main goal is to provide the best possible education to our students. We will continue to work
hard to have our school grow and change with advice and input from parents, students and Golden Hills School
Division staff.
Page 17School: 2196 George Freeman School
APPENDIX – Measure Details (OPTIONAL)
The following pages include tables and graphs that provide detailed data for the performance measures. Schools may include
these under each measure/outcome to provide context and help in interpreting the results.
Program of Studies – Measure Details
Percentage of teachers, parents and students satisfied with the opportunity for students to receive a broad program of studies
including fine arts, career, technology, and health and physical education.
School Authority Province
2016 2017 2018 2019 2020 2016 2017 2018 2019 2020 2016 2017 2018 2019 2020
Overall n/a n/a n/a 68.3 73.6 79.6 81.1 79.0 81.0 81.2 81.9 81.9 81.8 82.2 82.4
Teacher n/a n/a n/a 71.8 93.7 84.5 87.8 88.0 85.7 89.7 88.1 88.0 88.4 89.1 89.3
Parent n/a n/a n/a 64.7 60.9 77.3 77.7 76.0 79.2 75.4 80.1 80.1 79.9 80.1 80.1
Student n/a n/a n/a 68.4 66.2 77.1 77.7 73.1 78.2 78.4 77.5 77.7 77.2 77.4 77.8
Graph of Overall Authority Results Graph of Detailed Authority Results
Notes:
1. Data values have been suppressed where the number of respondents/students is fewer than 6. Suppression is marked with an asterisk (*).
2. Student participation in the survey was impacted between 2014 and 2017 due to the number of students responding through the
OurSCHOOL/TTFM (Tell Them From Me) survey tool.
Page 18School: 2196 George Freeman School
Parental Involvement – Measure Details
Percentage of teachers and parents satisfied with parental involvement in decisions about their child's education.
School Authority Province
2016 2017 2018 2019 2020 2016 2017 2018 2019 2020 2016 2017 2018 2019 2020
Overall n/a n/a n/a 79.2 82.0 80.3 84.4 81.6 82.5 80.5 80.9 81.2 81.2 81.3 81.8
Teacher n/a n/a n/a 98.2 97.8 87.8 91.5 90.0 92.1 90.2 88.4 88.5 88.9 89.0 89.6
Parent n/a n/a n/a 60.3 66.2 72.8 77.3 73.1 72.8 70.7 73.5 73.9 73.4 73.6 73.9
Graph of Overall Authority Results Graph of Detailed Authority Results
Notes:
1. Data values have been suppressed where the number of respondents/students is fewer than 6. Suppression is marked with an asterisk (*).
Education Quality – Measure Details
Percentage of teachers, parents and students satisfied with the overall quality of basic education.
School Authority Province
2016 2017 2018 2019 2020 2016 2017 2018 2019 2020 2016 2017 2018 2019 2020
Overall n/a n/a n/a 95.1 92.6 92.1 92.4 92.0 92.1 91.4 90.1 90.1 90.0 90.2 90.3
Teacher n/a n/a n/a 100.0 100.0 98.0 98.3 97.8 98.1 97.8 96.0 95.9 95.8 96.1 96.4
Parent n/a n/a n/a 89.2 87.4 87.9 88.4 87.8 88.7 86.6 86.1 86.4 86.0 86.4 86.7
Student n/a n/a n/a 96.0 90.5 90.5 90.5 90.3 89.6 89.8 88.0 88.1 88.2 88.1 87.8
Graph of Overall Authority Results Graph of Detailed Authority Results
Notes:
1. Data values have been suppressed where the number of respondents/students is fewer than 6. Suppression is marked with an asterisk (*).
2. Student participation in the survey was impacted between 2014 and 2017 due to the number of students responding through the
OurSCHOOL/TTFM (Tell Them From Me) survey tool.
Page 19School: 2196 George Freeman School
Safe and Caring – Measure Details
Percentage of teacher, parent and student agreement that: students are safe at school, are learning the importance of caring for
others, are learning respect for others and are treated fairly in school.
School Authority Province
2016 2017 2018 2019 2020 2016 2017 2018 2019 2020 2016 2017 2018 2019 2020
Overall n/a n/a n/a 92.7 87.3 90.9 91.2 90.6 90.6 90.0 89.5 89.5 89.0 89.0 89.4
Teacher n/a n/a n/a 100.0 98.9 96.7 96.9 97.5 96.8 96.9 95.4 95.3 95.0 95.1 95.3
Parent n/a n/a n/a 88.6 80.0 89.2 90.3 89.8 91.5 87.7 89.8 89.9 89.4 89.7 90.2
Student n/a n/a n/a 89.6 82.9 86.8 86.5 84.6 83.6 85.5 83.4 83.3 82.5 82.3 82.6
Graph of Overall Authority Results Graph of Detailed Authority Results
Notes:
1. Data values have been suppressed where the number of respondents/students is fewer than 6. Suppression is marked with an asterisk (*).
2. Student participation in the survey was impacted between 2014 and 2017 due to the number of students responding through the OurSCHOOL/TTFM (Tell
Them From Me) survey tool.
School Improvement – Measure Details
Percentage of teachers, parents and students indicating that their school and schools in their jurisdiction have improved or stayed
the same the last three years.
School Authority Province
2016 2017 2018 2019 2020 2016 2017 2018 2019 2020 2016 2017 2018 2019 2020
Overall n/a n/a n/a 68.6 79.9 86.3 88.0 83.0 84.7 84.3 81.2 81.4 80.3 81.0 81.5
Teacher n/a n/a n/a 50.0 76.5 90.3 88.5 86.2 85.5 90.1 82.3 82.2 81.5 83.4 85.0
Parent n/a n/a n/a 61.5 68.8 81.7 88.5 79.3 84.0 77.5 79.7 80.8 79.3 80.3 80.0
Student n/a n/a n/a 94.2 94.5 86.8 86.9 83.4 84.4 85.4 81.5 81.1 80.2 79.4 79.6
Graph of Overall Authority Results Graph of Detailed Authority Results
Notes:
1. Data values have been suppressed where the number of respondents/students is fewer than 6. Suppression is marked with an asterisk (*).
2. Student participation in the survey was impacted between 2014 and 2017 due to the number of students responding through the
OurSCHOOL/TTFM (Tell Them From Me) survey tool.
Page 20School: 2196 George Freeman School
School Improvement – Measure Details
Percentage of teachers, parents and students indicating that their school and schools in their jurisdiction have improved or stayed
the same the last three years.
School Authority Province
2016 2017 2018 2019 2020 2016 2017 2018 2019 2020 2016 2017 2018 2019 2020
Overall n/a n/a n/a 68.6 79.9 86.3 88.0 83.0 84.7 84.3 81.2 81.4 80.3 81.0 81.5
Teacher n/a n/a n/a 50.0 76.5 90.3 88.5 86.2 85.5 90.1 82.3 82.2 81.5 83.4 85.0
Parent n/a n/a n/a 61.5 68.8 81.7 88.5 79.3 84.0 77.5 79.7 80.8 79.3 80.3 80.0
Student n/a n/a n/a 94.2 94.5 86.8 86.9 83.4 84.4 85.4 81.5 81.1 80.2 79.4 79.6
Graph of Overall Authority Results Graph of Detailed Authority Results
Notes:
3. Data values have been suppressed where the number of respondents/students is fewer than 6. Suppression is marked with an asterisk (*).
4. Student participation in the survey was impacted between 2014 and 2017 due to the number of students responding through the
OurSCHOOL/TTFM (Tell Them From Me) survey tool.
Page 21You can also read