RCL FOODS LIMITED (formerly Rainbow Chicken Limited) - Audited Results for the Year Ended 30 June 2013
←
→
Page content transcription
If your browser does not render page correctly, please read the page content below

RCL FOODS LIMITED
         (formerly Rainbow Chicken Limited)

Audited Results for the Year Ended 30 June 2013
     Investor Presentation: 28 August 2013
Agenda

      2013
                              Ambition
 Salient features                                        Financial                        Key
                            and strategic
       and                                                review                    financial issues
                              priorities
results summary

  Operational
                             Dividends                   Prospects                     Appendices
    review

             This presentation covers the results for the 12 month period to June 2013

Name changed to RCL Foods Limited from Rainbow Chicken Limited with effect from 26 August 2013

         JSE share code will change from RBW to RCL with effect from 2 September 2013

                                                           AUDITED RESULTS FOR THE YEAR ENDED 30 JUNE 2013   2
2013 salient features

Group revenue increased 28.7% to R10.1bn

Headline EBITDA lower by 27.4% to R446.2m

Headline EBITDA margin decreased to 4.4% from 7.8%

Headline earnings from continuing operations down 93.2% to R18.1m

Cash generated from operations increased 32.2% to R669.3m

Fully underwritten R3.9bn equity raising concluded in March 2013

Foodcorp acquisition finalised and synergies being pursued

Partnership with Zambeef provides entry into Zambian poultry market

                                                      AUDITED RESULTS FOR THE YEAR ENDED 30 JUNE 2013   3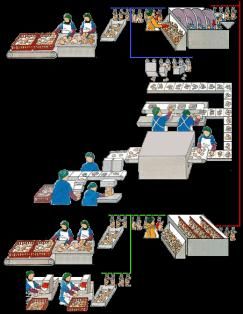
2013 results summary
Revenues: 28.7% Headline EBITDA: 27.4%
ZARm ZARm
8.9% Margin %
9.6% 7.8%
4.4%
6 953 8 621 7 855 10 109 671.5 769.5 614.9 446.2
2010 2011* 2012 2013 2010 2011* 2012 2013
Headline earnings : 93.2% Cash generated from operations: 32.2%
ZARm ZARm
351.5 388.8 267.1 18.1 526 643 506 669
2010 2011* 2012 2013 2010 2011* 2012 2013
* 15 month period
AUDITED RESULTS FOR THE YEAR ENDED 30 JUNE 2013 4Agenda
2013
Ambition
Salient features Financial Key
and strategic
and review financial issues
priorities
results summary
Operational
Dividends Prospects Appendices
review
AMBITION:
RCL Foods seeks to be a diversified food business
with compelling consumer brands in sub-Saharan Africa
AUDITED RESULTS FOR THE YEAR ENDED 30 JUNE 2013 5Group’s current operations
RCL FOODS LIMITED
Market capitalisation: +R10bn
100% 100% 64.2% 49%/51%
• South Africa’s largest • Specialised 3rd party • Leading South African • Acquired 49% of
processor and marketer of logistics and sales service manufacturer of a Zambeef’s interest in Zam
chicken provider for frozen, chilled diversified portfolio of Chick
• Fully integrated operation and ambient goods quality branded and • Proposed investment in a
• Operates in the local • Integrated logistics and private label food products new hatchery (Zamhatch)
retail, wholesale and sales services to retail, • Market leader in five in which RCL Foods holds
foodservice channels wholesale and food product categories a 51% interest
• Added value focus service sectors, including:
Primary warehousing &
distribution (bulk), secondary
warehousing & distribution
(break-bulk), sales and
merchandising, supply chain &
credit management
‘One company’ focus
AUDITED RESULTS FOR THE YEAR ENDED 30 JUNE 2013 6Strategic priorities
Why Foodcorp? How does RCL Foods create value?
• Food business of scale • Accelerating growth in South Africa and
broader sub-Saharan African region
– R8bn annualised turnover
• Leveraging Vector’s logistics and sales
• Strong brands
expertise
• Innovative
• Leveraging scale and expertise to compete
• Strongly cash generative more effectively
• Talented team • Combine strengths in consumer insight
between the organisations to support
• Cultural fit product innovation and development
AUDITED RESULTS FOR THE YEAR ENDED 30 JUNE 2013 7Strategic priorities
Strategic partnership formed with Zambeef
• Zambeef is a major ‘player’ in the Zambian agri-business (listed in London and Lusaka)
• Established track record in Zambia, operations in Ghana and Nigeria as well
• RCL acquired 49% of Zam Chick from Zambeef for R129m (US$14.25m)
• Zam Chick is Zambeef’s chicken broiler business
• Zambeef will manage day-to-day operations, RCL provides technical assistance and guidance
• Proposed investment in new hatchery (51% RCL and 49% Zambeef) that will be operational in
two to three years
• Financial results to be consolidated into RCL Foods from 2014 financial year
RCL’s sub-Saharan strategy demands a longer-term ‘mind-set’
• Investment is an imperative to realise growth strategy
AUDITED RESULTS FOR THE YEAR ENDED 30 JUNE 2013 8Agenda
2013
Ambition
Salient features Financial Key
and strategic
and review financial issues
priorities
results summary
Operational
Dividends Prospects Appendices
review
AUDITED RESULTS FOR THE YEAR ENDED 30 JUNE 2013 9Financial review
2013 2012
Revenue Rm 10 108.8 7 855.1
Headline EBITDA Rm 446.2 614.9
Headline EBIT Rm 167.9 414.7
Effective tax rate % 113.5 35.0
Headline earnings continuing operations Rm 18.1 267.1
Cash generated by operations Rm 669.3 506.4
Net cash and investment in money market Rm 2 763.2 305.8
Dividend per share Cents 60.0
Headline earnings per share continuing operations Cents 4.6 88.4
Capex Spend Rm 485.9 481.0
NAV per share Cents 1 228.8 985.2
Return on equity % 0.5 9.3
AUDITED RESULTS FOR THE YEAR ENDED 30 JUNE 2013 10Financial review summary
Rm 446.2
• Funding costs impacted
53.9 by Foodcorp acquisition
25.1 18.1
• Effective tax rate of
113.5% due to non-
(75.1) deductible transaction
(153.7) costs, non-allowance of
(278.3) certain costs and foreign
exchange losses
HEBITDA
Depreciation and
Finance cost
Finance income
Taxation
continuing operations
Headline earnings from
Minority interestfrom
continuing operations
(within Foodcorp)
amortisation
• Finance cost includes
non cash flow fair value
adjustments to Euro debt
AUDITED RESULTS FOR THE YEAR ENDED 30 JUNE 2013 11Financial review: 2013 operating results summary
Three operating segments: Rainbow, Vector and Foodcorp
Revenue (Rm) 2013 2012
Rainbow 8 144 7 197
Vector 1 477 1 340
Foodcorp (two months) 1 218 n/a
Sales between Segments – Vector to Rainbow (726) (682)
Sales between Segments – Vector to Foodcorp (4) n/a
Total 10 109 7 855
Operating profit (R’000) 2013 2012
Rainbow (3 680) 245 487
Vector 143 303 168 737
Foodcorp (two months) 99 010 n/a
Unallocated group costs (72 606) n/a
Total 166 027 414 224
AUDITED RESULTS FOR THE YEAR ENDED 30 JUNE 2013 12Financial review
General operating environment
• Global economic slowdown continues to impact negatively
• Weak consumer demand
• Labour unrest
• Above inflation cost increases (power/fuel)
• Volatile exchange rate and commodity markets
AUDITED RESULTS FOR THE YEAR ENDED 30 JUNE 2013 13Financial review
Rainbow results affected by high import volumes, ‘dumping’ and
record feed input costs
• Value added products delivered acceptable performance
• Individual Quick Frozen products sold at below cost for most of the year
Vector contribution lower due to investment in additional capacity
• Slowdown in volume in H2 also had an effect
• Principal Secondary Distribution business reporting subdued growth
• Costs managed within inflation, despite above inflation fuel and electricity increases
Foodcorp delivered revenue of R1.2bn and operating profit of R99m
(two months only)
• Earnings compromised due to R71m adjustment on Euro bonds, PIK notes and derivatives
as a result of ZAR/Euro exchange rate deterioration
• Tough trading conditions and constrained consumer spending
AUDITED RESULTS FOR THE YEAR ENDED 30 JUNE 2013 14Financial review
Cash flow summary
Rm
Opening balance 305.8 • Working capital levels
continue to be well
Operating profit adjusted for non-cash flow items 516.8
managed
Working capital changes 152.5
• Cash generated by
Net finance income 43.4
operations increased by
Tax paid (61.0) R163m to R669.3m
Dividends paid (94.4)
• Closing balance includes
Capital expenditure (including intangibles) (485.9) R450m money market
Acquisition of subsidiary and joint venture (875.9) investments
Issue of shares 3 881.0
Interest- bearing liabilities (715.3)
Discontinued operation-Net cash inflows 52.4
Other 43.8
Closing balance 2 763.2
AUDITED RESULTS FOR THE YEAR ENDED 30 JUNE 2013 15Financial review
Working capital movement
• The Foodcorp acquisition
600 has had a significant
impact on the Group’s
statement of financial
500
position
214.9
400 • IFRS 3 (Business
combinations) requires
recognition of net assets
300 95.4 160.7
acquired at fair value:
resulted in assets and
200 (242.2) liabilities acquired on 1
(138.3) (117.3) May 2013 amounting to
R6.6bn and R7.8bn
100
respectively
(104.9) (88.1) 109.1
0 • The statement of financial
FY 2011* FY 2012 FY 2013 position reflects an
increase in working capital
Trade receivables Inventory & Biological Assets Trade payables balances due to the scale
of the Foodcorp business
* 15 Month period
AUDITED RESULTS FOR THE YEAR ENDED 30 JUNE 2013 16Financial review
RCL Foods’ capital expenditure programme maintained at 2012 level
Rm 2013 2012
Expansion 187.8 175.5
Maintenance 298.1 305.5
Total expenditure 485.9 481.0
Main on-going projects during 2013
• Rustenburg and Bushvalley expansions R137.0m
• Additional freezing and chilling capacity in Worcester R44.2m
• Energy saving - Conversion of chicken house heating from gas to coal R71.8m
• No new expansion capex approved in 2013
AUDITED RESULTS FOR THE YEAR ENDED 30 JUNE 2013 17Agenda
2013
Ambition
Salient features Financial Key
and strategic
and review financial issues
priorities
results summary
Operational
Dividends Prospects Appendices
review
AUDITED RESULTS FOR THE YEAR ENDED 30 JUNE 2013 18Key financial issues
Assessment of impairment
• Rainbow and RCL Foods’ Boards have considered the need for an impairment of assets
– In view of losses being incurred in Rainbow (IAS 36 - Impairment of assets)
• Boards decided it is inappropriate to impair poultry assets at this stage
– Outcome of the application for anti-dumping protection will first be considered
• If there is no notable improvement in operating margins within the next 12 months, an
impairment of assets will become necessary
Purchase price allocation (PPA)
• Foodcorp acquisition had a significant impact on statement of financial position
– IFRS 3 requiring recognition of net assets acquired at fair value
– Resulted in assets and liabilities acquired amounting to R6.6bn and R7.8bn respectively
• Purchase price of the acquisition was R1bn
– Resulting in goodwill of R2.6bn being recognised after the completion of a preliminary PPA exercise
AUDITED RESULTS FOR THE YEAR ENDED 30 JUNE 2013 19Key financial issues
Debt and Hedging profile: First Priority Senior Secured Notes
• Foodcorp issued €390m Senior Secured Notes on 4 March 2011
• Coupon rate of 8.75% per annum and a maturity date of 1 March 2018
• Payments under the 2018 Notes consists of two components:
– Principal due on 1 March 2018; and
– Coupon payments due semi-annually on 1 September and 1 March
• Foreign exchange contracts entered into to hedge foreign currency exposure
– Principal hedged 50% through a performance participating foreign exchange contract and 50% through
a vanilla forward exchange contract
– Both for six years: maturing 1 March 2017
• Semi-annual coupon payments partially hedged (50%) at inception using forward exchange
contracts maturing on each coupon payment date, until 1 March 2017
• Remaining portion of the coupon payment due on 1 September 2013 has been hedged using
a vanilla forward exchange contract
• Mark-to-market effects of the hedging arrangements are accounted for in income statement
under net financing costs
• Foodcorp has the option to redeem up to 10% of the senior secured notes at 103% of the
principal amount plus accrued and unpaid interest prior to 1 March 2014
AUDITED RESULTS FOR THE YEAR ENDED 30 JUNE 2013 20Agenda
2013
Vision
Salient features Financial Key
and strategic
and review financial issues
priorities
results summary
Operational
Dividends Prospects Appendices
review
AUDITED RESULTS FOR THE YEAR ENDED 30 JUNE 2013 21Operational review – Rainbow Results remain under strong pressure due to 1. Continued record high imports causing over-supply and price suppression 2. Another 20% feed cost growth year, which couldn’t be fully recovered 3. …and this on top of consumer demand for all groceries, but also chicken coming under pressure Revenue (Rm) 2013 2012 Rainbow 8 144 7 197 Vector 1 477 1 340 Foodcorp (two months) 1 218 n/a Sales between Segments – Vector to Rainbow (726) (682) Sales between Segments – Vector to Foodcorp (4) n/a Total 10 109 7 855 Operating profit (R’000) 2013 2012 Rainbow (3 680) 245 487 Vector 143 303 168 737 Foodcorp (two months) 99 010 n/a Unallocated group costs (72 606) n/a Total 166 027 414 224 Rainbow | Vector | Foodcorp AUDITED RESULTS FOR THE YEAR ENDED 30 JUNE 2013 22
Operational review – Rainbow

1.        Continued record high imports causing over-supply and price suppression

                                    Imports                                                                                    Import permits issued
                   Total Chicken (Excl MDM) – Tons per month                                                             2010 to 2013 – monthly comparison
                                                                                                              3000
35 000                                                                                                                …and import permit
               The news is no better
                                                                                                              2500    applications looking
30 000        for recent import trends
                                                                                                                     forward show no relief
25 000                                                     An extra                                           2000
                                                           10 000
20 000                                                  tons/month                                            1500
15 000
                                                                                                              1000
10 000
                                                                                                              500
 5 000

      0                                                                                                         0
          Apr-03

                    Apr-04

                             Apr-05

                                      Apr-06

                                               Apr-07

                                                        Apr-08

                                                                 Apr-09

                                                                          Apr-10

                                                                                   Apr-11

                                                                                            Apr-12

                                                                                                     Apr-13

                                                                                                                     Jan Feb Mar Apr May Jun Jul Aug Sep Oct Nov Dec

                                                                                                                          2010       2011       2012       2013

     Source: SAPA

Rainbow | Vector | Foodcorp                                                                                            AUDITED RESULTS FOR THE YEAR ENDED 30 JUNE 2013   23
Operational review – Rainbow
2. Another 20% feed cost growth year, which couldn’t be fully recovered
2 600 5 000
FY11 FY12 FY13
2 400 4 500
-19.9%
2 200
Feed
4 000
-19.1% cost
2 000
growth
+15.6% 3 500
not
1 800
recovered
3 000
1 600
2 500
1 400
1 200 2 000
1 000 1 500
Mar-11
Mar-12
Mar-13
Jul-10
Oct-10
Apr-11
Oct-11
Apr-12
Oct-12
Apr-13
Jul-11
Jul-12
Aug-10
Jan-11
Jun-11
Aug-11
Jan-12
Jun-12
Aug-12
Jan-13
Jun-13
Dec-10
May-11
Dec-11
May-12
Dec-12
May-13
Sep-10
Nov-10
Feb-11
Sep-11
Nov-11
Feb-12
Sep-12
Nov-12
Feb-13
RWS c/kg Feed R/Ton
Rainbow | Vector | Foodcorp AUDITED RESULTS FOR THE YEAR ENDED 30 JUNE 2013 24Operational review – Rainbow
Exchange rate
R/US$
Exchange Rate
11
• Exchange rate volatility
continued during the year
10 • R/US$ exchange rate
increased from R8.38 at
+15% the beginning of the year to
9 -12% R9.95 at the end of June
+9% 2013: an 18.7% increase
• Average year-on-year
8
-9% increase was 15%
• As entire soya
7 requirements are imported,
foreign exchange exposure
is significant
6 • Given world economic
AM J J A SOND J FMAM J J A SOND J FMAM J J A SOND J FMAM J J A SOND J FMAM J
uncertainty, high volatility in
FY2010 FY2011 FY2012 FY2013 the Rand is expected to
remain for some time
Rainbow | Vector | Foodcorp AUDITED RESULTS FOR THE YEAR ENDED 30 JUNE 2013 25Operational review – Rainbow
Rainbow market conditions - maize
R/Ton
Maize
3 000 +59%
• Price of yellow maize
+5%
peaked at R2 830/ ton in
2 500
August 2012 declining to
R2 220/ton at end June
2 000 2013
+4%
• Average price for maize
1 500 was R2 368/ton,
compared to average
1 000 -24% market price of
R2 246/ton for the
previous period: average
500
increase of 5%
0
AM J J A SOND J FMAM J J A SOND J FMAM J J A SOND J FMAM J J A SOND J FMAM J
FY2010 FY2011 FY2012 FY2013
Rainbow | Vector | Foodcorp AUDITED RESULTS FOR THE YEAR ENDED 30 JUNE 2013 26Operational review – Rainbow
Rainbow market conditions - Soya (CBOT)
US$/ton Soya prices
Soya
600
• Price in July 2012 was
$427/short ton, rising to a
500 record high of $548/short
+30%
ton in August 2012, and
+7% decreasing to $480/short
400 +1% +1% ton at end June 2013
• Average market price was
300 $455/short ton compared
to $351/short ton, an
increase of 30%
200
• International price volatility
driven by severe drought in
100 the USA in 2012
• South American crop and
the prospect of a record
0 USA crop later in the year
AM J J A SOND J FMAM J J A SOND J FMAM J J A SOND J FMAM J J A SOND J FMAM J
could see CBOT prices
FY2010 FY2011 FY2012 FY2013 return to the low $300’s
Rainbow | Vector | Foodcorp AUDITED RESULTS FOR THE YEAR ENDED 30 JUNE 2013 27Operational review – Rainbow
3. ..…and this on top of consumer demand for all groceries, but
also chicken coming under pressure
Category Growth
Sugar -4.5%
Margarine 0.5%
Cooking oil 2.0%
Maize meal -1.3%
Eggs -4.2%
Mayonnaise/salad cream 3.7%
Frozen meat products -0.1%
Chicken -3.3%
Source: Nielsen
Rainbow | Vector | Foodcorp AUDITED RESULTS FOR THE YEAR ENDED 30 JUNE 2013 28Operational review – Rainbow
The added value portfolio obviously slows in growth during tough consumer times,
but FoodSolutions still saw 4% volume growth
FoodSolutions Retail
• KFC, and Chicken Licken saw steady • The key feature of Retail was the strongly
growth, with Nandos showing strong suppressed price
growth due to Rainbow picking up more • The added value portfolio has performed
share of the Nandos business acceptably in the difficult consumer
• The Delicatessen drive saw very promising environment
innovation and growth
• Market shares of added value are strong in
a weak consumer environment
Rainbow | Vector | Foodcorp AUDITED RESULTS FOR THE YEAR ENDED 30 JUNE 2013 29Operational review – Rainbow Rainbow has driven a tight cost environment in these tough times, despite the Rustenburg strike costing R33m Cost saving initiatives Operating expenses growth • Gas heating of chicken houses to coal conversion • Company re-design of processes and structures • Freezing capacity investment for flexibility • Product and customer profitability drives • Capex limited to a minimum F09 F10 F11 F12 F13 • Efficiencies are starting to materialise Actual Inflation @ 8% …. but clearly, going forward, no-one can rely on tariff and anti-dumping measures being imposed, and Rainbow will need to gear its business model to drive a more resilient profit performance Rainbow | Vector | Foodcorp AUDITED RESULTS FOR THE YEAR ENDED 30 JUNE 2013 30
Operational review – Rainbow

Trade remedy measures
Tariff and anti-dumping applications have been submitted to government, but clearly both need to succeed to
resolve a normalised environment
                          Total Chicken imports                     Bone in chicken imports
                          2010                                                  2012
                                 EU          Argentina
                                 5%            10%
                                                                                   Brazil
                                              USA                                   17%
                                               2%                                                                Canada
                                                                                              Argentina
                                             Canada                                                                 2%
                                                                                                 3%
                                               7%                                              Other             Australia
                                            Australia                                           5%                   2%
                                              2%                           EU
                                                                                                                 United States
                                             Thailand                     75%
                                                                                                                      1%
                                                0%                                                                Other
                 Brazil
                  73%                         Other                                                               0.05%
                                               1%
                                                                                2013
                          2012                Argentina
                                                 7%
                                                USA
                            EU                                                              Brazil
                                                3%
                           32%                                                               18%
                                              Canada
                                                2%
                                                                                                     Argentina
                                                Australia                                               3%
                                                  2%
                                                                                                      Canada
                                                Thailand
                                                                                                        2%
                                                  2%
             Brazil                               Other                                               Thailand
             52%                                   0%                                                  0.002%
                                                                     EU
                                                                    77%
Source SARS | May 2013
Rainbow | Vector | Foodcorp                                     AUDITED RESULTS FOR THE YEAR ENDED 30 JUNE 2013          31
Operational review – Rainbow Injection ‘cap’ legislation • Rainbow welcomes and continues to play a key role to adopt a responsible approach to injection of poultry meat • Government announced its intention to cap, however at 8% it is too low to deliver a quality, succulent product • Rainbow, through SAPA, is progressing a Code of Practice as an alternative Rainbow | Vector | Foodcorp AUDITED RESULTS FOR THE YEAR ENDED 30 JUNE 2013 32
Operational review – Vector

Vector’s operating profit declined 15% from R169m in 2012 to R143m in 2013 mainly due to
subdued revenue growth across all principals and investment in new capacity not fully utilised

 Revenue (Rm)                                                                 2013                  2012
 Rainbow                                                                     8 144                  7 197
 Vector                                                                      1 477                  1 340
 Foodcorp (two months)                                                       1 218                     n/a
 Sales between Segments – Vector to Rainbow                                   (726)                  (682)
 Sales between Segments – Vector to Foodcorp                                    (4)                    n/a
 Total                                                                      10 109                  7 855

 Operating profit (R’000)                                                     2013                  2012
 Rainbow                                                                    (3 680)              245 487
 Vector                                                                    143 303               168 737
 Foodcorp (two months)                                                      99 010                   n/a
 Unallocated group costs                                                   (72 606)                  n/a
 Total                                                                     166 027               414 224

Rainbow | Vector | Foodcorp                              AUDITED RESULTS FOR THE YEAR ENDED 30 JUNE 2013   33
Operational review – Vector

Retail sector under pressure
• Particularly evident in Principal Secondary Distribution business where almost all principals
  report sluggish or negative growth

• Offset to some degree by take on of new customers; Namib Poultry, Mello Pies, an enlarged
  inland Pick and Pay basket and nominated as Burger King’s distribution partner

Significant investment over recent years in new capacity
• Additional 17 000 pallet positions in Midrand introduced (49 000 total)

• Additional bulk storage capacity

Costs well managed and contained
• 13.4% growth in costs driven by the investment in new capacity at Midrand.

• All other costs were well managed below inflationary increases through initiatives introduced
  to improve efficiencies, sustainability awareness, stock loss reduction and general cost
  containment

Rainbow | Vector | Foodcorp                               AUDITED RESULTS FOR THE YEAR ENDED 30 JUNE 2013   34
Operational review – Vector
                              Revenue, Operating Cost, Operating Profit : F13 vs. F12 (Rm)
                                                                                                         • 10.3% growth in revenue
                                 10.3%                                                                     driven by the increase in
                                                               13.4%
                                                                                                           bulk storage, which grew
                                                                                                           28.6% following new
                                                                                                           capacity introduced at
                                                                                                           Midrand; this was partially
                                                                                              -15.1%       offset by subdued growth
                                                                                                           across most principals and
                   Revenue                       Operating Costs               Operating profit
                                                                                                           a shift towards the lower
                                                                                                           revenue generating direct
                                  2012                                  2013                               route to market
      Lower volumes across all principals in secondary route to market plus shift in volume              • 13.4% growth in operating
      by key principals to direct route to market, impacts on network utilisation and revenue              costs driven by the
                                                                                                           increase in new capacity
                                                                                              4.9%
                                                                                                           at Midrand; all other costs
                                                                                                           were managed within
                                 -5.7%                         16.7%                                       inflationary levels
                                                                                                         • Operating profit decline of
                                                                                                           15.1% due to investment in
                                                                                                           new capacity and the
           Secondary route to market Directs route to market (tons)                 Total                  phased take-on of new
                    (tons)                                                          (tons)                 business
                               2012                                 2013

Rainbow | Vector | Foodcorp                                                        AUDITED RESULTS FOR THE YEAR ENDED 30 JUNE 2013   35
Operational efficiency – Vector
Volumes, Stock and Service Level Trends
0.7%
Operational efficiency
4.9%
• Year on year stock levels
decreased by 13.9%
-13.9% despite 4.9% volume
growth in the secondary
distribution network.
Volume Inventory Service Level Service levels improved
FY12 FY13 by 0.7%
• The full implementation
Stock Holding Trend
of the Adexa advanced
-13.9% planning tool will allow
further reduction of
inventory and improved
service levels
Rainbow | Vector | Foodcorp AUDITED RESULTS FOR THE YEAR ENDED 30 JUNE 2013 36Operational review – Vector
Customers Principals
Customer Secondary Distribution (CSD) Principal Secondary Distribution (PSD)
• Vector is contracted by the customer to deliver • Vector contracted by the principal to deliver to all
their full basket of products directly to the outlets retailers, wholesalers and general trade
• During 2013 Vector was nominated as the
• Two new principals were added to this business
distributor for Burger King who entered the SA
market during 2013 – namely Namib Poultry and Mello
Pies
Rainbow | Vector | Foodcorp AUDITED RESULTS FOR THE YEAR ENDED 30 JUNE 2013 37Operational review – Vector
Network optimisation
Network Optimisation
• The completed Midrand
Midrand capacity investment
expansion has added approx
20% additional warehousing
capacity to total network and
has enabled the full
consolidation of PnP Inland
volumes, as well as creating
capacity for future growth
• As part of the on-going
network optimisation, the
Klerksdorp depot was
mothballed at the end of
June 2013; this is expected to
save approximately R3.6m pa
• Further network optimisation
opportunities are being
explored for the Inland region
to leverage the capacity
gained at Midrand
Rainbow | Vector | Foodcorp AUDITED RESULTS FOR THE YEAR ENDED 30 JUNE 2013 38Operational review - Foodcorp Revenue (Rm) 2013 2012 Rainbow 8 144 7 197 Vector 1 477 1 340 Foodcorp (two months) 1 218 n/a Sales between Segments – Vector to Rainbow (726) (682) Sales between Segments – Vector to Foodcorp (4) n/a Total 10 109 7 855 Operating profit (R’000) 2013 2012 Rainbow (3 680) 245 487 Vector 143 303 168 737 Foodcorp (two months) 99 010 n/a Unallocated group costs (72 606) n/a Total 166 027 414 224 Rainbow | Vector | Foodcorp AUDITED RESULTS FOR THE YEAR ENDED 30 JUNE 2013 39
Operational review – Foodcorp

Foodcorp is a leading SA manufacturer of quality branded and private label
food products
• Product range includes
    – Peanut butter, pet food, mayonnaise, edible oils, breads and bakery products and wheat flour

    – Certain traditional SA products such as rusks, sorghum meal, mageu and white maize meal

• Manufactures and sells a wide range of quality convenience ready to eat products including
  pies, a range of products, speciality breads and cakes for Woolworths and other retailers

• Positions it’s products to appeal to the SA mass consumer market, representing
  approximately 70% of total SA population

• Foodcorp supplies most of their products nationally to major retail and wholesale outlets
    – Including Shoprite-Checkers, Woolworths, Pick ‘n Pay, Spar and Walmart-Massmart, independent
      retailers, forecourts and the food services industry

• Managed under six larger continuing production units
    – Grocery division, Milling division, Baking division, Pie division, Beverage division and Speciality division
Rainbow | Vector | Foodcorp                                         AUDITED RESULTS FOR THE YEAR ENDED 30 JUNE 2013   40
Operational review – Foodcorp Foodcorp had a reasonable trading performance, amidst tough trading conditions and growing pressure on consumer spending • Net revenue from continuing operations, for the two month period ended 30 June 2013, amounted to R1.2bn and operating profit R99.0m • The increase in operating expenses was kept below inflation despite high energy and distribution cost increases • Volume pressure has been felt due to the need to increase pricing to recover raw material input cost increases across most categories Rainbow | Vector | Foodcorp AUDITED RESULTS FOR THE YEAR ENDED 30 JUNE 2013 41
Operational review – Foodcorp

Brand investment results in Foodcorp’s core brands enjoying leading market positions

                                                           Market Position                Market share

 Food                             Brands                    2012           2013          2012           2013       Division
 National focus
 Dog food                                                       1                1        47%            50%     Grocery
 Peanut butter                                                  2                1        46%            50%     Grocery
 Beverages                                                      1                1        71%            70%     Beverage
 Rusks                                                          1                1        48%            42%     Grocery
 Pies                                                           1                1        35%            33%     Pie
 Mayonnaise                                                     2                2        46%            47%     Grocery
 Pilchards                                                      2                2        11%             8%     Fishing
 Sorghum                                                        2                2        35%            35%     Grocery
 Flour                                                          4                4        14%            14%     Milling
                              Largest single supplier to
 Private label                             Woolworths                                                            Speciality
 Regional focus
 Bread                                                          4                4        10%            11%     Baking
 Maize                                                          5                5         3%             3%     Milling
Eight Foodcorp brands enjoy either #1 or #2 market positions in their segments
Rainbow | Vector | Foodcorp                                                AUDITED RESULTS FOR THE YEAR ENDED 30 JUNE 2013    42
Operational review – Foodcorp
Foodcorp has grown faster than the market
Foodcorp versus market volume growth for the ten months
June 2013 versus ten months June 2012
11.7%
8.5%
4.0% 5.0%
3.0% 2.1%
2.0% 1.0% 1.3%
0.1%
-1.0% -1.1% -1.6%
-2.0%
-2.8%
-4.8% -4.7% -5.0%
-7.1% -5.2%
-8.7%
-17.0%
Foodcorp Market
Source: Nielsen| 1 Cartons only; 2 BMI data; 3 Management estimates
Rainbow | Vector | Foodcorp AUDITED RESULTS FOR THE YEAR ENDED 30 JUNE 2013 43Operational review – Foodcorp
Significant events
• Disposal of Fishing Division
– Foodcorp entered into a sale agreement to dispose of the Fishing Division and the anticipated effective
date is 31 October 2013
• Notable capital investments in 2013
– Milling capacity expansion
– Rusk factory expansion
– Pie factory expansion
• Commodity price cycle and impact on selling price increases
– Foodcorp was able to successfully pass on cost increases through higher selling prices, however
volumes suffered as a result thereof
– Foodcorp experienced significant increases in raw materials used in the production of the basket
Rainbow | Vector | Foodcorp AUDITED RESULTS FOR THE YEAR ENDED 30 JUNE 2013 44Agenda
2013
Ambition
Salient features Financial Key
and strategic
and review financial issues
priorities
results summary
Operational
Dividends Prospects Appendices
review
AUDITED RESULTS FOR THE YEAR ENDED 30 JUNE 2013 45Dividend
In view of Rainbow’s poor trading results
and the uncertainty relating to
the poultry industry, the Board has resolved not to declare a dividend
AUDITED RESULTS FOR THE YEAR ENDED 30 JUNE 2013 46Agenda
2013
Ambition
Salient features Financial Key
and strategic
and review financial issues
priorities
results summary
Operational
Dividends Prospects Appendices
review
AUDITED RESULTS FOR THE YEAR ENDED 30 JUNE 2013 47Prospects
• Improvement in consumer sentiment and spending unlikely in the near future: affecting
Rainbow and Foodcorp directly
• ZAR:US$ and ZAR:Euro exchange rates will continue to have an effect on earnings
• Government decision on poultry anti-dumping protection is key to restoration of acceptable
profit margins
• New season crops anticipated to restore global shortages, impact on future commodity pricing
uncertain
• Chicken operating margins to remain under pressure
• Vector trading conditions likely to remain challenging
• Full year of Foodcorp and Zam Chick contributions in 2014
• Opportunities in strategic growth markets will continue to be pursued in the food sector in
South Africa and sub-Saharan Africa
– The agricultural/food sector offers good growth with numerous opportunities in southern Africa
– Striving for a well balanced asset base to leverage our effective management and established systems
AUDITED RESULTS FOR THE YEAR ENDED 30 JUNE 2013 48Agenda
2013
Ambition
Salient features Financial Key
and strategic
and review financial issues
priorities
result summary
Operational
Dividends Prospects Appendices
review
AUDITED RESULTS FOR THE YEAR ENDED 30 JUNE 2013 49RCL Foods: transformation phase
Rbn Revenue Well positioned for growth
2004 – 2010
10.0 Transformation to
1991-1998 8.6 consumer focused
1999-2003 7.9
Business in trouble Fixing the basics 6.8 7.0 business
6.0
3.7 3.8 4.0 4.1
4.7 • Acquired Vector (R455m) to
3.0 enable optimisation of
2.1 2.2 2.2 2.3 2.5
1.5 1.5 1.6 1.7 1.9 outbound supply chain
0.5
• Consumer insight driving
brand strategies - emphasis
1991
1992
1993
1994
1995
1996
1997
1998
1999
2000
2001
2002
2003
2004
2005
2006
2007
2008
2009
2010
2011
2012
2013
on Added Value
• Strategic customer approach
Rm Statutory HEBIT HEBIT margin to eliminate volume volatility
and create higher margin
14.1 13.9 12.8
business
5.6 5.0 6.9 7.9 7.2 765 6.2 7.4 6.5 7.8
4.4
2.0 2.0
578
657 • Significant capex investment
514 559
425 414 of R1,6bn
260 303 290 • Agreed IT strategy roadmap
139 153 166
30 76 45 76 38 47 and implemented profitability
tools
(41) (83)
(115) (147) • Strengthened leadership
Attributable loss (173) (229) talent pool and aligned
(268)
leadership through Good To
1991
1992
1993
1994
1995
1996
1997
1998
1999
2000
2001
2002
2003
2004
2005
2006
2007
2008
2009
2010
2011
2012
2013
Great journey
AUDITED RESULTS FOR THE YEAR ENDED 30 JUNE 2013 50RCL Foods: growth phase
Rbn Revenue Growth phase
2011 – 2015
10.0
Restructured
8.6 • 2 focused operating
7.9 companies with clear
6.8 7.0
6.0 strategies and opportunities
4.7 • Strategic focus CEO / CFO
3.7 3.8 4.0 4.1
3.0 Capacity enhanced
2.1 2.2 2.2 2.3 2.5
1.5 1.5 1.6 1.7 1.9 • Acquisition of 2nd further
0.5
processed plant (Wolwehoek)
• Acquisition of 4th primary
1991
1992
1993
1994
1995
1996
1997
1998
1999
2000
2001
2002
2003
2004
2005
2006
2007
2008
2009
2010
2011
2012
2013
processing plant (Tzaneen)
• Midrand distribution facility
Growth focused strategy
Rm Statutory HEBIT HEBIT margin • Compelling consumer brands
14.1 13.9 12.8 in attractive new food
5.6 5.0 6.9 7.9 7.2 765 6.2 7.4 6.5 7.8
4.4
categories
2.0 2.0 657
578 • Leverage scale and
514 559
425 414 synergies
260 303 290 • Target strategic growth
139 153 166
30 76 45 76 38 47
markets in sub-Saharan
Africa
(41) (83) • Diversification to counter
(115) (147) cyclicality
Attributable loss (173) (229)
(268) Successful recent activity
1991
1992
1993
1994
1995
1996
1997
1998
1999
2000
2001
2002
2003
2004
2005
2006
2007
2008
2009
2010
2011
2012
2013
• Foodcorp acquisition
• Zam Chick acquisition
• Rights issue
AUDITED RESULTS FOR THE YEAR ENDED 30 JUNE 2013 51Rainbow: infrastructure
209 rearing, laying and broiler farms and hatcheries
30m birds on the ground
5 feed mills
1.1m tons per year Limpopo
Province
4 primary processing plants
nearly 250m birds per year Tzaneen
2 further processed plants
27,000 tons per year Polokwane
Botswana Mpumalanga
Windhoek
Rustenburg
North Nelspruit
West
Roodepoort
Midrand
Swaziland
Klerksdorp
Carolina
Namibia Wolwehoek KwaZulu
Natal
Newcastle
Free
State
Pietermaritzburg
Northern Bloemfontein Hammarsdale
Cape Lesotho
Durban
Eastern
Cape
Western
Cape
Worcester
East
London
Cape Town Port
George Elizabeth
Rainbow | Vector | Foodcorp AUDITED RESULTS FOR THE YEAR ENDED 30 JUNE 2013 52Rainbow: complex business chain
Integrated supply chain from “farm to fork”
GP operation Agriculture Processing
Grandparent Broiler
chicks Grandparent farms Parent farms
farms
Rearing Laying Hatching Rearing Laying Hatching Growing Processing 4
broilers plants + 2 FP
21 weeks 40 weeks 3 weeks 21 weeks 40 weeks 3 weeks 34 days plants
• World’s oldest pedigree broiler breed • 3 broad agricultural regions
• Located in Carolina and East London - Northern, KZN, W Cape
to ensure optimal bio-security.
• 5 feed mills producing 1.1m tons pa
Feed supply
• Around 80% of production to Rainbow
Consumers Brands Customers Distribution
Grade A Quality,
Grade A Taste Foodservice
Retail
They taste so good
‘cos they eat so good
Wholesale
The
The consumer is at the Chicken
heart of our business Experts AUDITED RESULTS FOR THE YEAR ENDED 30 JUNE 2013 53
Rainbow | Vector | FoodcorpChicken industry perspective
Average broiler production per week (in millions) excluding imports
Million
19.1 19.7
18.6 18.8
17.7 17.9
16.6
15.9
14.7
13.8 13.4
13.1
12.4
2001
2002
2003
2004
2005
2006
2007
2008
2009
2010
2011
2012
Apr-13
Source: SAPA
Rainbow | Vector | Foodcorp AUDITED RESULTS FOR THE YEAR ENDED 30 JUNE 2013 54Chicken industry perspective
Estimated per capita consumption of broiler meat in Kilograms per capita
Kg
39.1 40.0
37.9
36.6
33.9 34.8
32.9
29.6
26.2 25.9 26.8
24.3 23.6
2000
2001
2002
2003
2004
2005
2006
2007
2008
2009
2010
2011
2012
Source: SAPA
Rainbow | Vector | Foodcorp AUDITED RESULTS FOR THE YEAR ENDED 30 JUNE 2013 55Operational review
Vector: infrastructure
plant-based cold stores
distribution sites
Limpopo
Province
Vector infrastructure
Tzaneen
Polokwane • National footprint
including Windhoek
Botswana Mpumalanga
Windhoek
Rustenburg – 4 plant-based cold stores
North Nelspruit
Roodepoort
West Midrand – 14 distribution sites
Swaziland
Carolina – Capacity 98 450 pallets
Namibia Wolwehoek KwaZulu
Natal
– Employees 3 073
Newcastle
Free
State
– Customer Drop Points
7 000
Bloemfontein
Northern
Cape Lesotho Hammarsdale – 171 000 – 178 000 cases
Durban delivered daily
(43m cases pa)
Eastern
Cape – Tonnage 624 000 tons pa
– Fleet of 426 vehicles
Western (primary 102 /
Cape
secondary 324)
Worcester
East – ISO 22000 accreditation
London for all Warehouses
Cape Town Port
George Elizabeth
Rainbow | Vector | Foodcorp AUDITED RESULTS FOR THE YEAR ENDED 30 JUNE 2013 56Operational review – Vector
Manufacturers Primary Primary Principal Customer Sales Credit &
(PBCS) Warehousing Transport Secondary Secondary Solutions Information
(VCS) (VPT) Distribution Distribution (VSS) Management
(PSD) (CSD)
2008 2002 2007 1966 2001 2004 2001
Plant Based Primary Primary Secondary Secondary call centres, Debtors and
Cold Stores Warehousing Transport Warehousing & Warehousing & sales and information
Transport Transport merchandising management
2005 2013
2% 6% In December 2004 Rainbow acquired
4%
7% the Vector business which comprised
34% 94% Principal Secondary Distribution;
9% Since then
• Vector manages the entire Rainbow
Outbound Supply Chain
• Vector now offers a fully integrated
18% and cost effective outbound supply
chain to customers and principals
94% 24% • The business is more balanced and
Plant Based Cold Storage (PBCS) Bulk Storage (VCS) diversified with service offerings
Sales and Merchndising (VSS) Customer Secondary Distribution (CSD) covering the full outbound supply
Primary Transport (VPT) Principal Secondary Distribution (PSD)
chain
Rainbow | Vector | Foodcorp AUDITED RESULTS FOR THE YEAR ENDED 30 JUNE 2013 57Foodcorp - market conditions - wheat
R/ton Wheat prices
4 000
+22% Wheat
3 500 +21% • Local wheat prices have
been at high levels
+3% throughout the period
3 000 • The average market price
for local wheat for this
period was R3 488/ton
compared to the average
2 500 market price of
R2 849/ton over the
previous 12 month
period, an increase of
2 000 22%
-22%
• South Africa is a net
FY2010 FY2011 FY2012 FY2013 importer of wheat and
1 500 wheat prices are
AM J J A SOND J FMAM J J A SOND J FMAM J J A SOND J FMAM J J A SOND J FMAM J
therefore correlated to
international wheat prices
and the exchange rate
Rainbow | Vector | Foodcorp AUDITED RESULTS FOR THE YEAR ENDED 30 JUNE 2013 58You can also read