Preliminary inventory of atmospheric emissions (SO2, NOx and TSP) from different industrial sectors in Costa Rica
←
→
Page content transcription
If your browser does not render page correctly, please read the page content below
Uniciencia Vol. 35(2), pp. 1-13, July-December, 2021              DOI: http://dx.doi.org/10.15359/ru.35-2.5
  www.revistas.una.ac.cr/uniciencia                                                      E-ISSN: 2215-3470
   revistauniciencia@una.cr                                                                CC: BY-NC-ND

                       Preliminary inventory of atmospheric
                       emissions (SO2, NOx and TSP) from
                       different industrial sectors in Costa Rica
                Inventario preliminar de emisiones atmosféricas (SO2, NOx y PTS) de
                            diferentes sectores industriales en Costa Rica
                 Inventário preliminar de emissões atmosféricas (SO2, NOx e PTS) de
                              diferentes setores industriais na Costa Rica
                               Daniel Alfaro-Alfaro1 • Luis Salas-Morelli1 • Bryan Sánchez-Mejías1
                           José Mora-Barrantes2 • José Pablo Sibaja-Brenes2 • Henry Borbón-Alpízar2

                                Received: Jan/27/2020 • Accepted: Sep/6/2020 • Published: Jul/31/2021

        Abstract
        The use of fuels, urbanization growth, and economic development have influenced the generation of
        atmospheric pollutants such as NOx (nitrogen oxides), SO2 (sulfur dioxide), and TSPs (Total Suspended
        Particles). The Costa Rican industrial sector has different category companies such as glass melting and
        manufacturing of food products and clothing, which release emissions of these pollutants into the
        atmosphere. The main objective of this research is to generate a preliminary inventory of atmospheric
        emissions (NOx, SO2, and TSP) from different industrial sectors in Costa Rica. The inventory was conducted
        in 2019 and included samplings and measurements of pollutants from chimneys of different production
        processes (companies) from 2014 and 2015. The sampling and the corresponding measurement of
        pollutant concentrations (NOx, SO2 and TSP) were conducted using Testo 350 to measure NOx and SO2
        and an APEX portable particle counter to quantify TSPs. Data was tabulated using Microsoft Excel, while
        graphics were generated using R programming language in the R studio interface. The industrial sector
        entitled “manufacturing of food products” presents the highest amounts of pollutants, with values equal to
        1246.14 tons/year, 1959.54 tons/year and 651.01 tons/year for NOx, SO2, and TSP, respectively, for 2014;
        and 2,622.14 tons/year, 3,257.64 tons/year and 346.40 tons/year, respectively, for 2015.
        Keywords: inventory; gaseous emissions; atmospheric pollution; NOx; SO2; TSP; Costa Rica

        Daniel Alfaro-Alfaro,    danielalfarox2@gmail.com, https://orcid.org/0000-0002-8527-6844
        Luis Salas-Morelli,   salasmorelli22@gmail.com, https://orcid.org/0000-0002-5640-7358
        Bryan Sánchez-Mejías,      bsanchezmejias@gmail.com, https://orcid.org/0000-0002-6475-988X
        José Mora-Barrantes,     jose.mora.barrantes@una.cr, https://orcid.org/0000-0002-0409-5276
        José Pablo Sibaja-Brenes,     jose.sibaja.brenes@una.cr, https://orcid.org/0000-0002-7056-2717
        Henry Borbón-Alpízar,      henry.borbon.alpizar@una.cr, https://orcid.org/0000-0003-0869-4126
        1 Escuela de Química, Facultad de Ciencias Exactas y Naturales, Universidad Nacional, Heredia, Costa Rica.
        2 Laboratorio de Química de la Atmósfera, Escuela de Química, Facultad de Ciencias Exactas y Naturales, Universidad Nacional,
            Heredia, Costa Rica.

                                                                                                                                        1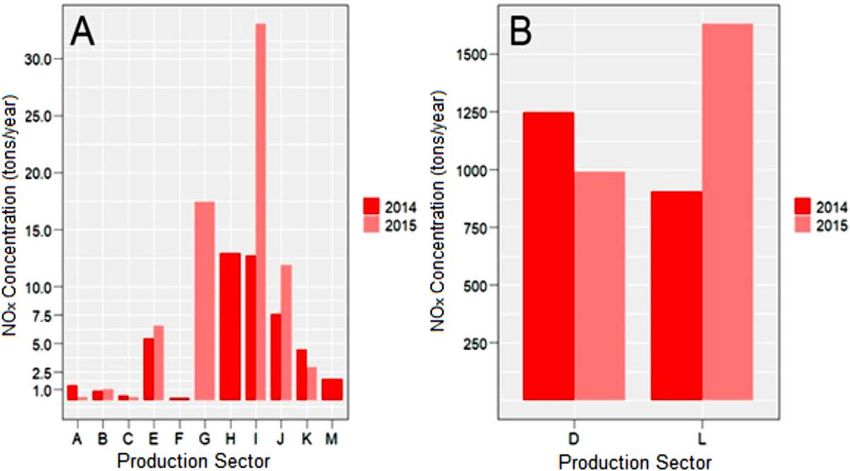
DOI: http://dx.doi.org/10.15359/ru.35-2.5
                                                                                               E-ISSN: 2215-3470
                                                                                                 CC: BY-NC-ND

    Resumen
    El uso de diversos combustibles, el incremento de la urbanización, y el desarrollo económico, han influido
    en la generación de contaminantes atmosféricos, tales como los NOx (óxidos de nitrógeno), el SO2 (dióxido

                                                                                                                        UNICIENCIA Vol. 35, N°. 2, pp. 1-13. July-December, 2021 •
    de azufre) y las PTS (partículas totales en suspensión). El sector industrial en Costa Rica cuenta con empresas
    de diferentes categorías como las de elaboración de productos alimenticios, fundición de vidrio, fabricación
    de prendas de vestir, entre otras, las cuales generan en sus procesos, emisiones de estos compuestos a
    la atmósfera. El presente proyecto de investigación tiene como objetivo principal generar un inventario
    preliminar de las emisiones atmosféricas (NOX, SO2 y PTS) de diferentes sectores industriales de Costa Rica.
    El inventario se realizó durante el 2019, considerando los resultados de muestreos y mediciones de los
    contaminantes provenientes de las chimeneas de diferentes procesos productivos (empresas) durante los
    años 2014 y 2015. El muestreo y la correspondiente medición de la concentración de los contaminantes
    (NOX, SO2 y PTS) se llevó a cabo mediante el uso del Testo 350 para la medición de los NOx y del SO2, y el
    contador portátil de partículas marca APEX para la cuantificación de PTS. La tabulación de datos utilizó el
    programa Microsoft Excel, utilizándose además el lenguaje de programación R, en la interfaz de R Studio
    para la generación de los gráficos. El sector industrial “elaboración de productos alimenticios” reporta las
    mayores concentraciones de contaminantes, con valores de 1 246,14 ton/año, 1 959,54 ton/año y 651,01
    ton/año para NOX, SO2 y PTS, respectivamente en el 2014; y 2 622,14 ton/año, 3 257,64 ton/año y 346,40

                                                                                                                        www.revistas.una.ac.cr/uniciencia •
    ton/año respectivamente para el 2015 en estos mismos contaminantes.
    Palabras clave: emisiones gaseosas; contaminación atmosférica; NOX; SO2; PTS; Costa Rica.
    Resumo
    O uso de diversos combustíveis, o aumento da urbanização, e o desenvolvimento econômico
    influenciaram na geração de poluentes atmosféricos, tais como os NOx (óxidos de nitrogênio), o SO2
    (dióxido de enxofre) e as PTS (Partículas Totais em Suspensão). O setor industrial na Costa Rica conta com
    empresas de diferentes categorias como as de elaboração de produtos alimentícios, fundição de vidro,
    fabricação de vestuário, entre outras, geradoras, em seus processos, de emissões destes compostos na

                                                                                                                        revistauniciencia@una.cr
    atmosfera. O presente projeto de pesquisa tem como objetivo principal a geração de um inventário
    preliminar das emissões atmosféricas (NOx, SO2 e PTS) de diferentes setores industriais da Costa Rica. O
    inventário foi realizado durante o ano de 2019, considerando os resultados de amostragens e medições
    dos poluentes provenientes das chaminés de diferentes processos produtivos (empresas) durante os
    anos 2014 e 2015. A amostragem e a correspondente medição da concentração dos poluentes (NOx, SO2
    e PTS) foram levadas a cabo mediante o uso do Testo 350 para a medição dos NOx e do SO2, e o contador
    portátil de partículas da marca APEX para a quantificação de PTS. A tabulação de dados foi realizada no
    programa Microsoft Excel, usando, também, a linguagem de programação R, na interface de R Studio
    para a geração dos gráficos. O setor industrial “elaboração de produtos alimentícios” produz as maiores
    concentrações de poluentes, com valores de 1.246,14 ton/ano, 1.959,54 ton/ano e 651,01 ton/ano para
    NOx, SO2 e PTS, respectivamente em 2014; e 2.622,14 ton/ano, 3.257,64 ton/ano e 346,40 ton/ano
    respectivamente em 2015 nestes mesmos poluentes.
    Palavras-chave: emissões gasosas; contaminação atmosférica; NOx; SO2; PTS; Costa Rica.

Daniel Alfaro-Alfaro • Luis Salas-Morelli • Bryan Sánchez-Mejías                                                    2
José Mora-Barrantes • José Pablo Sibaja-Brenes • Henry Borbón-Alpízar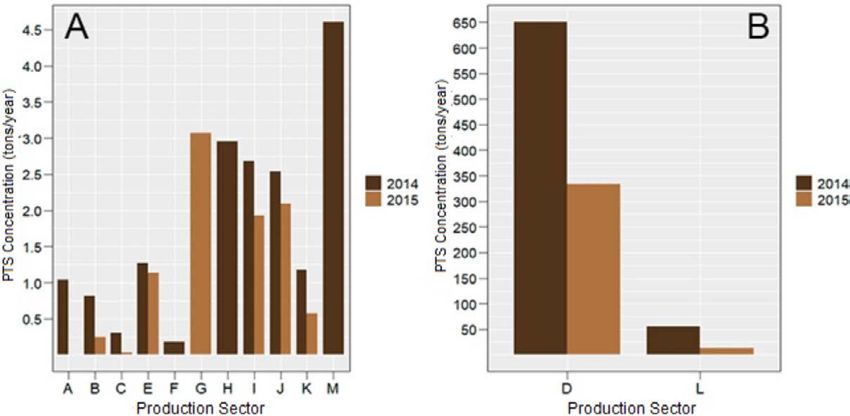
DOI: http://dx.doi.org/10.15359/ru.35-2.5
                                                                                                       E-ISSN: 2215-3470
                                                                                                         CC: BY-NC-ND

            INTRODUCTION                                                comprised of volatile organic compounds,
                                                                        as well as inorganic complexes, some of
           Economic development, urbaniza-                              which may be toxic to human health, such
    tion, and the dependence on fossil fuels, as                        as lead (Chen et al., 2015).

                                                                                                                                UNICIENCIA Vol. 35, N°. 2, pp. 1-13. July-December, 2021 •
    a means of obtaining energy, have led to the                               Soil erosion, ocean motion and wild-
    deterioration in air quality in both devel-                         fires are three of the main TSP sources
    oped cities as well as in industrial growing                        (Ayrault et al., 2010 & Ali et al., 2012). In
    cities (Zhao et al., 2013). Anthropogenic                           addition to anthropogenic sources, there are
    activities are the main source of high con-                         natural sources that contribute to gaseous
    centrations of pollutants in the atmosphere                         emissions, for example, the higher impact
    (Yang et al., 2017, Wang et al., 2017 & Fujii                       of NOx resulting from microbial activity in
    et al., 2016).                                                      soils and lightning discharge from electri-
            Sulfur dioxide (SO2), nitrogen oxides                       cal storms (Zhang, 2012). SO2, on the other
    (NOx), and Total Suspended Particles (TSP)                          hand, is released naturally mainly by volca-
    are three of the main types of anthropogenic                        nic activity (Ge et al., 2017).
    pollutants most frequently found in the at-                                Continued NOx and SO2 inhalation
    mosphere. Not only do SO2 and NOx hinder                            can cause cardiorespiratory problems such
    visibility, but they also generate adverse ef-                      as arrhythmia, worsening of existing re-

                                                                                                                                www.revistas.una.ac.cr/uniciencia •
    fects on human health and in the preserva-                          spiratory problems like asthma, as well as
    tion of the constantly exposed ecosystem.                           higher susceptibility of getting a respiratory
    Some of the consequences of these gaseous                           infection. Continued exposure to TSPs can
    emissions are: a) Production of acid rain,                          also generate the same health effects as NOx
    b) Destruction of the ozone layer and an c)                         and SO2; however, contingent upon their
    Increase in tropospheric ozone (Marć et al,                         composition, they may be associated even
    2016, Yang et al., 2018 & Ying et al., 2007).                       with the development of lung cancer (Mc-
           On the other hand, other pollutants,                         Granahan, 2012).
    such as TSPs, have generated great interest                                As for Costa Rica, the main commer-

                                                                                                                                revistauniciencia@una.cr
    in terms of their composition as they can                           cial and industrial activities concentrate
    contain carcinogenic substances, such as                            in the Greater Metropolitan Area (GAM).
    some volatile organic compounds. Similarly,                         While this region covers only 3.8 % of the
    TSPs act as precursors in the formation of                          territory, it is home to 70 % of the vehicle
    secondary aerosols (Hu et al., 2019), in addi-                      fleet, 60 % of the population and 85 % of the
    tion to altering the vertical extension, life and                   industry, according to data from the National
    optical properties of clouds by forming con-                        Institute of Statistics and Censuses (INEC,
    densation nuclei and consequently, the com-                         2016). Characterized by radial growth, this
    position of precipitation (Joos et al., 2017).                      area has given way to the conurbation of the
           The main source of anthropogenic                             four main cities, Alajuela, Heredia, San José
    NOx and SO2 emissions is the combustion                             and Cartago (Herrera et al., 2016).
    of fossil fuels and coal, represented in bio-                              According to the 2011 Pollutant Emis-
    mass burning, the main source of emissions                          sions Inventory of Costa Rica, 418663 tons
    (Fioletov et al., 2015). With regard to TSPs,                       of carbon monoxide (CO) were generated in
    their sources are varied and their com-                             the GAM, as well as 64640 tons of nitrogen
    position is quite complex, as they can be                           oxides (NOx), and 6149 tons of PM10, with

Daniel Alfaro-Alfaro • Luis Salas-Morelli • Bryan Sánchez-Mejías                                                            3
José Mora-Barrantes • José Pablo Sibaja-Brenes • Henry Borbón-Alpízar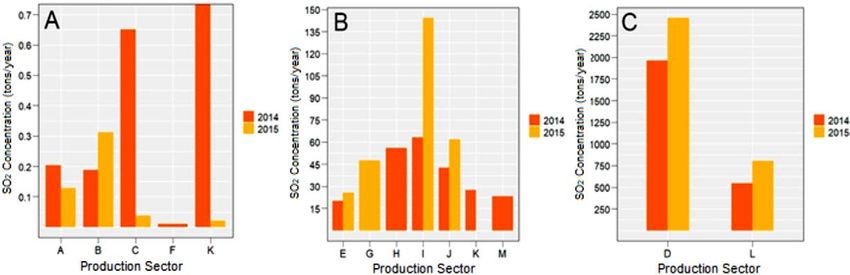
DOI: http://dx.doi.org/10.15359/ru.35-2.5
                                                                                                        E-ISSN: 2215-3470
                                                                                                          CC: BY-NC-ND

    light-duty vehicles accounting for more than                              The information gathered will facili-
    half of the PM10 particles and private cars as                      tate decision-making to improve air quality
    the main NOx and CO generators (Herrera                             and serve as preliminary input for a baseline
    et al., 2017).                                                      concentration of NOX, SO2 and TSP emis-

                                                                                                                                    UNICIENCIA Vol. 35, N°. 2, pp. 1-13. July-December, 2021 •
           The amount of air pollution must be                          sions from the industrial sectors studied.
    quantified to determine the level of the prob-
    lem and to generate actions in the field of                                METHODOLOGY
    air quality management. There are different
    methodological tools to calculate the amount                               Study population
    of pollutants in the environment, such as mon-
    itoring systems and emissions inventories.                                 The sampling points correspond only
           Moreover, they serve as technical                            to stationary sources (chimneys) of gaseous
    input to create correlational studies, using                        and solid emissions (SO2, NOX and TSP) in
    modeling techniques, and to suggest alterna-                        companies from different industrial sectors.
    tives for reducing pollution (Herrera et al.,                       These companies are classified according to
    2016). The main objective of this research is                       the International Standard Industrial Classi-
    to elaborate a preliminary inventory of gas-                        fication (ISIC Code) (National Institute of
    eous NOX, SO2 and TSP emissions released                            Statistics and Censuses, 2016). SO2, NOx
                                                                        and TSP measurements were carried out

                                                                                                                                    www.revistas.una.ac.cr/uniciencia •
    from chimneys in different companies in
    Costa Rica, identifying those industrial sec-                       over a period of two years (2014 and 2015).
    tors with the most pollutant emissions.                             The classification of industries evaluated is
                                                                        shown in the following table.

    Table 1. Classification of production sectors, sector ID and number of industries evaluated
                                      in the 2014-2015 period
                        Production sector                               Identification        Amount of              Amount of
                                                                                             industries in          industries in

                                                                                                                                    revistauniciencia@una.cr
                                                                                                2014                   2015
     Human healthcare activities                                  A                        2                      1
     Accommodation                                                B                        2                      2
     Building construction                                        C                        1                      1
     Food products manufacturing                                  D                        29                     23
     Tobacco products manufacturing                               E                        1                      1
     Technical tests and analyses                                 F                        1                      0
     Manufacturing of soaps and detergents, etc.                  G                        0                      1
     Garment manufacturing                                        H                        2                      0
     Manufacturing of pharmaceutical products, chemical           I                        2                      1
     medicinal products, etc.
     Manufacturing of textile products                            J                        1                      1
     Manufacturing of chemical substances and products            K                        1                      1
     Glass and glass products manufacturing                       L                        1                      1
     Metal casting                                                M                        1                      1
     Total                                                        -                        44                     32
    Note: Our own source

Daniel Alfaro-Alfaro • Luis Salas-Morelli • Bryan Sánchez-Mejías                                                               4
José Mora-Barrantes • José Pablo Sibaja-Brenes • Henry Borbón-Alpízar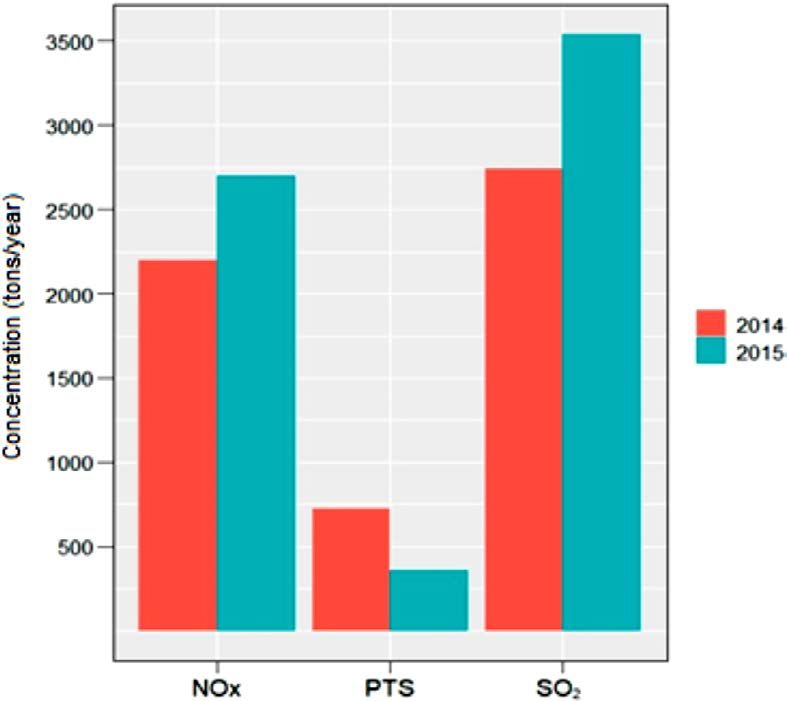
DOI: http://dx.doi.org/10.15359/ru.35-2.5
                                                                                                        E-ISSN: 2215-3470
                                                                                                          CC: BY-NC-ND

            SO2, NOX and TSP sampling                                   hours-to- year conversion multiplied by the
                                                                        milligrams-to-tons-of-pollutant conversion,
           For the measurement of NOx and SO2,                          as shown in the following equation:
    the Testo 350 equipment was used, which

                                                                                                                                    UNICIENCIA Vol. 35, N°. 2, pp. 1-13. July-December, 2021 •
    allows for measuring at high gas concen-
    trations and handles changes in differential
    pressure and speed to achieve flow measure-
    ments (Testo, 2019 & Xie et al., 2019). For
    TSP quantification, a portable APEX particle
    counter with high-range data recording and                                Equation 1. Determining the annual
    ease of handling was used (Zamtsu, 2019).                           pollutant concentration in tons/year
    The quantification of the concentrations for
    the study parameters is carried out in situ, us-                          ANALYSIS AND RESULTS
    ing the equipment described above.
                                                                              Study population
            Data processing
                                                                              According to Table 2, 151 samples
           The information was collected on an                          were obtained in both years, namely 78
    Excel sheet, namely, industry name, loca-                           chimneys from 44 companies in 2014, and

                                                                                                                                    www.revistas.una.ac.cr/uniciencia •
    tion, number of sampling points, sampling                           91 chimneys from 32 companies in 2015.
    date, as well as data from the emissions sam-                       Most of the samples were obtained in 2014.
    pling such as: flow (m3/h), SO2 (mg/Nm3),                           Food products manufacturing accounted for
    TSPs (mg/Nm3), NOx (mg/Nm3), SO2 (tons/                             the most industrial samples, with 29 compa-
    year), TSPs (tons/year), NOx (tons/year).                           nies in 2014 and 22 companies in 2015.
    The statistical analysis and graphs were                                  On the contrary, only one company
    generated in the R programming language,                            was evaluated from the following industri-
    in the R Studio interface, with the ggplot2,                        al sectors: Building construction, manufac-
    rgeos and rgdal data packages; ensuring a                           turing of tobacco products, manufacturing

                                                                                                                                    revistauniciencia@una.cr
    better agglomeration of results for interpre-                       of textile products, substance manufactur-
    tation purposes.                                                    ing and chemical products, glass and glass
                                                                        products manufacturing, and metal casting.
            Quantification of emissions
           To quantify the emissions from the                             Table 2. Number of samples, chimneys,
    tested chimneys, each fixed industrial source                           companies and industrial sectors
    was subjected to an average with respect to                                        evaluated
    the number of samplings carried out. In the                               Amount                   2014              2015
    case of several fixed sources from the same                         Samples                         92                59
    company, the values are added to determine                          Chimneys                        78                91
    their total emissions and the total contribu-                       Companies                       44                32
    tion by production sector (Table 1). This                           Industrial sector               12                10
    value is then transformed using Equation 1                          Note: Our own source.
    into an annual projection of pollutant tons.
    The conversion factor is composed of the

Daniel Alfaro-Alfaro • Luis Salas-Morelli • Bryan Sánchez-Mejías                                                                5
José Mora-Barrantes • José Pablo Sibaja-Brenes • Henry Borbón-Alpízar
DOI: http://dx.doi.org/10.15359/ru.35-2.5
E-ISSN: 2215-3470
CC: BY-NC-ND
Gaseous NOx emissions due to the nature of their production pro-
cess, with industrial sectors mainly en-
Graph 1 contains industrial NOx con- gaged in public services as opposed to
centration data (tons/year) released during product manufacturing.
UNICIENCIA Vol. 35, N°. 2, pp. 1-13. July-December, 2021 •
the period studied, with 2015 as the year On the other hand, the glass manufac-
with the highest amount of emissions. Of turing, glass products and food products man-
the 13 industrial sectors, 11 had NOx con- ufacturing sectors accounted for the highest
centrations under 50 tons/year, which cor- industrial gaseous NOx emissions, with con-
respond to human healthcare activities, centrations of 904.19 and 1246.14 tons/year,
accommodation, building construction and respectively, for the year 2014, and of 1630.99
technical tests and analyses and had con- and 991.16 tons/year in 2015.
centrations of 1.36, 0.85, 0.43 and 0.24 Those higher concentrations are ex-
tons/year, respectively, for the year 2014, plained by the fact that combustion of dif-
and 0.30, 1.02, and 0.28 tons/year for the ferent sources such as fossil fuels, natural
year 2015. (No evaluations were carried gas and coal, as well as the burning of bio-
out for the technical testing and analyses mass to obtain energy (Souri et al., 2016;
sector during the year 2015). Fan et al., 2017) produce NOx. These indus-
Lower NOx emission contributions trial sectors have a high production volume
are explained by the minimum energy and
www.revistas.una.ac.cr/uniciencia •
and non-stop process and operation sched-
heat demands required by these sectors ules requiring high temperatures.
revistauniciencia@una.cr
Graph 1. NOx concentration in tons/year for the different production sectors sampled in
Costa Rica, for the years 2014 and 2015. (Graph A: Production sectors between 0 and 30
NOx tons/year; Graph B: Production sectors between 250 and over 1500 tons/year).
Note: Our own source.
Daniel Alfaro-Alfaro • Luis Salas-Morelli • Bryan Sánchez-Mejías 6
José Mora-Barrantes • José Pablo Sibaja-Brenes • Henry Borbón-AlpízarDOI: http://dx.doi.org/10.15359/ru.35-2.5
E-ISSN: 2215-3470
CC: BY-NC-ND
These operating characteristics are for the textile products manufacturing sec-
the main cause of the high NOx emission tor for 2015. These values correspond to the
values (Hu et al., 2019). Furthermore, they high electricity consumption used for con-
indicate that the glass manufacturing, glass version into mechanical energy, in addition
UNICIENCIA Vol. 35, N°. 2, pp. 1-13. July-December, 2021 •
products and food products manufacturing to the use of calorific energy for the differ-
sectors contain the largest number of indus- ent heating processes (Khude, 2017).
tries sampled. In particular, the glass and
glass products manufacturing sector present Gaseous SO2 emissions
a raw material smelting process, for which
temperatures between 1000 °C and 1500 °C Graph 2 contains data on the indus-
(Garrido et al., 2019) are required. trial SO2 concentration (tons/year) released
Other industrial sectors, such as soap during the period studied, with 2014 as
manufacturing (with 17.45 tons/year in the year with the highest amount of emis-
2015) and pharmaceutical products manu- sions. Of the 13 industrial sectors, 4 had
facturing (with 12.74 tons/year in 2014 and SO2 concentrations under 0.70 tons/year,
33.05 tons/year in 2015), report intermedi- and 7 presented concentrations between 70
ate NOx values due to their minimal calo- and 150 SO2 tons/year, with the lowest con-
rific requirement to complete reactions and/ centrations in human healthcare activities
and technical tests and analyses, present-
www.revistas.una.ac.cr/uniciencia •
or syntheses and for product manufacturing
purpose when compared to other industrial ing emissions of 0.20 and 0.011 tons/year
sectors (Hu et al., 2019). in 2014, respectively, and 0.13 tons/year for
In the case of the garment and textile the human healthcare sector in 2015. These
product manufacturing sectors, values of values are explained mainly by the limited
12.94 and 7.57 tons/year are reported for energy and calorific demand in their pro-
2014, respectively, and 11.90 tons/year only duction processes, as well as the final ser-
vice provided (customer service).
revistauniciencia@una.cr
Graph 2. SO2 concentration in tons/year for the different production sectors sampled in
Costa Rica, for the years 2014 and 2015. (Graph A: Production sectors between 0.0 and
0.7 SO2 tons/year; Graph B: Production sectors between 15 and 150 SO2 tons/year; Graph
C: Production sectors between 250 and over 2500 SO2 tons/year).
Note: Our own source.
Daniel Alfaro-Alfaro • Luis Salas-Morelli • Bryan Sánchez-Mejías 7
José Mora-Barrantes • José Pablo Sibaja-Brenes • Henry Borbón-AlpízarDOI: http://dx.doi.org/10.15359/ru.35-2.5
E-ISSN: 2215-3470
CC: BY-NC-ND
On the other hand, the food products Gaseous TSP emissions
manufacturing, glass and glass products
manufacturing sector accounted for the Graph 3 contains data on the indus-
highest gaseous SO2 emissions, with con- trial TSP concentration (tons/year) released
UNICIENCIA Vol. 35, N°. 2, pp. 1-13. July-December, 2021 •
centrations of 1959.94 and 547.29 tons/ during the period studied, with 2014 as the
year, for the year 2014, 2453.60 and 804.05 year with the highest amount of emissions.
tons/year, respectively, for 2015 (Graph 2, Of the 13 industrial sectors, 11 have TSP
in graph C). These two industrial sectors concentrations under 5.0 tons/year, and 2
present high SO2 values due to the high pro- present concentrations under 700 tons/year.
duction temperatures (1000 °C to 1500 °C), The lowest concentrations correspond to
with higher fuel combustion, thus generat- the building construction and technical tests
ing greater sulfur dioxide concentrations. and analyses sectors, with emissions of 0.30
In contrast, industrial sectors such as and 0.18 tons/year in 2014, respectively,
soap manufacturing, pharmaceutical prod- and 0.032 tons/year, for 2015, in the case of
ucts manufacturing, textile product and gar- the building construction sector. Lower TSP
ment manufacturing have intermediate SO2 values (tons/year) are explained mainly by
emission values (Graph 2, Graph B), which is the lower energy and calorific demands in
mainly due to their low energy requirements their internal processes; these industrial sec-
tors use smaller amounts of fuel to generate
www.revistas.una.ac.cr/uniciencia •
-and lower combustion temperatures and
fossil fuel consumption- as a result thereof. heat energy (compared to the other industri-
al sectors).
revistauniciencia@una.cr
Graph 3. TSP concentration in tons/year for the different production sectors sampled in
Costa Rica in 2014 and 2015. (Graph A: Production sectors between 0.0 and 4.5 TSP tons/
year, graph B: Production sectors between 50 and 650 TSP tons/year).
Note: Our own research source.
Daniel Alfaro-Alfaro • Luis Salas-Morelli • Bryan Sánchez-Mejías 8
José Mora-Barrantes • José Pablo Sibaja-Brenes • Henry Borbón-AlpízarDOI: http://dx.doi.org/10.15359/ru.35-2.5
E-ISSN: 2215-3470
CC: BY-NC-ND
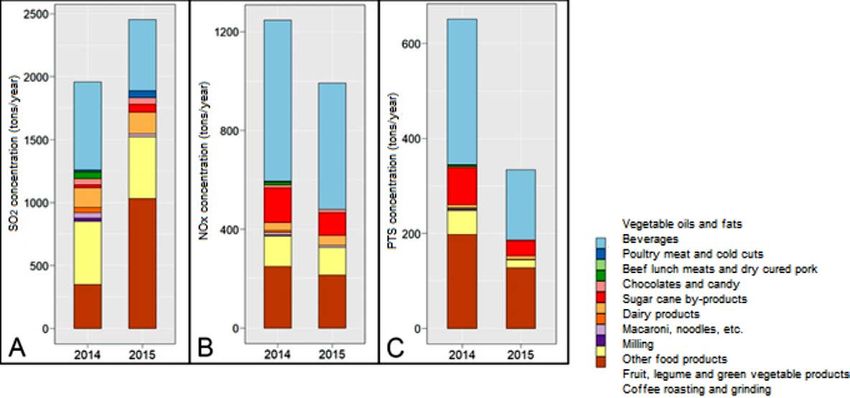
On the other hand, the food products Gaseous emissions (NOX, SO2 and
manufacturing, glass and glass products TSP) from the industrial sector: Food
manufacturing sector account for the most processing
emissions, with concentrations 651.01 and
UNICIENCIA Vol. 35, N°. 2, pp. 1-13. July-December, 2021 •
54.60 tons/year, respectively, for the year As discussed earlier, the food prod-
2014, and 334.09 and 12.64 tons/year for ucts manufacturing sector accounts for the
2015. These sectors (Graph 3, Graph B) highest amount of gaseous NOX, SO2 and
show much higher values (tons/year) com- TSP emissions for the years 2014 and 2015.
pared to the other sites studied mainly be- The gaseous emissions for the different in-
cause of higher fossil fuel consumption in dustrial activities comprising this sector are
final product manufacturing. shown in graph 4, as well as information on
However, higher TSP emissions were pollutant concentrations in tons/year (NOX,
reported in the food products manufactur- SO2 and TSP) for those activities.
ing sector (D), for both years, compared to In total, the gaseous emissions of 29
the glass and glass products manufacturing and 22 companies (industrial activities)
sector (L). This is explained mainly due to were quantified for the years 2014 and 2015,
the higher organic matter consumption in respectively. This industrial sector is made
Sector D’s production process leading to a up of activities related to the production of
oils, fats, beverages, meats, cold cuts, and
www.revistas.una.ac.cr/uniciencia •
greater amount of particles, other than those
from the burning of fossil fuel in both in- cane by-products, among others.
dustrial sectors (D and L). With regard to NOX emissions, the veg-
etable oils and fats, sugarcane by-products,
revistauniciencia@una.cr
Graph 4. Pollutant concentrations in tons/year per industrial activity comprising the
food products manufacturing in Costa Rica for the years 2014 and 2015. (Graph A: SO2
concentration, graph B: NOX concentration, graph C: TSP concentration)
Note: Our own source.
Daniel Alfaro-Alfaro • Luis Salas-Morelli • Bryan Sánchez-Mejías 9
José Mora-Barrantes • José Pablo Sibaja-Brenes • Henry Borbón-AlpízarDOI: http://dx.doi.org/10.15359/ru.35-2.5
E-ISSN: 2215-3470
CC: BY-NC-ND
fruit and vegetable products, and coffee CONCLUSIONS
roasting and grinding sectors have the high-
est emission values, with 652.09, 140.40, The gaseous SO2, NOX and TSP emis-
123.39, and 249.08 tons/year, respectively, sions evaluated refer to a population of 78
UNICIENCIA Vol. 35, N°. 2, pp. 1-13. July-December, 2021 •
for the year 2014 and 510.61, 91.88, 112.25, industrial chimneys, with 44 industrial ac-
and 213.86 tons/year for 2015. The rest of tivities assessed in the year 2014 and 32 in
the industrial activities comprising this sec- 2015, and classified into 13 sectors, with
tor show values under 40 tons/year, both for the food products manufacturing sector pre-
2014 and 2015. senting the highest SO2, NOX and TSP emis-
The highest gaseous emission values sions for these years.
for these industrial activities arise from the With regard to the food products man-
above factors, that is, greater demand for fos- ufacturing sector, the gaseous SO2 emis-
sil fuel consumption because of the energy sions accounted for 1959.54 and 3257.64
requirements in final products manufacturing. tons/year, respectively, while TSP emis-
In the case of sugar and vegetable oils produc- sions accounted for 651.01 and 346.40 tons/
tion and coffee roasting, these activities con- year and gaseous NOX emissions presented
stantly require high production temperatures values of 1246.14 and 2622.14 tons/year.
throughout the process, which generates a Vegetable oils and fats, sugarcane
www.revistas.una.ac.cr/uniciencia •
greater amount of SO2 and NOx emissions. by-products, fruit products, legumes and
As for TSP emissions, these industrial vegetables, as well as coffee roasting and
activities differ from the rest due to a larger grinding top the list of industries with the
number of particles generated
in final products, such as cof-
fee and sugar.
Total SO2, NOX and TSP
emissions (2014 – 2015)
revistauniciencia@una.cr
Graph 5 includes the total
NOx, SO2 and TSP emissions
for the years 2014 and 2015,
with SO2 having the highest
emissions in tons/year in the
company’s studies for both
2014 and 2015. This is due to
the use of bunker as the main
fuel used to generate calorific
energy. This fuel composition
includes a 0.0 % to 3.0 % m/m
sulfur percentage reported in
the product chemical safety
datasheet, which also indicates Graph 5. Total NOx, TSP and SO2 concentrations in tons/
absence of nitrogen in its com- year for 2014 and 2015.
position (Recope, 2019). Note: Our own source.
Daniel Alfaro-Alfaro • Luis Salas-Morelli • Bryan Sánchez-Mejías 10
José Mora-Barrantes • José Pablo Sibaja-Brenes • Henry Borbón-AlpízarDOI: http://dx.doi.org/10.15359/ru.35-2.5
E-ISSN: 2215-3470
CC: BY-NC-ND
highest emission for 2014, with 652.09, REFERENCES
140.40, 123.39 and 249.08 tons/year, re-
spectively, and presented values of 510.61, Ali, K., Budhavant, K. B., Safai, P. D., & Rao, P. S. P.
91.88, 112.25 and 213.86 tons/year for (2012). Seasonal factors influencing in chem-
UNICIENCIA Vol. 35, N°. 2, pp. 1-13. July-December, 2021 •
ical composition of total suspended particles
2015, respectively. at Pune, India. Science of the Total Environ-
As for the year 2015, the highest SO2 ment, 414, 257-267. https://doi.org/10.1016/j.
and NOX emission values reported were scitotenv.2011.09.011
3537.29 and 2695.62 tons/year, respective- Ayrault, S., Senhou, A., Moskura, M., & Gaudry,
ly, while the year 2014 reported the highest A. (2010). Atmospheric trace element con-
centrations in total suspended particles near
total suspended particles (355.82 tons/year). Paris, France. Atmospheric environment,
44(30), 3700-3707. https://doi.org/10.1016/j.
ACKNOWLEDGMENTS atmosenv.2010.06.035
Chen, J., Tan, M., Li, Y., Zhang, Y., Lu, W., Tong,
Y., ... & Li, Y. (2005). A lead isotope record
This work was prepared as part of the of Shanghai atmospheric lead emissions in
Industry Environmental Management Class total suspended particles during the period of
offered by the Industrial Chemistry Degree phasing out of leaded gasoline. Atmospheric
Program and the data base of samplings per- Environment, 39(7), 1245-1253. https://doi.
formed by the Atmospheric Chemistry Lab- org/10.1016/j.atmosenv.2004.10.041
www.revistas.una.ac.cr/uniciencia •
Fan, W., Li, Y., Guo, Q., Chen, C., & Wang, Y. (2017).
oratory (LAQAT-UNA). Coal-nitrogen release and NOx evolution in
the oxidant-staged combustion of coal. Ener-
AUTHOR CONTRIBUTION gy, 125, 417-426. https://doi.org/10.1016/j.
energy.2017.02.130
STATEMENT Fioletov, V. E., McLinden, C., Krotkov, N., & Li, C.
(2015). Lifetimes and emissions of SO2 from
Total contribution by the authors to- point sources estimated from OMI. Geophys-
wards conceptualization, preparation, drafting ical Research Letters, 42(6), 1969-1976.
and editing of this article is as follows: D.A.A. https://doi.org/10.1002/2015GL063148
Fujii, H., & Managi, S. (2016). Economic develop-
16.7 %, L.S.M. 16.7 %, B.S.M. 16.7 %, J.M.B.
revistauniciencia@una.cr
ment and multiple air pollutant emissions from
16.7 %, J.P.S.B. 16.7 %, H.B.A. 16.7 %. the industrial sector. Environmental Science
and Pollution Research, 23(3), 2802-2812.
DATA AVAILABILITY https://doi.org/10.1007/s11356-015-5523-2
Garrido-Zafra, J., Moreno-Munoz, A., Gil-de-Cas-
STATEMENT tro, A., Bellido-Outeirino, F., Medina-Gracia,
R., & Ballesteros, E. G. (2019). Load Sched-
The data supporting the findings of this uling Approach for Energy Management and
study will be openly available by the respec- Power Quality enhancement in Glass Melt-
ing Furnaces. In 2019 IEEE International
tive author [J.P.S.B.] upon reasonable request.
Conference on Environment and Electrical
Engineering and 2019 IEEE Industrial and
Commercial Power Systems Europe (EEE-
IC/I&CPS Europe) (pp. 1-6). IEEE. https://
doi.org/10.1109/EEEIC.2019.8783727
Ge, C., Wang, J., Carn, S., Yang, K., Ginoux, P.,
& Krotkov, N. (2016). Satellite-based glob-
al volcanic SO2 emissions and sulfate di-
rect radiative forcing during 2005–2012.
Daniel Alfaro-Alfaro • Luis Salas-Morelli • Bryan Sánchez-Mejías 11
José Mora-Barrantes • José Pablo Sibaja-Brenes • Henry Borbón-AlpízarDOI: http://dx.doi.org/10.15359/ru.35-2.5
E-ISSN: 2215-3470
CC: BY-NC-ND
Journal of Geophysical Research: Atmo- Recope. (2019). Ficha de datos de seguridad (FDS)
spheres, 121(7), 3446-3464. https://doi. del búnker. San José, Costa Rica. Recupera-
org/10.1002/2015JD023134 do de: https://www.recope.go.cr/wp-content/
Herrera, J., Briceño, J., Rojas, J. F., Solórzano, D. uploads/2017/12/FDS-Bunker-V.Final_.pdf
& Beita, V. H. (2016). Informe de calidad Souri, A. H., Choi, Y., Jeon, W., Li, X., Pan, S.,
UNICIENCIA Vol. 35, N°. 2, pp. 1-13. July-December, 2021 •
del aire del área metropolitana de Costa Diao, L., & Westenbarger, D. A. (2016). Con-
Rica: Años 2013-2015, p. 75. https://www. straining NOx emissions using satellite NO2
ministeriodesalud.go.cr/images/stories/docs/ measurements during 2013 DISCOVER-AQ
DPAH/2016/DPAH_VI_informe_anual_cali- Texas campaign. Atmospheric environment,
dad_aire_GAM_2013_2014.pdf 131, 371-381. https://doi.org/10.1016/j.
Herrera, J., Rojas, J. F., Mugica, V., Solórzano, D., atmosenv.2016.02.020
& Beita, V. H. (2017). Polycyclic aromatic Testo. (2019). Testo 350. Analizador portátil para
hydrocarbons in filterable PM 2,5 emissions emisiones industriales. https://www.testo.
generated from regulated stationary sources com/es-ES/analizador-de-combustion-tes-
in the metropolitan area of Costa Rica. At- to-350/p/0632-3510
mospheric Pollution Research, 8, 843-849. Wang, Y., Lai, N., Mao, G., Zuo, J., Crittenden, J.,
https://doi.org/10.1016/j.apr.2017.01.007 Jin, Y., & Moreno-Cruz, J. (2017). Air pol-
Hu, Y., Li, Z., Wang, Y., Wang, L., Zhu, H., Chen, L., lutant emissions from economic sectors in
... & Liu, A. (2019). Emission factors of NOx, China: A linkage analysis. Ecological Indica-
SO2, PM and VOCs in pharmaceuticals, brick tors, 77, 250-260. https://doi.org/10.1016/j.
and food industries in Shanxi, China. Aero- ecolind.2017.02.016
sol Air Qual. Res, 19, 1785-1797. https://doi. Xie, Y., Dai, H., & Dong, H. (2017). Impacts of SO2
www.revistas.una.ac.cr/uniciencia •
org/10.4209/aaqr.2019.06.0304 taxations and renewable energy development
Instituto Nacional de Estadística y Censo (INEC). on CO2, NOx and SO2 emissions in Jing-Jin-
(2016). Clasificación de actividades Ji region. Journal of Cleaner Production,
económicas en Costa Rica. San José, Cos- 171, 1386-1395. https://doi.org/10.1016/j.
ta Rica. https://www.inec.cr/documento/ jclepro.2017.10.057
inec-2011-clasificacion-de-actividades-eco- Yang, M., Ma, T., & Sun, C. (2018). Evaluating
nomicas-de-costa-rica-manual-de-rama-de the impact of urban traffic investment on
Joos, H., Madonna, E., Witlox, K., Ferrachat, S., SO2 emissions in China cities. Energy Pol-
Wernli, H., & Lohmann, U. (2017). Effect of icy, 113, 20-27. https://doi.org/10.1016/j.
anthropogenic aerosol emissions on precipi- enpol.2017.10.039
revistauniciencia@una.cr
tation in warm conveyor belts in the western Yang, X., Wang, S., Zhang, W., Zhan, D., & Li, J.
North Pacific in winter–a model study with (2017). The impact of anthropogenic emis-
ECHAM6-HAM. Atmospheric Chemistry sions and meteorological conditions on
and Physics, 17(10), 6243-6255. https://doi. the spatial variation of ambient SO2 con-
org/10.5194/acp-17-6243-2017 centrations: a panel study of 113 Chinese
Khude, P. (2017). A review on energy management cities. Science of the Total Environment,
in textile industry. Innov Ener Res, 6(169), 2. 584, 318-328. https://doi.org/10.1016/j.
https://doi.org/10.4172/2576-1463.1000169 scitotenv.2016.12.145
Marć, M., Bielawska, M., Simeonov, V., Namieśnik, Ying, G., Ma, J., & Xing, Y. (2007). Comparison of
J., & Zabiegała, B. (2016). The effect of an- air quality management strategies of PM10,
thropogenic activity on BTEX, NO2, SO2, SO2, and NOx by an industrial source com-
and CO concentrations in urban air of the spa plex model in Beijing. Environmental Prog-
city of Sopot and medium-industrialized city ress, 26(1), 33-42. https://doi.org/10.1002/
of Tczew located in North Poland. Environ- ep.10182
mental research, 147, 513-524. https://doi. Zamtsu. (2019). Contador portátil de partícu-
org/10.1016/j.envres.2016.03.014 las APEX: APEX P3/P5. https://
McGranahan, G. (2012). Air pollution and health www.zamtsu.com/producto/
in rapidly developing countries. Lon- contador-portatil-de-particulas-apex-p3-p5/
dres, Inglaterra: Earthscan. https://doi.
org/10.4324/9781849770460
Daniel Alfaro-Alfaro • Luis Salas-Morelli • Bryan Sánchez-Mejías 12
José Mora-Barrantes • José Pablo Sibaja-Brenes • Henry Borbón-AlpízarDOI: http://dx.doi.org/10.15359/ru.35-2.5
E-ISSN: 2215-3470
CC: BY-NC-ND
Zhang, L., Jacob, D. J., Knipping, E. M., Kumar, N., Zhao, B., Wang, S., Wang, J., Fu, J. S., Liu, T., Xu, J.,
Munger, J. W., Carouge, C. C., van Donke- ... & Hao, J. (2013). Impact of national NOx
laar, A., Wang, Y. X., & Chen, D. (2012). Ni- and SO2 control policies on particulate mat-
trogen deposition to the United States: Distri- ter pollution in China. Atmospheric Environ-
bution, sources, and processes. Atmospheric ment, 77, 453-463. https://doi.org/10.1016/j.
UNICIENCIA Vol. 35, N°. 2, pp. 1-13. July-December, 2021 •
Chemistry and Physics, 12(10), 4539–4554. atmosenv.2013.05.012
https://doi.org/10.5194/acp-12-4539-2012
www.revistas.una.ac.cr/uniciencia •
revistauniciencia@una.cr
Preliminary inventory of atmospheric emissions (SO2, NOx and TSP) from different indus-
trial sectors in Costa Rica (Daniel Alfaro-Alfaro • Luis Salas-Morelli • Bryan Sánchez-Me-
jías • José Mora-Barrantes • José Pablo Sibaja-Brenes • Henry Borbón-Alpízar) Uniciencia
is protected by Attribution-NonCommercial-NoDerivs 3.0 Unported (CC BY-NC-ND 3.0)
Daniel Alfaro-Alfaro • Luis Salas-Morelli • Bryan Sánchez-Mejías 13
José Mora-Barrantes • José Pablo Sibaja-Brenes • Henry Borbón-AlpízarYou can also read