MERGER OF EQUALS BETWEEN ALAMOS GOLD AND AURICO GOLD - CREATING A LEADING INTERMEDIATE GOLD PRODUCER
←
→
Page content transcription
If your browser does not render page correctly, please read the page content below
Merger of Equals Between
Alamos Gold and AuRico Gold
CREATING A LEADING INTERMEDIATE GOLD PRODUCER

                 APRIL 13, 2015
Alamos Cautionary Statement
Cautionary Notes

No stock exchange, securities commission or other regulatory authority has approved or disapproved the information contained herein.

Certain statements in this presentation are “forward-looking statements”, including within the meaning of the United States Securities Exchange Act of 1934, as amended. All statements other than statements of
historical fact included in this presentation, including without limitation statements regarding the timing and closing of the transaction contemplated by the Arrangement Agreement between Alamos and AuRico (the
“Transaction”) whereby Alamos and AuRico will combine to form a new company (“MergeCo”) and create a new company holding certain assets of AuRico (“SpinCo”), statements regarding synergies resulting from
the Transaction, statements regarding the effect of the Transaction on either the MergeCo’s or SpinCo’s net asset value, operating cash flow, free cash flow, forecast gold production, reserves, resources, gold
grades, recoveries, waste-to-ore ratios, total cash cost, all-in sustaining costs, debt levels and future plans and objectives of MergeCo and SpinCo are forward-looking statements based on forecasts of future
operational or financial results, estimates of amounts not yet determinable and assumptions of management that involve various risks and uncertainties. Any statements that express or involve discussions with
respect to predictions, expectations, beliefs, plans, projections, objectives, assumptions or future events or performance (often, but not always, using words or phrases such as “expects” or “does not expect”, “is
expected”, “anticipates” or “does not anticipate”, “plans”, “estimates” or “intends”, or stating that certain actions, events or results “may”, “could”, “would”, “might” or “will” be taken, occur or be achieved) are not
statements of historical fact and may be “forward-looking statements.” Alamos cautions that forward-looking information involves known and unknown risks, uncertainties and other factors that may cause Alamos's,
MergeCo’s or SpinCo’s actual results, performance or achievements to be materially different from those expressed or implied by such information, including, but not limited to, that the Transaction is completed on
terms and timeframe contemplated; failure to obtain shareholder approval of Alamos or AuRico; failure to obtain the necessary regulatory and other approvals; conditions to the proposed transaction may not be
satisfied; anticipated synergies and other benefits of the proposed transaction may not be realized; gold and silver price volatility; fluctuations in foreign exchange rates and interest rates; the impact of any hedging
activities; discrepancies between actual and estimated production, between actual and estimated reserves and resources or between actual and estimated metallurgical recoveries; costs of production; capital
expenditure requirements; the costs and timing of construction and development of new deposits; and the success of exploration and permitting activities. In addition, the factors described or referred to in the
section entitled “Risk Factors” in Alamos' Annual Information Form for the year ended December 31, 2014, which is available on the SEDAR website at www.sedar.com, should be reviewed in conjunction with the
information found in this presentation. Although Alamos has attempted to identify important factors that could cause actual results, performance or achievements to differ materially from those contained in forward-
looking information, there can be other factors that cause results, performance or achievements not to be as anticipated, estimated or intended. There can be no assurance that such information will prove to be
accurate or that management’s expectations or estimates of future developments, circumstances or results will materialize. Accordingly, readers should not place undue reliance on forward-looking information..

Note to U.S. Investors

Alamos prepares its disclosure in accordance with the requirements of securities laws in effect in Canada, which differ from the requirements of U.S. securities laws. Terms relating to mineral resources in this
presentation are defined in accordance with National Instrument 43-101 – Standards of Disclosure for Mineral Projects under the guidelines set out in the Canadian Institute of Mining, Metallurgy, and Petroleum
Standards on Mineral Resources and Mineral Reserves. The United States Securities and Exchange Commission (the “SEC”) permits mining companies, in their filings with the SEC, to disclose only those mineral
deposits that a company can economically and legally extract or produce. Alamos may use certain terms, such as “measured mineral resources”, “indicated mineral resources”, “inferred mineral resources” and
“probable mineral reserves” that the SEC does not recognize (these terms may be used in this presentation and are included in the public filings of Alamos, which have been filed with the SEC and the securities
commissions or similar authorities in Canada).

Cautionary non-GAAP Measures and Additional GAAP Measures

Note that for purposes of this section, GAAP refers to IFRS. Alamos believes that investors use certain non-GAAP and additional GAAP measures as indicators to assess gold mining companies. They are intended
to provide additional information and should not be considered in isolation or as a substitute for measures of performance prepared with GAAP.

Additional GAAP measures that are presented on the face of Alamos’s consolidated statements of comprehensive income include “Mine operating costs”, “Earnings from mine operations” and “Earnings from
operations”. These measures are intended to provide an indication of Alamos’s mine and operating performance. “Cash flow from operating activities before changes in non-cash working capital” is a non-GAAP
performance measure that could provide an indication of Alamos’s ability to generate cash flows from operations, and is calculated by adding back the change in non-cash working capital to “Cash provided by (used
in) operating activities” as presented on Alamos’s consolidated statements of cash flows. “Mining cost per tonne of ore” and “Cost per tonne of ore” are non-GAAP performance measures that could provide an
indication of the mining and processing efficiency and effectiveness of the mine. These measures are calculated by dividing the relevant mining and processing costs and total costs by the tonnes of ore processed in
the period. “Cost per tonne of ore” is usually affected by operating efficiencies and waste-to-ore ratios in the period. “Cash operating costs per ounce”, “total cash costs per ounce” and “all-in sustaining costs per
ounce” as used in this analysis are non-GAAP terms typically used by gold mining companies to assess the level of gross margin available to Alamos by subtracting these costs from the unit price realized during the
period. These non-GAAP terms are also used to assess the ability of a mining company to generate cash flow from operations. There may be some variation in the method of computation of these metrics as
determined by Alamos compared with other mining companies. In this context, “cash operating costs per ounce” reflects the cash operating costs allocated from in-process and dore inventory associated with
ounces of gold sold in the period. “Cash operating costs per ounce” may vary from one period to another due to operating efficiencies, waste-to-ore ratios, grade of ore processed and gold recovery rates in the
period. “Total cash costs per ounce” includes “cash operating costs per ounce” plus applicable royalties. Cash operating costs per ounce and total cash costs per ounce are exclusive of exploration costs. “All-in
sustaining costs per ounce” reflects total mining and processing costs, corporate and administrative costs, exploration costs, sustaining capital, and other operating costs. Non-GAAP and additional GAAP measures
do not have a standardized meaning prescribed under IFRS and therefore may not be comparable to similar measures presented by other companies.

                                                                                       All figures in US$ unless otherwise indicated.

                                                                                                                                                                                                                          2
AuRico Cautionary Statement
This presentation contains certain information that constitutes “forward-looking information” and “forward-looking statements” as defined under Canadian and U.S. securities laws. All statements in this presentation,
other than statements of historical fact, are forward-looking statements. The words “expect”, “believe”, “anticipate”, “contemplate”, “may”, “could”, “will”, “intend”, “estimate”, “forecast”, “target”, “budget”, “schedule”
and similar expressions identify forward-looking statements. Forward-looking statements in this presentation include, without limitation, statements with respect to our expectations on underground productivity levels,
underground unit mining cost, underground development, mill facility processing rate, cash flow, free cash flow, cash costs, capital investment and timing to completion on the final leg of the Northgate production
shaft, information as to our strategy, plans and future financial and operating performance, such as our expansion plans, project timelines, production plans, projected cash flows or capital expenditure levels, cost
estimates, mining or milling methods, projected exploration results, resource and reserve estimates, other statements that express our expectations or estimates of future performance, the success of exploration
activities, our ability to delineate additional resources and reserves as a result of such programs, statements regarding the advancement of the Lynn Lake district, the completion of a feasibility study on the Lynn
Lake Project within the indicated timeframe, mineral reserves and mineral resources and anticipated grades, exploration expenditures, costs and timing of any future development, costs and timing of future
exploration and our intentions regarding our investment in Carlisle, the presence of and continuity of metals at Kemess East at modeled grades.

Forward-looking statements are necessarily based upon a number of factors and assumptions that, while considered reasonable by management at the time of making such statements, are inherently subject to
significant business, economic and competitive uncertainties and contingencies. Known and unknown factors could cause actual results to differ materially from those projected in the forward-looking statements.
Such factors and assumptions underlying the forward-looking statements in this presentation include, but are not limited to: changes to current estimates of mineral reserves and resources; fluctuations in the price
of gold; changes in foreign exchange rates (particularly the Canadian dollar, Mexican peso and U.S. dollar); the impact of inflation; changes in our credit rating; any decision to declare a quarterly dividend; employee
relations; litigation; disruptions affecting operations; availability of and increased costs associated with mining inputs and labor; development delays at the Young-Davidson mine; operating or technical difficulties in
connection with mining or development activities; inherent risks associated with mining and mineral processing; the risk that the Young-Davidson and El Chanate mines may not perform as planned; uncertainty with
our ability to secure capital to execute our business plans; the speculative nature of mineral exploration and development, including the risks of obtaining necessary licenses, permits, authorizations and/or approvals
from the appropriate regulatory authorities for the Kemess Underground and Lynn Lake projects; contests over title to properties; changes in national and local government legislation in Canada, Mexico and other
jurisdictions in which we carry on or may carry on business in the future; risk of loss due to sabotage and civil disturbances; the impact of global liquidity and credit availability and the values of assets and liabilities
based on projected future cash flows; risks arising from holding derivative instruments; business opportunities that may be pursued by us, as well as those factors discussed under “Risk Factors” in our most recent
Form 40-F / Annual Information Form.

Actual results and developments are likely to differ, and may differ materially, from those expressed or implied by the forward-looking statements contained in this presentation. Such statements are based on a
number of assumptions which may prove to be incorrect, including, but not limited to, the assumptions set forth in our most recent Form 40-F/Annual Information Form. Readers are cautioned that forward-looking
statements are not guarantees of future performance. All of the forward-looking statements made in this presentation are qualified by these cautionary statements. Specific reference is made to the most recent
Form 40-F/Annual Information Form on file with the SEC and Canadian provincial securities regulatory authorities for a discussion of some of the factors underlying forward-looking statements.

There can be no assurance that forward-looking statements or information will prove to be accurate. Accordingly, investors should not place undue reliance on the forward-looking statements or information
contained herein. We disclaim any intention or obligation to update or revise any forward-looking statements whether as a result of new information, future events or otherwise, except as required by applicable law.

                                                            Cautionary Note to U.S. Investors Concerning Measured, Indicated and Inferred Resources

This presentation uses the terms "measured", "indicated" and "inferred” resources. We advise investors that while those terms are recognized and required by Canadian regulations, the United States Securities and
Exchange Commission does not recognize them. “Inferred resources” have a great amount of uncertainty as to their existence and as to their economic and legal feasibility. It cannot be assumed that all or any part
of an inferred resource will ever be upgraded to a higher category. Under Canadian rules, estimates of inferred mineral resources may not form the basis of feasibility or other economic studies. United States
investors are cautioned not to assume that all or any part of measured or indicated mineral resources will ever be converted into mineral reserves. United States investors are also cautioned not to assume that all or
any part of an inferred mineral resource exists, or is economically or legally mineable.

                                                                                                                                                                                                                             3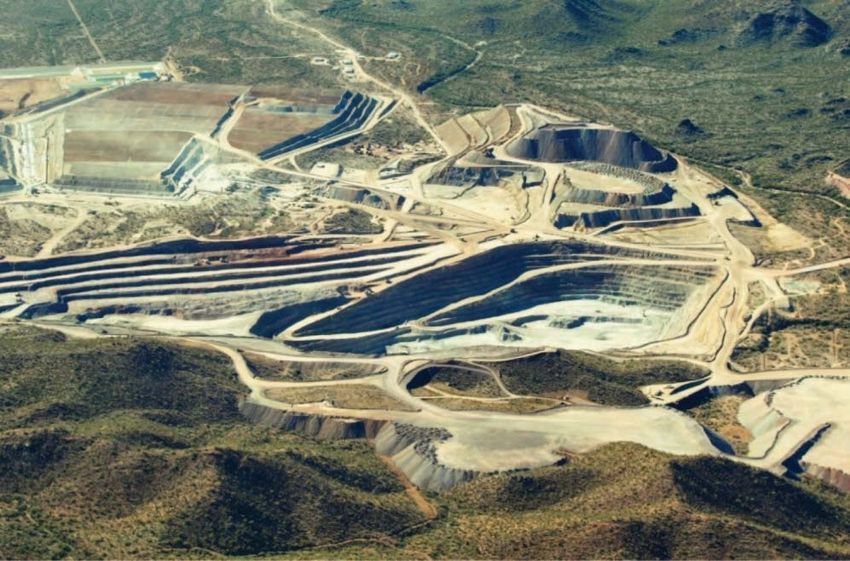
Call Participants

                 John McCluskey                          Scott Perry
        President & Chief Executive Officer   President & Chief Executive Officer

                  Jamie Porter                        Peter MacPhail
              Chief Financial Officer           EVP & Chief Operating Officer

                Charles Tarnocai                         Chris Richter
           VP, Corporate Development             SVP, Corporate Development

                                                                                    4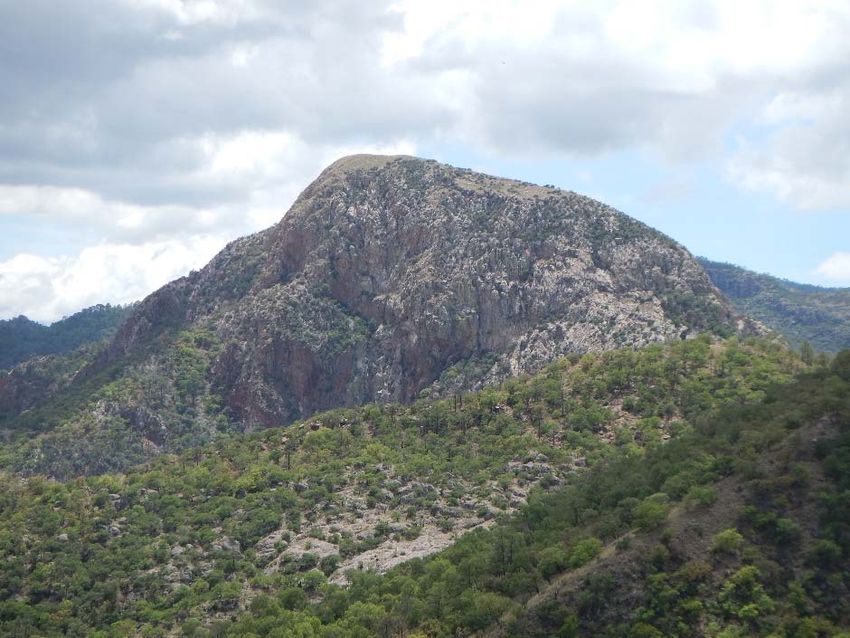
Transaction Rationale

      • Creation of a leading intermediate gold producer with diversified production from three North
        American mines
           ‐ Two flagship, long‐life mines in Young‐Davidson and Mulatos
           ‐ Additional steady state production from El Chanate
      • Peer‐leading production growth profile from high‐quality assets in safe jurisdictions
           ‐ Expected production of 375‐425k oz Au in 2015 – potential to grow to over 700k oz Au annually
           ‐ Anchored by low‐cost Kirazlı, Ağı Dağı & Esperanza advanced stage development projects
           ‐ Further long‐term growth through Lynn Lake and Quartz Mountain
      • Strong combined balance sheet
           ‐ Positive net cash position and growing cash flow generation to fund organic growth
      • Enhanced market attractiveness
           ‐ Increased trading liquidity
           ‐ Realization of meaningful synergies in Canada and Mexico
           ‐ Participation in an attractive SpinCo with significant unlocked value in the Kemess project,
              diversified royalty revenues and led by a strong management team
      • Compelling merger of equals that combines two complementary and highly experienced teams
           ‐ Premier mine building and evaluation teams to unlock full value of portfolio

Source: Company disclosure.
                                                                                                        5
Setting A New Standard

                                                                     •      Merger of equals transaction with 50/50 pro forma ownership
                                                                     •      Total transaction value of ~US$1.5 billion
                                                                     •      SpinCo (to be distributed to all MergeCo shareholders) comprised of:
                                                                                ‐ the Kemess project located in British Columbia;
                     Transaction                                                ‐ a 1.5% NSR royalty on the Young‐Davidson mine in Ontario;
                      Summary                                                   ‐ the existing 2% and 1% NSR royalties on the Fosterville and Stawell mines in Australia; and
                                                                                ‐ US$20MM in cash
                                                                     •      MergeCo to retain a 4.9% interest in SpinCo
                                                                     •      Alamos private placement into AuRico for 9.9% interest at a price of US$2.99 per share (1), for total gross
                                                                            proceeds to AuRico of ~US$83 million (not contingent on completion of merger transaction)
                                                                     •      Each Alamos share will be exchanged for 1 MergeCo share, 1 SpinCo share and US$0.0001 cash
                  Consideration                                      •      Each AuRico share will be exchanged for 0.5046 MergeCo shares and 0.5046 SpinCo shares
                                                                     •      Structured as a plan of arrangement
                       Conditions                                    •      66⅔% shareholder approvals required for both companies
                                                                     •      Customary regulatory and court approvals
                                                                     •      MergeCo board to consist of ten members, with equal contribution from both companies
                     Governance                                      •      MergeCo to be headed by John McCluskey as CEO and Alan Edwards as Chairman
                                                                     •      SpinCo to be headed by Chris Richter as CEO, Robert Chausse as CFO and Scott Perry as Executive Chairman
                                                                     •      Unanimous support of the Board of Directors of both Alamos and AuRico
                                                                     •      Senior officer and director lock‐ups
                             Other                                   •      Customary non‐solicitation covenants, subject to normal fiduciary outs, and right to match
                                                                     •      US$28.4 million termination fee payable to Alamos, US$37.5 million termination fee payable to AuRico

                         Timeline                                    •      Shareholder meetings and transaction expected to close in Q2

(1)   Equal to AuRico’s closing price on the New York Stock Exchange on April 10, 2015.
                                                                                                                                                                                          6
MergeCo Capitalization Summary

                                                                                                     Units                              Alamos                    AuRico   MergeCo (1)

                                         Share Price (NYSE)                                          (US$)                                $5.89                   $2.99      $5.89

                                   Basic Shares Outstanding                                          (MM)                                 127.4                   253.5      254.8

                                 Basic Market Capitalization                                     (US$MM)                                  $750                    $758       $1,501

                                         Cash & Short‐Term
                                                                                                 (US$MM)                                  $358                     $89        $427
                                            Investments

                                                       Debt                                      (US$MM)                                      ‐‐                  $333        $333

                                           Enterprise Value                                      (US$MM)                                  $392                    $1,002     $1,406

Source: Company disclosure and FactSet.
Note: Based on audited annual financial statements for each company for the period ended December 31, 2014.                                                                              7
(1) MergeCo figures calculated based on Alamos’ April 10, 2015 closing price on the NYSE. MergeCo cash balance adjusted for US$20MM cash transferred to SpinCo.
Benefits to All Shareholders

       Diversified
                           •   High quality, diversified gold production from three North American mines
       production

     Leading growth        •   Extensive portfolio of low cost development stage assets in safe jurisdictions that can be
         profile               advanced in a disciplined manner

                           •   Strong combined balance sheet with increased financial flexibility
     Strong financial
                           •   Superior cash flow growth profile
         position
                           •   Significant synergies

                           •   Leading intermediate gold producer with a robust growth profile and diversified asset base
   Significant re‐rating
                           •   Enhanced capital markets attractiveness
         potential
                           •   Increased trading liquidity

    Complementary          •   Combination of two complementary and highly experienced teams
   management teams        •   Significant open pit, heap leach and underground mining expertise

                           •   Significant unlocked value in Kemess project
       Exposure to
                           •   Diversified royalty revenues
         SpinCo
                           •   Strong management team

                                                                                                                            8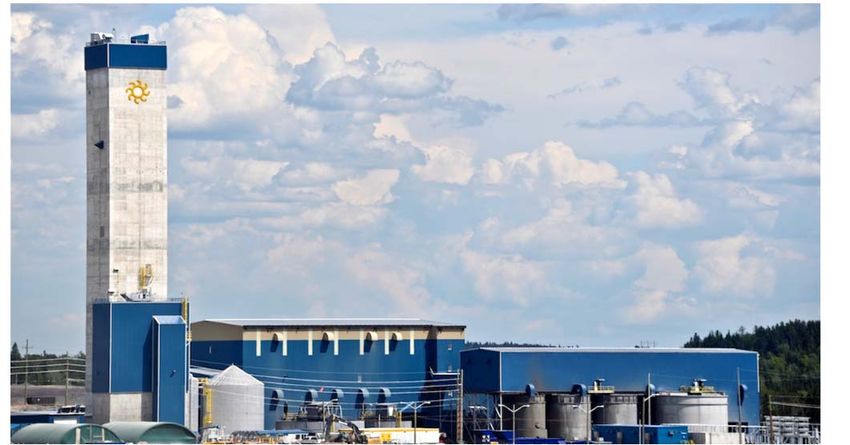
MergeCo Portfolio – Best In Class

                                                                   LYNN LAKE JV (25%)(2)
                                                                   Stage                                   Feasibility
                                                                   Est. Annual Production                   145k oz
                                                                   Est. Cash Costs                        US$530/oz                          YOUNG‐DAVIDSON
                                                                   Att. Au Resources                       1.2MM oz
                                                                                                                                             2015E Au Production            160‐180k oz
                                                                                                                                             2015E Au Cash Costs           US$675‐775/oz
                     QUARTZ MOUNTAIN                                                                                                         2P Au Reserves                  3.8MM oz
                                                            Advanced                                                                         Total Au Resources              5.6MM oz
                     Stage
                                                           Exploration
                     Total Au Resources                     2.8MM oz
                                                                                                                                                                   AĞI DAĞI
         MULATOS                                                                                                       Toronto                                     Stage                     Permitting
         2015E Au Production                   150‐170k oz                                                            Head Office                                  Est. Annual Production      143k oz
         2015E Au Cash Costs (1)                US$800/oz                                                                                                          Est. Cash Costs           US$611/oz
         2P Au Reserves                          1.7MM oz                                                                                                          Total Au Resources         1.9MM oz
         Total Au Resources                      4.8MM oz
                                                                                                                                                                   KIRAZLI
         EL CHANATE                                                                                                                                                Stage                     Permitting
         2015E Au Production                     65‐75k oz                                                                                                         Est. Annual Production      99k oz
         2015E Au Cash Costs                 US$675‐775/oz                                                                                                         Est. Cash Costs           US$515/oz
         2P Au Reserves                          0.6MM oz                                                                                                          Total Au Resources         0.9MM oz
         Total Au Resources                      0.7MM oz
                                                                                                                                                                  ÇAMYURT

                        ORION JV (50%)                                                                                                                            Stage                     Resource Dev.
                                                                                                   ESPERANZA                                                      Total Au Resources         0.6MM oz
                        Stage                                  Exploration
                        Att. Au Resources                      0.1MM oz                            Stage                                   Permitting
                                                                                                   Est. Annual Production                   +100k oz
                                                                                                   Est. Cash Costs                        ~US$500/oz
                                                                                                                                                                                               Producing Assets
                                                                                                   Total Au Resources                      1.1MM oz
                                                                                                                                                                                               Exploration / Development Assets

Source: Company disclosure.
Note: Resources inclusive of reserves. See slides 31 to 36 for detailed information regarding mineral reserves and resources for Alamos and AuRico.                                                                               9
(1) Exclusive of royalties. (2) Option to earn an additional 35% interest in the project.
Diversified Portfolio of Quality Assets

       Producing Assets in Top Mining Jurisdictions

                                           •   Young-Davidson (Canada): Flagship long-life underground gold mine
                                           •   Mulatos (Mexico): Flagship open pit, heap leach operation
                                           •   El Chanate (Mexico): Stable open pit, heap leach operation

                              Strong Development Pipeline

                                                        •   Kirazlı, Ağı Dağı & Çamyurt (Turkey): Advanced stage, low cost, open pit, heap
                                                            leach development projects
                                                        •   Esperanza (Mexico): Low cost, low capital intensity open pit, heap leach project
                                                        •   Lynn Lake (Canada): Advanced high-grade open pit gold project

                                         Exploration

                                                                     •   Quartz Mountain (USA): Advanced exploration project with large
                                                                         resource
                                                                     •   Orion (Mexico): 50% ownership with Minera Frisco S.A. de C.V.

                                           Combined annual production potential > 700k oz
Source: Company disclosure.
                                                                                                                                         10
Strong Organic Growth Profile
Consensus Gold Production (k oz) Consensus Operating Cash Flow (US$MM)(1)
900 $500
800
$400
Operating Cash Flow (US$MM)
700
Gold Production (k oz)
$300
600
500
$200
400
$100
300
200 $0
2015E 2016E 2017E 2018E Y‐D, Mul a tos , 2015E 2016E 2017E 2018E Y‐D, Mul a tos ,
(Midpoint of El Cha na te, El Cha na te,
Guidance) Es pera nza , Turkey, Es pera nza , Turkey,
Qua rtz Mounta i n, Qua rtz Mounta i n,
Lynn La ke Lynn La ke
Source: Analyst estimates.
(1) Consensus operating cash flow estimates adjusted for royalties transferred to SpinCo and potential synergies realized by MergeCo. 11Larger, Diversified Portfolio in Safe
Political Jurisdictions
Gold Mineral Reserves & Resources (MM oz) Pro Forma Asset Breakdown (2)
Consensus NPV by Geography
P&P Reserves Total Reserves & Resources (1) Turkey
17%
19.7 Canada
50%
Mexico
33%
Consensus NPV by Stage
6.2 Development
23% Production
77%
P&P Reserves Total Reserves & Resources
Source: Company disclosure and analyst estimates.
Note: See slides 31 to 36 for detailed information regarding mineral reserves and resources for Alamos and AuRico. 12
(1) M&I and inferred resources inclusive of P&P reserves. (2) Adjusted for 1.5% NSR royalty on Young‐Davidson transferred to SpinCo.Strong Financial Foundation
Basic Market Capitalization (US$Bn)
$2.8
$1.8
$1.6 $1.5 $1.4
$1.2
$1.0
$0.8 $0.8 $0.8 $0.7 $0.6
Tahoe New Gold Detour MergeCo B2Gold Centerra SEMAFO IAMGOLD AuRico Alamos Alacer Primero
Net Cash / (Debt) (US$MM)
$358 $347 $319
$234
$126 $94
$21
($74)
($244) ($274)
($365)
($517)
Alamos Alacer Centerra IAMGOLD Tahoe MergeCo(1) SEMAFO Primero AuRico B2Gold Detour New Gold
Source: Company disclosure and FactSet.
(1) Based on audited annual financial statements for each company for the period ended December 31, 2014. Adjusted for US$20MM cash transferred to SpinCo. 13Peer Leading Production Growth
2015E – 2018E Average Consensus Gold Production (k oz)
799
710
625
565 551 528
435
298
258
151
(1)
IAMGOLD B2Gold Tahoe Detour Centerra MergeCo New Gold SEMAFO Primero Alacer
2015E – 2018E Consensus Gold Production Growth (%)
80% 77%
70%
33% 31% 29%
20% 16%
6%
(14%)
MergeCo SEMAFO B2Gold Tahoe (1) Primero New Gold Detour Alacer Centerra IAMGOLD
Source: Analyst estimates.
(1) Based on Au Eq. figures; Au Eq. figures based on long‐term consensus metal price estimates. 14Compelling Valuation
Consensus P/NAV
Premium Intermediate Multiples
1.4x
1.3x
1.0x 1.0x 0.9x 0.9x
0.8x 0.8x
0.7x 0.7x 0.7x 0.7x
Agnico Eagle Randgold SEMAFO Tahoe New Gold Alacer B2Gold Primero MergeCo IAMGOLD Centerra Detour
Enterprise Value / Gold Resources (US$/oz)
Premium Intermediate Multiples
$236
$157
$128 $125
$113
$93 $82 $78 $71 $60
$47
$17
Randgold Agnico Eagle SEMAFO Primero Tahoe (1) Detour B2Gold New Gold MergeCo Centerra Alacer IAMGOLD
Source: Analyst estimates, company disclosure and FactSet.
(1) Based on Au Eq. figures; Au Eq. figures based on long‐term consensus metal price estimates. 15MergeCo Leadership
Executive Team Board of Directors
• John McCluskey – President, CEO & Director • Alan Edwards – Chairman
‐ Current President, CEO & Director of Alamos ‐ Current Chairman of AuRico
‐ Over 30 years of industry experience ‐ Over 30 years of industry experience
‐ Previously founded Grayd Resource Corporation and Co‐ ‐ Former CEO of Oracle Mining, President & CEO of Copper
founded Alamos One, CEO of Frontera Copper, and EVP & COO of Apex Silver
Mines
• Peter MacPhail – COO
‐ Current COO of AuRico • John McCluskey – President, CEO & Director
‐ Over 25 years of industry experience
‐ Formerly COO of Northgate Minerals • Scott Perry
‐ Current President, CEO and Director of AuRico
• Jamie Porter – CFO ‐ Over 17 years of industry experience
‐ Current CFO of Alamos ‐ Previously held senior roles with Barrick and Highland Gold
‐ Over 15 years of industry experience Mining
‐ Former Controller and Vice President of Finance for Alamos
• Remaining directors to be nominated upon completion of the
transaction
16SpinCo Overview
• MergeCo to own 4.9% of SpinCo
Ownership
• Balance to be owned by Alamos and shareholders on a 50/50 basis
• Kemess is a high‐quality, copper‐gold porphyry development project located in a safe jurisdiction
High‐
• Long‐life and growing cash flow from Young‐Davidson 1.5% NSR
Quality
Assets • Royalties on two gold mines with a track record of reserve replacement ‐ Fosterville (2% NSR) and
Stawell (1% NSR)
• Creation of well‐funded, cash flowing company with significant growth potential
• Potential to unlock significant value of Kemess and the royalties
Investment • Complementary asset base as royalty income funds Kemess advancement
Highlights • Removes Kemess financing requirement from MergeCo
• Strong management led by Chris Richter as CEO, Robert Chausse as CFO and Scott Perry as Executive
Chairman
Balance
• US$20 million cash
Sheet
Kemess Young‐Davidson Fosterville Stawell
Source: Company disclosure.
17The New Intermediate Producer
• Two flagship, long‐life assets in mining friendly jurisdictions
• Leading growth profile with extensive portfolio of quality development stage assets
• Significant exploration potential at all existing operations
• Strong financial position and cash flow generation to fund future growth organically
• Enhanced capital markets profile and increased liquidity
• Significant re‐rating potential as a leading intermediate, with production growth
from ~400k oz of gold in 2015 to over 700k oz annually
• Proven management team with successful track record of building and operating
mines globally
• Exposure to SpinCo with significant unlocked value in the Kemess project, diversified
royalty revenues and led by a strong management team
Building a well financed, diversified leader in the intermediate gold sector
18ALAMOS GOLD INC.
Scott K. Parsons, CFA
Director, Investor Relations
416.368.9932 x 439
sparsons@alamosgold.com
AURICO GOLD INC.
Anne Day
Vice President, Investor Relations and Communications
647.260.8880
anne.day@auricogold.comAPPENDIX
Young‐Davidson Mine
     Location: Ontario                                                                                                                                  2013    2014       2015E
     Ownership: 100% interest                                                                                        Gold Production (k oz)             120.7   156.8     160‐180

     Stage: Producing                                                                                                 Underground Cash Costs (US$/oz)   $663    $719      $600‐700
                                                                                                                      Open Pit Cash Costs (US$/oz)      $757    $1,071 $1,100‐1,200

     • One of Canada’s largest underground gold mines                                                                Total Cash Costs (US$/oz)          $744    $825      $675‐775
                                                                                                                     Capital Investment (US$MM)         $191    $135       $85‐95
     • Young‐Davidson underground commenced
                                                                                                                     Projected Asset Life (years)                  +20
       commercial production in October 2013
                                                                                                                     P&P Au Reserves (MM oz)                       3.8
             ‐ Open pit mine in operation from September 2012
                                                                                                                      P&P Au Grade (g/t)                           2.63
               to June 2014
                                                                                                                     Total Au Resources (MM oz)                    5.6
     • In 2014, produced 157k oz Au at cash costs of
                                                                                                                      Total Au Resources Grade (g/t)               2.72
       US$825/oz Au
     • The ramp‐up at the underground operation is
       expected to increase production by up to 14% in
       2015 to be in the range of 160‐180k oz
     • Cash costs are expected to decline by up to 18% to
       between US$675‐775/oz and all‐in sustaining costs
       expected to decline by up to 12% to between
       US$950‐US$1,050/oz
     • 15 year mine life based on year end 2014 reserves
     • Large resource base and exploration potential to
       support mine life extension
Source: Company disclosure.
Note: See slides 31 to 36 for detailed information regarding mineral reserves and resources for Alamos and AuRico.                                                              21
Young‐Davidson Ramp‐Up
Production Ramp‐Up (Year End Exit Rates)
• In 2014, accelerated capital investment initiatives
supported higher than expected productivity 8,000 8,000
throughout the underground operation
6,000
‐ Young‐Davidson exceeded the year‐end target of
Ore Tonnes per Day
240 240
U/G miners
4,000 tpd 4,140
U/G miners
• The shaft hoisting system will continue to facilitate 3,000 207
U/G miners
YE target of
significant increases in underground activities and 4,000tpd
corresponding cost efficiencies YE target of
2,000tpd 170
U/G miners
• Young‐Davidson is well positioned to achieve the 2015 2013 2014 2015E 2016E 2017E
year‐end target of 6,000 tpd and an ultimate
productivity level of 8,000 tpd at the end of 2016
Significant Gold Production Growth
• Underground ramp‐up is expected to drive down the
underground unit costs by 17% in 2015 250
200
Gold Ounces (koz)
150
100
50
-
2012 2013 2014 2015E 2016E 2017E
Source: Company disclosure.
22Mulatos Mine
Location: Sonora State, Mexico 2013 2014 2015E
Ownership: 100% interest Gold Production (k oz) 190.0 140.5 150‐170
Stage: Producing Total Cash Costs (US$/oz) $496 $703 $865(1)
Capital Investment (US$MM) $39.6 $51.9 $40.6
• Conventional open pit, heap leach operation Current Reserve Life (years) 7
P&P Au Reserves (MM oz) 1.7
• Achieved commercial production in 2006
P&P Au Grade (g/t) 1.16
• Through expansion and productivity improvements Total Au Resources (MM oz) 4.8
processing rate has increased from 10k to 17.9k tpd
Total Au Resources Grade (g/t) 1.11
• High grade San Carlos underground ore processed
through gravity‐flotation mill
• Higher leach pad grades and lower strip expected to
benefit costs in 2016
• Generated ~$350m in free cash flow to date
• Mine life of 7 years based on YE 2014 reserves
• Large resource base and exploration package of
30.3k ha to support further mine life expansion
Source: Company disclosure.
Note: See slides 31 to 36 for detailed information regarding mineral reserves and resources for Alamos and AuRico. 23
(1) Inclusive of royalties, assuming a US$1,200/oz gold price.Mulatos Mine – Lower Costs in 2016 & ‘17
Lower Costs in 2016 Higher Production, Lower Costs in 2017
Open Pit, Heap Leach Grade (g/t) • Low cost production growth from La Yaqui in Q4
2016 & Cerro Pelon in 2017
1.00
+18% • Production additive
‐ Average production of 33k oz per year
0.90
0.80 ‐ Average total cash costs US$490/oz
0.70 0.94
0.60 0.80 • Significant exploration potential
0.50
2015 Guidance Mineral Reserve Grade
(2014)
Strip Ratio
1.30
‐19%
1.10
0.90
1.27
1.03
0.70
2015 Guidance LOM Remaining Strip
Ratio (2014)
Source: Company disclosure.
24El Chanate Mine
Location: Sonora State, Mexico 2014 2015E
Ownership: 100% Interest Gold Production (k oz) 67.3 65‐75
Stage: Production Total Cash Costs (US$/oz) $669 $675‐775
Capital Investment (US$MM) $26.1 $17.5‐20
• Open pit, heap leach operation P&P Au Reserves (MM oz) 0.646
P&P Au Grade (g/t) 0.74
• Consistent production of up to 75k oz Au since
AuRico acquired the asset in 2011
• 2014 Au production of 67k oz at cash costs of
US$669/oz
• 2015 Au production guidance of 65‐75k oz Au at
cash costs of US$675‐775/oz and all‐in sustaining
costs of US$950‐1,050/oz
• In 2015, drilling will be focused on the expanded
land package located along the prospective El
Chanate Trend
Source: Company disclosure.
Note: See slides 31 to 36 for detailed information regarding mineral reserves and resources for Alamos and AuRico. 25Kirazlı Project
Location: Turkey
Ownership: 100% interest
Stage: Development
• Low cost, low capital intensity conventional open pit,
heap leach project
• After‐tax IRR of 39% as per June 2012 pre‐feasibility
study
• No material increase in capital expected from 2012
PFS
• Operating costs expected to benefit from
‐ Depreciation of Turkish Lira
‐ Decrease in diesel price (US$ in Turkey) 2012 Pre‐Feasibility Study Highlights
Projected Mine Life (years) 5
Throughput (tpd) 15,000
LOM Avg. Au Grade (g/t) 0.75
LOM Avg. Annual Production 99k oz Au / 601k oz Ag
LOM Avg. Total Cash Costs (US$/oz) $515
Development Capex (US$MM) $146
Total Capex (US$MM) $166
Source: Company disclosure.
26Ağı Dağı Project
Location: Turkey
Ownership: 100% interest
Stage: Development
• Conventional open pit, heap leach project
• Positive cash flows from Kirazlı is expected to
subsidize the construction of Ağı Dağı
• Significant opportunities to enhance economics
through the following:
- Incorporating higher grade Çamyurt deposit
- Steeper pit slopes
- Portions of deposit not drilled due to location in 2012 Pre‐Feasibility Study Highlights
water protection zones – protections to be
removed with construction of reservoir Projected Mine Life (years) 7
- Relatively unexplored – further drilling required Throughput (tpd) 30,000
on portions of deposit with forestry permits LOM Avg. Au Grade (g/t) 0.55
LOM Avg. Annual Production 143k oz Au / 271k oz Ag
LOM Avg. Total Cash Costs (US$/oz) $611
Development Capex (US$MM) $278
Total Capex (US$MM) $327
Source: Company disclosure.
27Esperanza Gold Project
Location: Morelos State, Mexico
Ownership: 100% Interest
Stage: Development
• Low cost, low capital intensity open pit, heap leach
project
• Excellent infrastructure; low technical risk
• Average annual production potential >100k oz
• All‐in sustaining costs expected to be ~US$750/oz
• Strong support from local community
• EIA resubmission planned in H1 2015 2011 Preliminary Economic Assessment Highlights
Avg. Annual Gold Production (k oz) 103
Cash Costs (net of by‐products) (US$/oz) $499
Initial Capex (US$MM) $114
Sustaining Capex (US$MM) $7
Gold Recoveries (%) 75%
Silver Recoveries (%) 25%
LOM Strip Ratio (W:O) 2.2
After‐Tax NPV5% (US$MM) $122
Metal Price Assumptions (US$/oz) Au ‐ $1,150 / Ag ‐ $21
Source: Company disclosure.
28Quartz Mountain Project
Location: Oregon, United States
Ownership: Right to earn a 100% interest
Stage: Advanced exploration
• Located on northern extension of the prolific Basin and
Range Province of Nevada
• Acquisition cost $3.5MM, with additional C$3MM due on
completion of feasibility study and C$15MM or 2% NSR
upon successful permitting
• Low strip ratio, favourable metallurgy (1)
• Initial drill permit granted in Q3 2014
• 8,000m exploration program currently underway
• Inferred gold resource of 2.8MM oz at 0.8 g/t (2)
Quartz Butte
• Significant exploration potential on existing projects,
recently acquired land package
Crone Hill
Source: Company disclosure.
(1) Historic column recovery tests for gold at Quartz Mountain varied between 74% and 88% for the felsic rock hosted mineralization; see Orsa Ventures press release dated February 12, 2013. 29
(2) See slides 31 to 36 for detailed information regarding mineral reserves and resources for Alamos and AuRico.Lynn Lake Project
Location: Manitoba, Canada 2014 Preliminary Economic Assessment Highlights (1)
Ownership: 25% (earn‐in up to 60%)
Mine Type Open Pit
Stage: Feasibility study Au Grade (g/t) 2.2
Au M&I Resources (MM oz) 1.5
• Strategic, low‐risk opportunity in early‐stage, highly‐ Avg. LOM Annual Mill Production (k oz) 145
prospective Lynn Lake Mining District
Avg. LOM Cash Costs (C$/oz) $530
• Significant new value creating opportunity following Initial Capex (C$MM) $185
inexpensive C$10MM upfront investment (2014) Projected Mine Life (years) 12
• One of the highest grade open pit deposits in Canada NPV5% (C$MM) $257
with significant exploration potential Metal Price Assumptions (US$/oz) Au ‐ $1,100 / Ag ‐ $18
• Existing infrastructure in place, low power rates of
C$0.027/kwh Life of Mine Production Profile (1)
• Significant 2015 resource delineation and extension 250
drilling program ($5MM to $10MM)
200
• MergeCo is the operator and has controlling Gold (k ounces per year)
representation on management committee 150
• Right to earn a 60% ownership interest by funding up 100
to C$20MM over 3 years and delivering a feasibility
study 50
0
1 2 3 4 5 6 7 8 9 10 11 12
Life of Mine (years)
Source: Company disclosure.
(1) For more information regarding the Lynn Lake District, please refer to the press release issued by Carlisle Goldfields dated February 27, 2014 titled 30
Carlisle Announces Optimized PEA of the Farley and MacLellan deposits at Lynn Lake returns Post‐Tax IRR of 26.3% at US$1,100 gold price.Alamos Mineral Reserve Estimates
Proven and Probable Reserves
as at December 31, 2014
Tonnes Grade Contained Metals (000's)
(000's) Au (g/t) Au (oz)
Mulatos Mine 36,025 0.94 1,088
UG Reserves 679 6.72 146
Existing Stockpiles 5,720 1.51 277
La Yaqui 1,574 1.58 80
Cerro Pelon 2,617 1.67 141
Total 46,615 1.16 1,732
Note: See slide 33 for notes to reserves and resources.
31Alamos Mineral Resource Estimates
Total Measured & Indicated Resources Total Inferred Resources
as at December 31, 2014 as at December 31, 2014
Cut‐off Tonnes Grade Contained Metals (000's) Tonnes Grade Contained Metals (000's)
(g/t) (000's) Au (g/t) Ag (g/t) Au (oz) Ag (oz) (000's) Au (g/t) Ag (g/t) Au (oz) Ag (oz)
Mexico
Mulatos 0.5 76,850 1.06 2,625 6,629 0.98 209
San Carlos UG 2.5 505 5.64 92 403 4.53 59
El Realito 0.3 1,581 1.06 54 91 0.73 2
Carricito 0.3 1,355 0.82 36 900 0.74 22
Esperanza 0.4 34,352 0.98 8.09 1,083 8,936 718 0.80 15.04 18 347
Total 114,643 1.06 8.09 3,889 8,936 8,741 1.10 15.04 309 347
Turkey
Agi Dagi 0.2 90,052 0.59 4.09 1,695 11,849 16,760 0.46 2.85 245 1,534
Kirazli 0.2 32,734 0.72 8.74 758 9,202 5,689 0.59 8.96 108 1,638
Camyurt 0.2 17,721 0.89 6.14 509 3,496 2,791 0.95 5.77 85 518
Total 140,507 0.66 5.36 2,961 24,548 25,240 0.54 4.55 438 3,690
United States
0.21 Oxide
Quartz Mountain 110,448 0.80 2,848
0.58 sulphide
Combined Total 6,850 33,484 3,595 4,037
Note: See slide 33 for notes to reserves and resources.
32Alamos Notes to Reserve &
Resource Estimates
Notes to Mineral Reserve and Resource tables:
• The Company’s mineral reserves as at December 31, 2014 are classified in accordance with the Canadian Institute of Mining Metallurgy and Petroleum’s “CIM Standards on Mineral
Resources and Reserves, Definition and Guidelines” as per Canadian Securities Administrator’s NI 43-101 requirements.
• Tonnes are rounded to the closest “000s” and grades are rounded to the closest “0.00”s.
• The mineral reserve estimate for the Mulatos Mine incorporates the Estrella, Escondida, Puerto del Aire, El Salto, Mina Vieja, El Victor, and San Carlos areas.
• Mineral reserve cut-off grade for the Mulatos Mine is determined as a net of process value of $0.10 per tonne for each model block. The determination was based on a $1,250 per
ounce gold price, a December 31, 2014 resource and recovery model, and the 2015 budget costs based on the actual cost figures from current mining operations.
• Pit-contained mineral reserves for the San Carlos include 740,000 tonnes grading 1.33 g/t Au for 31,566 ounces.
• Underground reserves are design-contained and reported at a 3.27 g/t Au cut-off grade, with a 5% mining loss and 10% dilution at a 0.0 g/t Au grade, a 75% mill recovery, and an
incremental cut-off grade of 1.16 g/t Au.
• Mineral reserve gold cut-off grade for the La Yaqui Pit is a 0.30 g/t gold. The determination was based on a $1,250 per ounce gold price, a May 2009 resource model, gold recovery
from mining operations, and the 2015 budget costs based on the actual cost figures from mining operations.
• Mineral reserve gold cut-off grade for the Cerro Pelon Pit is determined as a net of process value of $0.10 per tonne, for each model block. The determination was based on a $1,250
per ounce gold price, a November 2009 resource model, gold recovery from mining operations, and the 2015 budget costs based on the actual cost figures from mining operations.
• The updated mineral resource estimate at Mulatos incorporates the Estrella, Escondida, Puerto del Aire, El Salto, Mina Vieja, El Victor, and San Carlos areas.
• In-pit measured and indicated mineral resource blocks are exclusive of pit-contained reserves.
• Measured and indicated and inferred mineral resources outside of the Mulatos Mine have no economic restrictions and are tabulated by gold cut-off grade.
• Measured and indicated and inferred resources at Carricito and El Realito are pit-constrained, applying a $1,400/oz gold price, 55° pit slopes, and a $2.52/t mining cost, $9.11/t
process + G&A cost.
• Measured and indicated and inferred resources for the Ağı Dağı project, which includes the Baba, Ayitepe, Deli, and Fire Tower zones, are pit constrained with cut-off determined as
a net of process value of $0.10 per tonne, for each model block. The determination was based on a US$1,400 per ounce gold price and a US$22.00 per ounce silver price, a
December 31, 2013 resource model, pit slope angles ranging from 40° to 48°, and estimated costs and recoveries based on the pre-feasibility study specifications. The resources
were then tabulated by gold cut-off grade.
• Measured and indicated, and inferred resources for the Kirazli project, including Rockpile, are pit constrained with cut-off determined as a net of process value of $0.10 per tonne, for
each model block. The determination was based on a US$1,400 per ounce gold price and a US$22.00 per ounce silver price, a December 31, 2013 resource model, pit slope angles
ranging from 38° to 48°, and estimated costs and recoveries based on the pre-feasibility study specifications. The resources were then tabulated by gold cut-off grade.
• Measured and indicated and inferred resources for the Çamyurt project are pit-constrained with cut-off determined as a net of process value of $0.10 per tonne, for each model block.
The determination was based on a $1,400 per ounce gold price and a $22.00/oz silver price, a December 31, 2013 resource model, average pit slope angle of 45°, and estimated
costs and recoveries based on the prefeasibility study specifications. The resources were then tabulated by gold cut-off grade.
• Mineral resources are not mineral reserves and do not have demonstrated economic viability.
33AuRico Mineral Reserve Estimates
Proven and Probable Reserves
as at December 31, 2014
Tonnes Grade Contained Metals (000's)
(000's) Au (g/t) Ag (g/t) Cu (%) Au (oz) Ag (oz) Cu (lbs)
Canada
YD Surface 2,501 0.76 61
YD UG 42,773 2.74 3,763
Kemess UG 100,373 0.56 2.00 0.28% 1,805 6,608 619,151
Total 145,647 1.20 2.05 0.28% 5,629 6,608 619,151
Mexico
El Chanate 27,213 0.74 646
Combined Total 6,274 6,608 619,151
Note: See slide 36 for notes to reserves and resources.
34AuRico Mineral Resource Estimates
Total Measured & Indicated Resources Total Inferred Resources
as at December 31, 2014 as at December 31, 2014
Tonnes Grade Contained Metals (000's) Tonnes Grade Contained Metals (000's)
(000's) Au (g/t) Ag (g/t) Cu (%) Au (oz) Ag (oz) Cu (lbs) (000's) Au (g/t) Ag (g/t) Cu (%) Au (oz) Ag (oz) Cu (lbs)
Canada
YD Surface 1,739 1.23 69 31 1.00 1
YD UG 13,946 3.19 1,430 3,608 2.76 320
Kemess UG 65,432 0.41 1.81 0.24% 854 3,811 346,546 9,969 0.39 1.57 0.21% 125 503 46,101
Kemess East 55,864 0.52 2.00 0.41% 939 3,601 503,663 117,152 0.38 1.79 0.34% 1,424 6,739 871,407
Lynn Lake 10,076 2.03 657 12,676 1.28 522
Total 147,057 0.84 1.90 0.32% 3,949 7,412 850,209 143,436 0.52 1.77 0.33% 2,392 7,242 917,508
Mexico
El Chanate 2,764 0.78 69 184 0.34 2
Orion 554 3.65 308.96 65 5,503 91 3.42 95.00 10 275
Total 3,318 1.26 308.96 134 5,503 275 1.36 95.00 12 275
Combined Total 4,083 12,915 850,209 2,404 7,517 917,508
Note: See slide 36 for notes to reserves and resources.
35AuRico Notes to Reserve &
Resource Estimates
Notes to Mineral Reserve and Resource tables:
• Mineral Reserves and Resources have been stated as at December 31, 2014.
• Mineral Resources are exclusive of Mineral Reserves. Mineral Resources that are not Mineral Reserves do not have demonstrated economic viability.
• El Chanate and Young‐Davidson assumed a gold price of $1,250 per ounce for reserves and $1,450 per ounce for resources.
• Kemess Underground assumed a gold price of $1,300 per ounce, a silver price of $23.00 per ounce for silver, and a copper price of $3.00 per pound for reserves. Kemess
Underground assumed a $13.00 NSR cutoff for resources. Kemess East assumed a $15.00 NSR cutoff for resources.
• Lynn Lake assumed a gold price of $1,555 per ounce for resources.
• Orion assumed a gold price of $850 per ounce and a silver price of $13.00 per ounce for resources.
• Mineral Reserves assume the following cutoff grades and process recoveries:
‐ Young‐Davidson – Surface: 0.50 gpt cutoff, 91% mill recovery
‐ Young‐Davidson – Underground: 1.90 gpt cutoff, 91% mill recovery
‐ El Chanate: 0.15 gpt cutoff, 30%‐65% leach recovery
‐ Kemess Underground: $15 NSR cutoff, mill recovery of 72% for gold and 91% for copper
• Mineral Resources and Mineral Reserves have been classified in accordance with Canadian Institute of Mining, Metallurgy and Petroleum (“CIM”) “CIM Definition Standards – For
Mineral Resources and Mineral Reserves” adopted by the CIM Council in accordance with the requirements of National Instrument 43‐101 Standards of Disclosure for Mineral
Projects (“NI 43‐101”), as is required by Canadian securities regulatory authorities. In addition, while the terms “Measured”, “Indicated and “Inferred” Mineral Resources are
required pursuant to NI 43‐101, the SEC does not recognize such terms. Canadian standards differ significantly from the requirements of the SEC, and mineral resource information
contained herein is not comparable to similar information regarding mineral reserves disclosed in accordance with the requirements of the SEC. Investors should understand that
“Inferred” Mineral Resources have a great amount of uncertainty as to their existence and great uncertainty as to their economic and legal feasibility. In addition, investors are
cautioned not to assume that any part or all of AuRico’s Mineral Resources constitute or will be converted into Reserves.
• Orion Mineral Resources are reflected on a 50% basis. Following the completion of a joint venture agreement, Minera Frisco, S.A.B. de C.V. has a 50% interest in the Orion project.
• Lynn Lake Mineral Resources are reflected on a 25% basis. AuRico acquired a 25% interest in the Lynn Lake properties in November 2014.
• Mineral Reserve and Resource tonnage and contained metal have been rounded to reflect the accuracy of the estimate, and numbers may not add due to rounding.
• The Company’s normal data verification procedures have been used in collecting, compiling, interpreting and processing the data used to estimate mineral reserves and mineral
resources and data underlying the information, opinion and outlook contained herein. Independent data verification has not been performed.
• Mineral Resources were prepared under the supervision and review of Jeffrey Volk, CPG, FAusIMM, the Director of Reserves and Resources, for AuRico Gold Inc. Mineral Reserves
were prepared under the supervision and review of Chris Bostwick, FAusIMM, the Senior Vice President Technical Services, for AuRico Gold Inc. Both Messrs Volk and Bostwick are
“Qualified Persons” as defined by National Instrument 43‐101.
36You can also read