2018 Television Report - FilmLA
←
→
Page content transcription
If your browser does not render page correctly, please read the page content below

2018 Television Report

PHOTO: HBO / Insecure

                                                                    6255 W. Sunset Blvd.   CREDITS:
                                                                    12th Floor
                                                                                           Contributors:
                                                                    Hollywood, CA 90028    Adrian McDonald
                                                                                           Corina Sandru
                                                                                           Philip Sokoloski
                                                                    filmla.com             Graphic Design:
                                                                                           Shane Hirschman
                                                                        @FilmLA
                                                                        FilmLA             Photography:
                                                                                           Shutterstock
                                                                        FilmLAinc          HBO
                                                                                           ABC
                                                                                           FOX

                        TABLE OF CONTENTS

                        INTRODUCTION                                                       2
                        PRODUCTION OF LIVE-ACTION SCRIPTED SERIES                          3
                        THE INFLUENCE OF DIGITAL STREAMING SERVICES                        4
                        THE IMPACT OF CORD-CUTTING CONSUMERS                               4
                        THE REALITY OF RISING PRODUCTION COSTS                             5
                        NEW PROJECTS: PILOTS VS. STRAIGHT-TO-SERIES ORDERS                 6
                        REMAKES, REBOOTS, REVIVALS—THE RIP VAN WINKLE EFFECT               8
                        SERIES PRODUCTION BY LOCATION                                      10
                        SERIES PRODUCTION BY EPISODE COUNT                                 10
                        FOCUS ON CALIFORNIA                                                11
                        NEW PROJECTS BY LOCATION                                           13
                        NEW PROJECTS BY DURATION                                           14
                        CONCLUSION                                                         14
                        ABOUT THIS REPORT                                                  15
INTRODUCTION
    It is rare to find someone who does not claim to have a favorite TV show. Whether one is
    a devotee of a long-running, time-tested procedural on basic cable, or a binge-watching
    cord-cutter glued to Hulu© on Sunday afternoons, for many of us, our television viewing
    habits are a part of who we are.

    But outside the industry where new television content is conceived and created, it is
    rare to pause and consider how television series are made, much less where this work is
    performed, and why, and by whom, and how much money is spent along the way.

    In this study we explore notable developments impacting the television industry and
    how those changes affect production levels in California and competing jurisdictions.
    Some of the trends we consider are: growth in the number of live-action scripted series
    in production, the influence of digital streaming services on this number, increasing
    production costs and a turn toward remakes and reboots and away from traditional pilot
    production.

    What emerges is a portrait of an industry once more in growth mode, creating
    opportunities for jurisdictions seeking to capture a greater share of television production.

                                                                                                   PHOTO: HBO / Ballers

2                                                                                                                   4
PRODUCTION OF LIVE-ACTION SCRIPTED SERIES
            250
                   In recent years, many observers have said we are living in a “Golden Age of Television.”
                   While opinions may differ as to whether this is true from a creative perspective, it is
                   certainly true from a quantitative one.                        203 202 201
            200                                                        186
              By FilmLA’s count, over the past two years, 467 live-action scripted series were produced
              by U.S. studios for the U.S. market. FilmLA’s                                       173
                                                            count includes all scripted live-action
                                                         169
              one-hour and half-hour shows produced for broadcast, cable and digital streaming 159
              networks. The count excludes animated projects,152 reality shows, late-night talk shows and
            150
              game shows. It does include children’s programming.

              According to FilmLA’s count, the number of scripted live-action series in production
              increased nearly 10 percent overall from 2016–17 to 2017–18. This increase was solely
              driven by digital series growth.
            100
                   The number of series produced for broadcast networks declined approximately 3
                   percent in 2017–18 from the prior year, while basic and premium cable saw a decline of
                   approximately 13 percent.
                   50
                   Meanwhile, production for digital networks increased 76 percent from 2016–17 (96 series
                   count) to 2017–18 (169 series count). Since 2010–11, the number of series produced for
                   digital networks increased an astonishing 2,314 percent.
                    0
                   NUMBER OF LIVE-ACTION SCRIPTED SERIES PRODUCED
                   BY U.S. STUDIOS
                   500
                                                                                                                                     467
                                                                                                                    426
                                                                                                                                     169      Digital
                   400
                                                                                                      368             96
                                                                                       357
NUMBER OF SERIES

                                                                                                                                             Broadcast
                                                                         329            36             57
                                                                          21
                   300                                    289
                                                                   17                                                                         Cable
                                            256                                         113                          112
                                                    15                   108                          113
                                                                                                                                     109
                                                           94
                             198
                   200                7      87
                                                                                        208                          218
                              67                                         200                          198
                                                           178                                                                       189
                                            154
                   100
                             124

                        0
                            2010–11       2011–12        2012–13        2013–14       2014–15       2015–16        2016–17         2017–18

                   Where is all this growth in digital coming from? Netflix© accounted for just over half (86)
                   of the live-action scripted digital series, a dozen other streaming services had at least
                   one series in production for the current or upcoming season. Amazon© and Hulu are
                   the industry’s dominant players after Netflix, with 22 and 16 series, respectively. Other
                   streaming services or digital networks with five or more live-action scripted series in our
                   sample include YouTube©, CBS All Access©, Facebook© and Verizon’s go90 service.1

                   The volume of new series and other programming produced for digital networks shows
                   no signs of slowing. In August 2018, YouTube Premium claimed the service had a total of
                   65 “shows and movies” since it launched in 2016. In 2019, YouTube Premium has plans
                   to add at least 50 additional shows. In addition, AT&T®, which now owns HBO®, has
                   announced plans to greatly expand the volume of programming on the network.2
                   1   As of July 2018, Verizon announced that it was pulling the plug on the go90 service. The status of series
                       produced for the service is unknown.
                   2   By blurring the lines and making it more difficult to categorize new series by distribution media, the cord
                       cutting phenomenon presents a challenge for production trends analysis.

                                                                                                                                                         3
THE INFLUENCE OF DIGITAL STREAMING SERVICES
    The impact that digital streaming services are having on the entertainment industry and the
    television landscape is considerable. From 2012 to June 2018, the number of Netflix subscribers in
    the U.S. grew from 27 million to 56 million. Worldwide, Netflix boasts over 130 million subscribers.

    Alongside subscriber growth, Netflix has increased its spend on original content, to the point that
    its investment now resembles those of other major studios. In 2017 the annual spend on non-sports
    content by NBCUniversal© was $10.2 billion, for Time Warner $8 billion, Disney© $7.8 billion and
    Netflix $6.3 billion.3 In 2018, Netflix plans to spend $12–$13 billion on original content.4 The OTT
    (“Over the Top”) streaming model Netflix pioneered is, according to Variety’s Cynthia Littleton,
    “the reason Disney and Comcast chased 21st Century Fox with such fervor” and “was a big part
    of AT&T’s motivation for scooping up Time Warner.” Of Netflix’s impact on entertainment industry
    economics, Littleton called it the “biggest shift… in decades.”5

    In August 2018, Disney CEO Bob Iger said creation of the company’s planned DTC digital service, is
    the “biggest priority” for 2019. Disney Play, according to Iger, will feature a lower subscriber price
    point than Netflix, but it will also offer less. “We’re going to walk before we run,” Iger said, “as it
    relates to volume of content.”

    Still, there is probably room to grow. Amazon, Apple©, and Alphabet (Google©), have strong
    access to capital and documented interest in original content production. While Amazon is already
    established as an OTT streaming service, with content spending reaching $5 billion in 2018, the
    company has yet to flex its financial muscle on a scale similar to Netflix.

    Likewise, Apple has only begun to invest in original content, with a relatively modest spend of
    $1 billion budgeted in the near future. Should additional players aggressively enter this space as
    believed, the overall number of live-action series in development will likely increase.

    3   Rani Molla, “Netflix Spends More on Content,” Recode, February 26, 2018:
        https://www.recode.net/2018/2/26/17053936/how-much-netflix-billion-original-content-programs-tv-movies-hulu-disney-chart
    4   Dana Feldman, “Netflix’s Content Budget is Updated,” Forbes, July 9, 2018:
        https://www.forbes.com/sites/danafeldman/2018/07/09/netflixs-content-budget-is-updated-to-13b-in-2018/
    5   Cynthia Littleton, “How Hollywood is Racing to Catch Up With Netflix,” Variety, August 2018:
        https://variety.com/2018/digital/features/media-streaming-services-netflix-disney-comcast-att-1202910463/

    THE IMPACT OF CORD-CUTTING CONSUMERS
    So-called “cord cutting” is another consumer phenomenon that can be associated with the
    apparent growth of original content on streaming media. The shift of viewer eyeballs from one
    distribution channel to another seems to correlate with new content growth on those platforms.

    Data collected by Leichtman Research Group shows that the top providers of pay TV services began
    losing customers on an annual basis in 2013, when 170,000 customers cancelled service.
    This number has steadily increased, to just over 2.9 million as of 2017.

    At the same time, customers embraced live-television streaming services like Roku©, DirectTV
    Now™, Sling TV™, Playstation™ Vue, Hulu with Live TV and YouTube TV. These services offer
    live-streaming packages delivered over the internet that are akin to pay TV cable packages, but
    generally at a lower price point. Monthly prices for live-streaming packages from providers like
    YouTube or Sling TV range from $25 to $40 versus an average of $100 for major cable providers.

    Thus, even though 2017–18 was the most productive series development cycle FilmLA has ever
    observed, none of the year-over-year growth can be attributed to an increase in the number
    of network or cable shows. From a production standpoint, both of these mature sectors of the
    business are just as robust—but no more so—than they were back in 2013–14.

4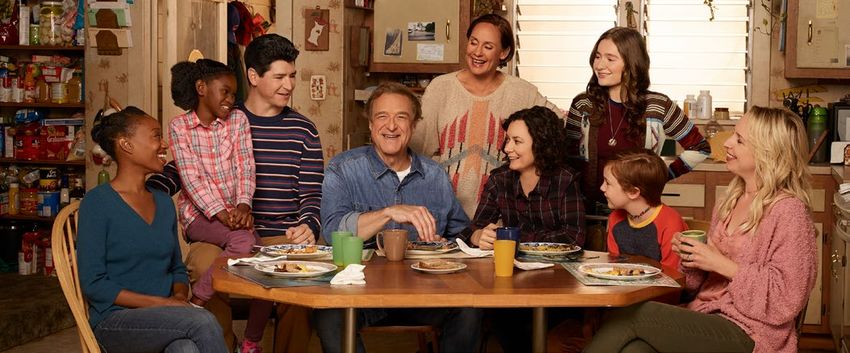
THE REALITY OF RISING PRODUCTION COSTS
When it comes to one-hour series, the budget for many of today’s top shows
approaches or exceeds $100 million per season, an amount that rivals many large
budget feature films.

As a result, a studio making a two-year commitment to a one-hour series like Warner
Bros.’ Blindspot ($79 million, S1) will spend more money to produce it than to
produce a big budget film like Wonder Woman ($150 million). Every successful TV
series is an economic boon to the hosting location.

A partial sample of estimated production budgets for current one-hour series
revealed per-episode production costs ranging from $3.1 million to $15 million.
Depending on the number of episodes ordered, the price of an entire season can
cost from $35 million to $135 million.

    SERIES                                    SEASON SPEND              PER EPISODE SPEND            STUDIO
    The Americans, Season 4 7                    $54,000,000                $4,150,000                 FX

    Billions, Season 1    7                      $62,400,000                $5,200,000           Showtime

    Blindspot, Season 1 7                        $79,000,000                $3,400,000                NBC

    Blue Bloods, Season 6         7             $100,400,000                $4,560,000                CBS

    The Crown, Season 1 8                       $100,000,000               $10,000,000               Netflix

    The Deuce, Season 1 7                        $62,000,000                $7,750,000                HBO

    Elementary, Season 4 7                       $88,500,000                $3,680,000                CBS

    Game of Thrones, Season 8          8         $90,000,000               $15,000,000                HBO

    The Good Wife, Season 7 7                    $78,000,000                $3,545,000                CBS

    Gotham, Season 2          7                 $111,000,000                $5,045,000                FOX

    Iron Fist, Season 1 7                        $62,000,000                $4,760,000               Netflix

    Jack Ryan, Season 1 8                        $64,000,000                $8,000,000               Amazon

    Madame Secretary, Season 2 7                 $91,000,000                $3,950,000                CBS

    Mayans MC, Season 1           6              $35,000.000                $3,500,000                 FX

    The Night Of, Season 1 7                     $52,000,000                $6,500,000                HBO

    The Orville, Season 2 6                      $69,000,000                $5,700,000                FOX

    Person of Interest, Season 4        7        $95,000,000                $4,310,000                CBS

    Shooter, Season 3         6                  $40,600,000                $3,100,000                USA

    S.W.A.T., Season 2        6                  $80,000,000                $3,400,000                NBC

    This Is US, Season 3 6                       $56,600,000                $3,100,000                NBC

    Vinyl, Season 1   7                         $135,000,000               $13,500,000                HBO

With increased demand for original content for broadcast, cable and digital
distribution, the availability of experienced crew, cast and resources to make these
shows becomes a factor. Locations richly equipped with these resources are, perhaps
unsurprisingly, very successful at attracting new projects.

6     California Film Commission, Program 2.0 CFC Approved Projects List:
      http://film.ca.gov/wp-content/uploads/2.0-Website-Approved-Projects-List-Online-11.19.18.pdf

7     Empire State Development Reports:
      https://esd.ny.gov/esd-media-center/reports?tid[]=516&keys=film

8     Maureen Ryan, “TV Series Budgets Hit the Breaking Point”, Variety, Sept. 26, 2017:
      https://variety.com/2017/tv/news/tv-series-budgets-costs-rising-peak-tv-1202570158/

                                                                                                      Continued on following page. »

                                                                                                                                       5
THE REALITY OF RISING PRODUCTION COSTS (CONTINUED)
    As FilmLA revealed in its Sound Stage Production Report (available on FilmLA.com), the hundreds
    of sound stages in Los Angeles have been in extremely high demand, and occupancy rates trend
    above 90 percent at most major studios. “For filming that took place on certified sound stages in
    2016, the overwhelming number of shoot days were for scripted television (both one-hour and half-
    hour series) which accounted for 75% of all stage shoot days in 2016.”9

    Anecdotally, the story is the same for other production centers like Vancouver, Toronto, New York,
    Atlanta and London, where production space is at a premium. Even in Greater Los Angeles, high
    soundstage occupancy has motivated entrepreneurial production companies to build their sets in
    industrial spaces and converted warehouses.

    The influx of new TV series in Los Angeles has also resulted in increased on-location production.

    9   FilmL.A. 2017 Sound Stage Production Report, “Trends in Sound Stage Filming”, Page 5.

    NEW PROJECTS: PILOTS VS. STRAIGHT-TO-SERIES ORDERS
    Over the last several years, non-traditional programming available from cable channels and online
    streaming services like Amazon, Netflix and Hulu has begun altering not just the landscape for new
    projects, but also how players throughout the industry acquire and deliver content to consumers.

    Prior to the popularization of original scripted programming on cable, most new series started life
    as traditional “pilots.” For decades, broadcast networks courted advertisers in an expensive and
    seasonally-driven “upfronts” process, in which advertisers would preview the shows to be aired on
    broadcast networks in the fall and help predict their success.

    Today, approximately 36 percent of new shows are ordered straight-to-series, that is, they receive
    the “green light” for series production without going through an upfronts process. This solidifies
    a trend that began five years ago, as first reported on by FilmLA during the 2012–13 new project
    development cycle. Four percent of all new shows were ordered straight-to-series in 2010–11. By
    2017–18, a total of 58 shows (45 one-hour, 13 half-hour) were ordered straight-to-series across
    broadcast, cable and digital networks, comprising a share of the business nine times larger than in
    2010.

    The arrival of digitally distributed content helped to accelerate this trend away from traditional
    pilots. From 2011-2017, the share of new project activity attributed to digital networks increased
    from less than one percent of the market to 19 percent—almost a fifth of all new production.
    During the 2017–18 cycle, digital’s share of new projects increased to nearly 28 percent (44 count).
    This is a substantial increase for digital streaming services—and an economic benefit to the places
    where these projects are made.

    In 2017–18, the three leading digital networks for new projects were Amazon (with 14 projects),
    Netflix (12) and Hulu (6). These leading digital networks were joined by newer and/or smaller
    streaming players that include Sony Crackle©, YouTube, DC Universe™, CBS All Access and
    Facebook.

                   SHARE OF NEW PROJECTS ORDERED STRAIGHT TO SERIES
                        L.A.’s Share of Total Drama Pilots Produced
             40%
            40
             35%
            35                                                                                  38%
                                                                                                          36%
             30%
            30
             25%
            25                                                                   28%
             20%
            20
             15%
            15
                                                          19%        18%
             10%
            10
             55%
                        4%         5%          6%
             00%       2010-11    2011-12     2012-13     2013-14     2014-15    2015-16        2016-17   2017-18

6
NEW PROJECTS, PILOTS VS. STRAIGHT-TO-SERIES ORDERS (CONTINUED)
One effect of increased reliance on straight-to-series orders has been a leveling off or decrease
in the number of new projects made each year. Looking at all pilot production activity, FilmLA’s
official count shows that 159 broadcast, cable and digital projects (106 one-hour, 53 half-hour)
were produced during the 2017–18 development cycle, 14 projects less than the prior year and
44 fewer than the peak yield FilmLA reported four years ago.
NEW PROJECT COUNT BY DEVELOPMENT CYCLE PILOTS STRAIGHT-TO-SERIES TOTALS
250
203 202 201
200 186
38 37 173
169 12
57
174 159
7
152
165 165 65
150 162 7
145 144 58
124 129
120
100 108
100 103 101
91
50
0
20
20
20
20
20
20
20
20
20
20
20
20
20
20
04
05
06
07
08
09
10
11
12
13
14
15
16
17
-0
-0
-0
-0
-0
-1
-1
-1
-1
-1
-1
-1
-1
-1
5
6
7
8
9
0
1
2
3
4
5
6
7
8
500
400
300
200
100
7REMAKES, REBOOTS, REVIVALS—THE RIP VAN WINKLE EFFECT
Today’s series production landscape includes a Rip Van Winkle tale, in which viewers could be forgiven
for asking, “Wait, haven’t I seen this before?” Demand for compelling content, combined with the high
stakes of straight-to-series orders, seems to have kindled new interest in remakes, reboots and revivals.
With every major streaming service (Netflix, Hulu, Amazon, etc.) studio conglomerate (Disney, AT&T,
Viacom©, CBS, etc.) and Silicon Valley titan (Apple, YouTube, etc.) developing original content, the
familiarity factor has many uses. From a business standpoint, a remake offers built-in awareness based
on a proven concept which can lead to a large premiere audience willing to sample the latest iteration.
As an added bonus, these projects virtually guarantee international sales to an audience already familiar
with the original premise.
In this brave new world, films with a following can gain new life as television series (Lethal Weapon,
Fargo, etc.), a favorite past show can return with the original cast (Fuller House, Will & Grace, etc.) or a
popular series can be rebooted with a culture/gender makeover (Magnum P.I., One Day at the Time, etc.).
PILOT ONLY,
TV PROJECTS BASED ON PRIOR FEATURE FILMS (2010–2019) CANCELLED (NOT PICKED UP FOR SERIES)
BASED ON PREVIOUS FEATURE FILMS ORIGINAL RELEASE REMAKE YEAR PLATFORM / NETWORK
A Series of Unfortunate Events 2004 2017 Netflix
Ash vs Evil Dead (Evil Dead) 1981 2015 Starz
Bates Motel (Psycho) 1960 2013 A&E
Cobra Kai (Karate Kid) 1984 2018 YouTube
Dear White People 2014 2017 Netflix
Damien (The Omen) 1976 2016 FOX
Emerald City 1939 2017 NBC
Fargo 1996 2014 FX
First Wives Club 1996 2018 Paramount Network
Frequency 2000 2016 CW
From Dusk Till Dawn 1996 2014 El Rey Network
Get Shorty 1995 2017 EPIX
Girlfriend Experience 2009 2016 Starz
Heathers10 1988 2018 Paramount Network
L.A. Confidential 1997 2018 CBS
L.A.’s Finest (Bad Boys) 1995 2018 Spectrum
Lethal Weapon 1987 2016 FOX
Limitless 2011 2015 CBS
Minority Report 2002 2015 FOX
Rush Hour 1998 2016 CBS
Scream 1996 2015 MTV
Shooter 2007 2016 USA
She’s Gotta Have It 1986 2017 Netflix
Snatch 2000 2017 Crackle
Snowpiercer 2014 2018 TNT
S.W.A.T. 1975, 2003 2017 CBS
Taken 2008 2017 NBC
Teen Wolf 1985 2011 MTV
The Exorcist 1973 2016 FOX
The Purge 2013 2018 Syfy
Training Day 2001 2017 CBS
Tremors 1990 2018 Syfy
Wet Hot American Summer: First Day of Camp 2001 2015 Netflix
Westworld 1973 2016 HBO
10 Show filmed an entire season but is being shopped for a distributor.
8PILOT ONLY,
TV PROJECTS BASED ON PRIOR SHOWS (2010–2019) CANCELLED
(NOT PICKED UP FOR SERIES)
BASED ON PREVIOUS TV SHOWS ORIGINAL RELEASE REMAKE YEAR PLATFORM / NETWORK
24: Live Another Day 2001 2014 FOX
24: Legacy 2001 2017 FOX
Anne with an E 1985 2017 Netflix
Arrested Development 2003 2018 Netflix
Cagney & Lacey 1981 2018 CBS
Charmed 1998 2018 CW
Dynasty 1981 2017 CW
Dallas 1978 2012 TNT
Fuller House 1987 2016 Netflix
Get Christie Love 1974 2018 ABC
Gilmore Girls 2000 2017 Netflix
Girl Meets World 1993 2014 Disney Channel
Greatest American Hero 1981 2018 ABC
Hawaii Five-O 1968 2010 CBS
Heroes Reborn 2006 2015 NBC
Lost in Space 1965 2018 NETFLIX
MacGyver 1985 2016 CBS
Magnum P.I. 1980 2018 CBS
Murphy Brown 1988 2018 CBS
One Day at the Time 1975 2017 NETFLIX
Prison Break 2005 2017 FOX
Roswell 1999 2019 CW
Star Trek: Discovery 2017 CBS All Access
The Chilling Adventures of Sabrina 1996 2018 Netflix
The Conners (Roseanne) 1988 2018 ABC
The Odd Couple 1970 2015 CBS
The Tick 2001 2016 Amazon
The Twilight Zone 1959 2019 CBS All Access
The X-Files 1993 2015 FOX
Twin Peaks 1990 2017 Showtime
Uncle Buck 1989 2016 ABC
Will & Grace 1998 2017 NBC
PHOTO: ABC/Robert Trachtenberg, The Conners
9SERIES PRODUCTION BY LOCATION
Given all of the creative evolution the television industry has experienced over the last decade,
it is worthwhile to look at which cities, states and countries are reaping the benefits of increased
series production.
For 2017–18, California will be home to 176 of the 467 scripted series in FilmLA’s official count.
This is a slight increase in year-over year production for California; FilmLA counted 173 scripted
series in 2016–2017.
In all, eight locations (California, New York, British Columbia, Georgia, Ontario, the United
Kingdom (UK), New Mexico and Illinois) will host ten or more series in 2017–18. These eight
locations accounted for 79 percent (371 series) of all scripted series produced by U.S. studios.
Thus, while California’s share of sampled live-action series hovers near 38 percent, the Golden
State still maintains a commanding lead over its closest competitors.
The number of locations that have at least one live-action scripted series is also growing. Last
year, 48 locations across the globe were home to one or more shows. That number increased to
57 locations in 2018, a list that includes 21 U.S. states and 33 countries.
SERIES PRODUCTION BY EPISODE COUNT
The number of scripted series in production has seen remarkable growth, but the number of
episodes produced increased only slightly, according to data provided to FilmLA by UCLA’s
Division of Social Sciences. While the number of scripted series in production grew by 86 percent
from 2011–2016, the number of series episodes produced grew by just eight percent, from 4,806
episodes to 5,096 over the same period.11
Primetime series produced for broadcast networks like ABC and FOX traditionally comprise
20−24 episodes per season. In recent years, however, many series produced for the broadcast
networks have seen episode orders fall below 20. The majority of the growth in the number
of scripted series produced is driven by digital networks, which typically order seasons of 12
episodes or less. According to the most recent data from UCLA, in 2015–16 scripted series on
broadcast networks averaged 16.5 episodes per season, cable shows averaged 11.5 episodes per
season and digital shows averaged 9.5 episodes per season.
11
2018 Hollywood Diversity Report database, UCLA Division of Social Sciences.
10FOCUS ON CALIFORNIA
With the number of one-hour series calling California home rising to 67 projects for the current/
upcoming season, it’s the best year on record. Most of the California one-hour series are shows on
basic and premium cable channels. However, the fastest growing segment of California’s one-hour
series are those produced for digital networks. Digital one-hour series now account for nearly one third
(approximately 32 percent) of all California-based one-hour series. By comparison, one-hour digital
series accounted for approximately 18 percent of all of California’s one-hour scripted shows last year.
California Dramas: Network Vs. Cable
CALIFORNIA ONE-HOUR SERIES: NETWORK, CABLE AND DIGITAL
80
67
70
TOTAL
60 62
60 57
NUMBER OF PROJECTS
55
52 53
50 48
45 47
45
40
38
30 31
30 29
27 27 26 27 Broadcast
25 25 26 26 25
24 23 23
20 22 22 22
20
19 19
15 Cable
10 11
1 1 1 1 6
0 Digital
2008-09 2009-10 2010-11 2011-12 2012-13 2013-14 2014-15 2015-16 2016-17 2017-18 2018-19
California can credit its good fortune to the California Film & Television Tax Credit Program. Under
the improved 2.0 program, enacted in 2014, eligibility for one-hour series applies to all shows
regardless of distribution media. Under the original program enacted in 2009, only new basic cable
series and series for any distribution outlet relocating to California were eligible for the incentive.
During 2018–19, a total of 27 incentivized shows are enrolled in the state program.
80
70
60
50
11PROJECTS RECEIVING THE CALIFORNIA FILM & TELEVISION TAX CREDIT
TOTAL QUALIFIED
PROJECT TITLE PLATFORM CAST CREW EXTRAS EXPENDITURES
American Horror Story S8 FOX 225 196 2090 $36,568,907
Crazy Ex Girlfriend S4 CW 8 260 2430 $41,195,482
Good Girls S2 NBC 9 235 3900 $37,177,563
S.W.A.T. S2 CBS 728 220 8952 $77,090,550
Broadcast
The Orville S2 FOX 232 281 3696 $69,168,711
The Rookie 1 ABC 156 150 8690 $38,688,655
This Is Us S3 NBC 327 201 3624 $56,668,752
TOTAL 7 1,685 1,543 33,382 $356,558,620
American Princess 1 Lifetime 249 154 1030 $22,307,370
Animal Kingdom S4 USA 160 175 2249 $36,950,534
Ballers S5 HBO 106 210 4624 $35,293,318
Euphoria 1 HBO 149 235 3586 $41,626,754
Good Trouble 1 Freeform 271 182 2314 $20,708,808
I’m Dying Up Here 2 Showtime 263 125 6204 $36,494,975
Legion S3 FX 30 118 1600 $43,699,594
Cable
Mayans MC 1 FX 164 125 2628 $35,099,465
Sharp Objects S1 HBO 120 159 2985 $26,460,570
Shooter 3 USA 65 175 2225 $40,669,646
Snowfall S3 FX 85 125 2050 $35,329,331
The Affair S5 Showtime 171 85 3420 $37,994,527
Veep 7 HBO 462 195 3960 $36,110,247
Westworld S3 HBO 75 200 7300 $115,334,874
You S2 Lifetime 200 175 3160 $24,249,497
TOTAL 15 2,570 49,335 2,438 $588,329,510
13 Reasons Why S3 Netflix 80 175 9945 $60,172,610
Lucifer S4 Netflix 164 120 5984 $35,781,831
Sneaky Pete S3 Amazon 236 220 2510 $36,817,232
Digital
Strange Angel 1 CBS All Access 125 300 3100 $38,463,025
The OA S2 Netflix 77 350 2664 $32,811,866
TOTAL 5 682 1,165 24,203 $204,046,564
GRAND TOTAL 4,937 5,146 106,920 $1,148,934,694
The impact these incentivized series (including the two In fact, only 10 of the top 100 films at the North American box
half-hour incentivized series Ballers and Veep) have in office in 2017 had budgets greater than $184 million, and unlike
California is significant; according to the California Film many big-budget films, these shows can come back for multiple
Commission, they generated a combined qualified in- seasons.
state spend of nearly $1.2 billion during the first three
years of the program. Assuming an average per-season The amount above does not include the direct production
budget of $50 million for the 42 non-incentivized one- spending for the 99 (30 network and 69 cable & digital) scripted
hour scripted series shooting in the state, we estimate the half-hour series (not including Ballers and Veep) that do not
total annual direct production spend for California-based receive an incentive benefit and are also based in California.
one-hour series at $3.83 billion. The average cost to produce each episode of these half-hour
shows averages $2 to $3 million on most series. FilmLA estimates
While California is no longer home to a significant share these 99 series will generate an additional $3.05 billion in direct
of the big-budget feature films that are produced each spending in the upcoming season.
year, scripted one-hour series make up for much of the
lost economic impact from those major films that film All told, we estimate the combined direct spend of the scripted
outside the state. A single season of qualified spending one-hour and half-hour series based in California at $6.88 billion
by The Orville ($69,000,00) and Westworld ($115,000,000) in 2018–19. This amount does not include spending by the
combined will spend nearly as much, if not more, than numerous animated series produced in the state or spending by
many big-budget films. game shows, talk shows, talent shows and dozens of reality shows
that are not the focus of this report, but also call California home.
1240
35
30
25 NEW PROJECTS BY LOCATION
20
As previously noted in this report, 159 new projects, including traditional pilots and straight
15 to series orders, were introduced in the 2017–18 development cycle. Out of those 159
projects, 65 (21 one-hour, 44 half-hour) were filmed on California streets and stages.
10
This represents a 4 percent decrease from last year, when 68 projects filmed here. In terms
5 of overall market share, California captured 41 percent of all new projects in the current
0 development cycle, which is an improvement over the prior two years, when the state’s
share was below 40 percent.
New project production is worthy of study because the activity creates significant economic
benefits for the hosting region. The average one-hour pilot project can directly employ
150-750+ people for the duration of the shoot, which typically spans 10-20 days.
Typical production costs for a show’s first episode, having risen over the years, now average
about $3 million (for half-hour projects) and $6 million to $9 million (for one-hour projects).
FilmLA estimates that approximately $290 million was spent on new television projects in
California during the 2017–18 development cycle. By comparison, a total of $303 million
was spent in the state during the prior cycle on new television projects.
Other locations are seeing benefits from hosting new projects, too. In the 2017–18
development cycle, there were 94 projects produced outside California in competing
jurisdictions; some form of film production incentive was available in every one of these
jurisdictions. Other factors influencing producers’ choice of production location include the
availability of cast and trained crew, and access to production infrastructure.
After California, the top competitors for new project production in 2017–18 were New
York (21 projects), British Columbia (17 projects) and Ontario (10 projects). Also of note are
Georgia and Illinois, which hosted six and five projects, respectively in 2017–18.
Top Pilot Locations
TOP TELEVISION PROJECT LOCATIONS, BY SHOW COUNT
200
3 5
8
4 12
150 12 9
NUMBER OF PROJECTS
3
6 6
3 9 9 15 3 5
4 6
35 10 10
5
7 19 25 28 12 5
7 10
20
17 15 24
6
100 10 17 16
8 25 21
21
17
96 Illinois
50
92 90 91 Ontario
87 79 68 65
Georgia
New York
British Columbia
California
0
2010-11 2011-12 2012-13 2013-14 2014-15 2015-16 2016-17 2017-18
New York, Georgia and British Columbia all saw a decline in the number of new projects
produced compared to the prior year. Georgia experienced a 50 percent drop, going from
Illinois
12 projects in 2016–17 to just six during the 2017–18 cycle. British Columbia declined
by 19 percent, going from 21 projects in 2016–17 to 17 projects in 2017–18. Since both
jurisdictions reported record levels of production spending last year ($2.7 billion in Georgia
Toronto
and $3.4 billion CAD in British Columbia), and both have competitive film incentive
programs in place, it’s unlikely this signals any long-term drop in these jurisdictions’
challenge to California.
Atlanta
13
New YorkNEW PROJECTS BY DURATION
In 2017–18, California captured nearly 20 percent (21 count) of new one-hour projects. While
it was not the lowest share for one-hour projects on record12, California’s present share is well
below its peak in 2006–07, when the state’s share was a commanding 63 percent. Much like
feature films, new one-hour projects are usually produced in jurisdictions where film incentives
are available. California’s considerable loss of one-hour project share is directly tied to
incentive-fueled competition.
In 2017–18, the top five production centers in North America (California, New York, British
Columbia, Ontario, Georgia) accounted for 68 of the 106 new one-hour projects, which
represents a combined share of approximately 64 percent of new one-hour projects produced
during the cycle. During the 2016–17 and 2015–16 cycles, these same five locations accounted
for 68 percent and 70 percent, respectively, for one-hour projects produced during those
periods.
The number of new half-hour projects produced in California was 44 in 2017–18 compared to
46 in the previous cycle, a decrease of 4 percent. California’s overall share of new half-hour
projects climbed to 83 percent in 2017–18, which is the first time the state’s share for half-hour
projects has been above 80 percent in the last five years.
California’s status as the premier production center for new television projects continues to
hinge on the industry’s willingness to produce half-hour projects in the state. Competitive film
incentive programs in other locations have not been very successful at siphoning half-hour
production from California.
12 During the 2013/14 cycle, California’s share of one-hour projects was 17 percent.
CONCLUSION
The television production landscape and the trends that shape it today are anything but static.
The emergence of digital networks as original content producers, a breathtaking increase in
the number of scripted series in production, and the still-growing trend away from a traditional
pilot season in favor of straight-to-series orders all underscore an obvious fact: the current
production landscape is incredibly dynamic.
Equally dynamic is the shifting competitive landscape among top competitors for television
work. The inherent advantages of established productions centers like California, New York
and Vancouver continue to make these places attractive for new projects and full series.
Nonetheless, the combination of film incentive programs and infrastructure availability
continues to fuel interest in filming elsewhere.
Finally, while California’s share of new project production is below historic highs, the current
volume of scripted series production in the state places it far ahead of even its closest rivals.
With a solid California Film & Television Tax Credit Program in place through 2024, the Golden
State’s standing as the world’s top television production center is reaffirmed.
14ABOUT THIS REPORT
For more than a decade, FilmLA Research has tracked television projects in development and
has published several reports on this topic, including its 2017 Pilot Production Report. Over
time, the scope of FilmLA’s tracking and reporting effort has grown.
While pilots and straight-to-series orders remain a significant part of FilmLA’s tracking efforts,
the 2018 Television Report offers a broader look at the overall television landscape, including
notable trends, the impact of digital streaming services on the industry and the overall scripted
television landscape both in California and jurisdictions across the world.
In prior reports, FilmLA used the term “television pilot” (or simply, “pilot”) to refer to
all original scripted pilot and shorter-length presentations, as well as the first episode of
any new episodic show ordered “straight-to-series.” Beginning with this report, the term
“pilot” has been replaced with “New Project”, a term that is equally encompassing, but
less ambiguous. Past FilmLA reports also made a distinction between drama projects (which
were typically one hour in duration, less commercial time) and comedy projects (typically one
half-hour in duration). Following the advent of content that blurs the genre line (i.e., so-called
“dramadies”), FilmLA now categorizes projects by running length.
FilmLA’s series and new project counts within a development cycle include both stage-based
and location-based projects produced in any location, of any running duration, intended
for primetime airing on broadcast networks or cable networks, or online streaming services
targeting U.S. audiences. Our counts include all series of which FilmLA is made aware through
primary research (direct contact with studios, producers and film commissions, plus review of
film permit records) and secondary research (industry trade publications, online subscription
databases). Our aim in supplying these counts is to be thorough; errors of omission are,
however, possible.
Except for estimates attributable directly to FilmLA and labeled as such in the text, all budget
and spending figures referenced in this report were obtained from film incentive progress
reports issued by state and foreign government jurisdictions, reputable news sources, or
subscription databases, as attributed via footnote.
SOURCES
Annual Film Incentive Transparency Reports:
California
Louisiana
New York Other:
Online Databases: California Film Comission
Louisiana Department of Economic Development
StudioSystem CreativeBC
Development Leads British Film Insititute
IMDbPro Major news & media outlets
15NOTES:
6255 W. Sunset Blvd.
12th Floor
Hollywood, CA 90028

FilmLA.com
You can also read