Q4:20 EARNINGS PRESENTATION - NYSE American: NOG - NYSE American: NOG - cloudfront.net

Page created by Christina Avila
 
CONTINUE READING
Q4:20 EARNINGS PRESENTATION - NYSE American: NOG - NYSE American: NOG - cloudfront.net
NYSE American: NOG

Q4:20 EARNINGS PRESENTATION

       NYSE American: NOG
Q4:20 EARNINGS PRESENTATION - NYSE American: NOG - NYSE American: NOG - cloudfront.net
FORWARD LOOKING STATEMENTS
                                                                                                                                                          NYSE American: NOG

 This presentation contains forward-looking statements regarding future events and future results that are subject to the safe harbors created under the Securities Act
 of 1933 (the “Securities Act”) and the Securities Exchange Act of 1934 (the “Exchange Act”). All statements other than statements of historical facts included in this
 presentation, including without limitation statements regarding Northern’s financial position and results, business strategy, plans and objectives of management for
 future operations, industry conditions, and indebtedness covenant compliance are forward-looking statements. When used in this presentation, forward-looking
 statements are generally accompanied by terms or phrases such as “estimate,” “project,” “predict,” “believe,” “expect,” “continue,” “anticipate,” “target,” “could,”
 “plan,” “intend,” “seek,” “goal,” “will,” “should,” “may” or other words and similar expressions that convey the uncertainty of future events or outcomes. Items
 contemplating or making assumptions about actual or potential future sales, market size, collaborations, and trends or operating results also constitute such forward-
 looking statements.
 Forward-looking statements involve inherent risks and uncertainties, and important factors (many of which are beyond our company’s control) that could cause
 actual results to differ materially from those set forth in the forward-looking statements, including the following: changes in crude oil and natural gas prices; the pace
 of drilling and completions activity on Northern’s properties and properties pending acquisition; Northern’s ability to acquire additional development opportunities;
 potential or pending acquisition transactions, including the Reliance acquisition; Northern’s ability to consummate pending acquisitions, including the Reliance
 acquisition, and the anticipated timing of such consummation; the projected capital efficiency savings and other operating efficiencies and synergies resulting from
 Northern’s acquisition transactions; integration and benefits of property acquisitions, including the Reliance acquisition, or the effects of such acquisitions on
 Northern’s cash position and levels of indebtedness; changes in Northern’s reserves estimates or the value thereof; disruptions to Northern’s business due to
 acquisitions and other significant transactions; infrastructure constraints and related factors affecting Northern’s properties; ongoing legal disputes over and potential
 shutdown of the Dakota Access Pipeline; the COVID-19 pandemic and its related economic repercussions and effect on the oil and natural gas industry; general
 economic or industry conditions, nationally and/or in the communities in which Northern conducts business; changes in the interest rate environment, legislation or
 regulatory requirements; conditions of the securities markets; Northern’s ability to raise or access capital; changes in accounting principles, policies or guidelines; and
 financial or political instability, health-related epidemics, acts of war or terrorism, and other economic, competitive, governmental, regulatory and technical factors
 affecting Northern’s operations, products and prices. Additional information concerning potential factors that could affect future results is included in the section
 entitled “Item 1A. Risk Factors” and other sections of Northern’s more recent Annual Report on Form 10-K and Quarterly Report on Form 10-Q, as updated from time
 to time in amendments and subsequent reports filed with the SEC, which describe factors that could cause Northern’s actual results to differ from those set forth in
 the forward looking statements.
 Northern has based these forward-looking statements on its current expectations and assumptions about future events. While management considers these
 expectations and assumptions to be reasonable, they are inherently subject to significant business, economic, competitive, regulatory and other risks, contingencies
 and uncertainties, most of which are difficult to predict and many of which are beyond Northern’s control. Northern does not undertake any duty to update or revise
 any forward-looking statements, except as may be required by the federal securities laws.
                                                                                                                                                                               2
Q4:20 EARNINGS PRESENTATION - NYSE American: NOG - NYSE American: NOG - cloudfront.net
NYSE American: NOG

I.   LAUNCH OF A NATIONAL NON-OP FRANCHISE
II. Q4 TAKEAWAYS AND 2021 GUIDANCE
III. MARCELLUS TRANSACTION OVERVIEW- ADJUSTED FOR
     EQT’S EXERCISED PREFERENTIAL PURCHASE RIGHT
IV. APPENDIX: SUPPLEMENTAL INFO

                                  Northern Oil & Gas, Inc. - November 2020   3
Q4:20 EARNINGS PRESENTATION - NYSE American: NOG - NYSE American: NOG - cloudfront.net
THE NORTHERN INVESTMENT PROPOSITION
                                                                                                                                                                                                                                                          NYSE American: NOG

                         National non-op franchise – principled ROCE (1) leader (>23.5% in Q4:20) diversified by
                                                      commodity and geography

          Strong expected free cash flow(2): >$125MM in 21 (15% yld); >$450MM through 2024 (>50% yld)

          Attractive Marcellus entry point (PDP + WIP PV22) highlights highly accretive M&A opportunities

                                            Simple balance sheet with leverage
Q4:20 EARNINGS PRESENTATION - NYSE American: NOG - NYSE American: NOG - cloudfront.net
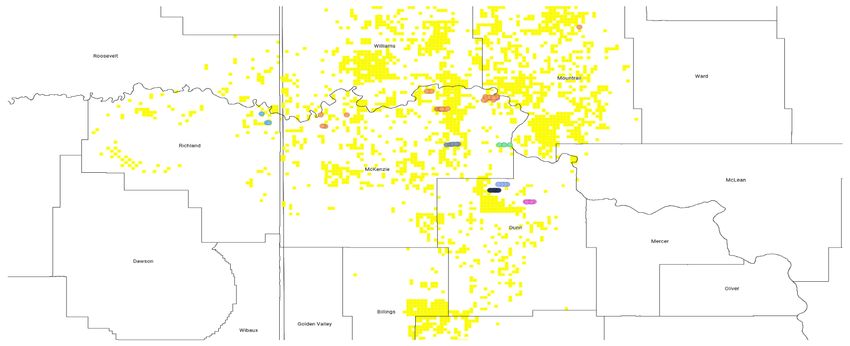
NEW NORTHERN: DIVERSIFIED HIGH RETURN NON-OP E&P FRANCHISE
                                                                                                                                                                                    NYSE American: NOG
       Ø      Northern’s pending Marcellus acquisition will create a national non-op franchise, with a significantly larger base footprint and production diversified across three leading shale plays,
              high return reinvestment opportunities across all basins, and underpinned by a simpler and stronger balance sheet
       Ø      Positioned to capitalize on increased non-operated opportunities present in the “Shale 3.0” era
             Williston Basin : ~183,000 Net Acres                                                     2021E Production                                                     3/05/21 Strip Proved PV-10
                                                                2021E Production (MBoe/d)                                           Proved Reserves (MMBoe)(2)
                                                                                                         % Liquids                                                                   ($MM)

                                                                                                                                                                                         10%
                                                                                   25%
                                                                                                                        41%                            37%
                                                                           52(1)                            52(1)                              193                                  $1,830
                                                                          MBoe/d                           MBoe/d                             MMBoe                                  MM
                                                                                                    59%                                63%
                                                                    75%
                                                                                                                                                                                   90%
                                                                                                              Region                     Commodity Type
                                                                                                      Williston &      Appalachia          Liquids    Gas
                                                                                                      Permian

                Permian Basin: ~285 Net Acres                                                                                                               Appalachia Acres: ~62,000 Net Acres

(1)   Includes pre-closing production volumes from Marcellus.
(2)   Calculated based on SEC prices as of December 31, 2020.                                                                                                                                             5
Q4:20 EARNINGS PRESENTATION - NYSE American: NOG - NYSE American: NOG - cloudfront.net
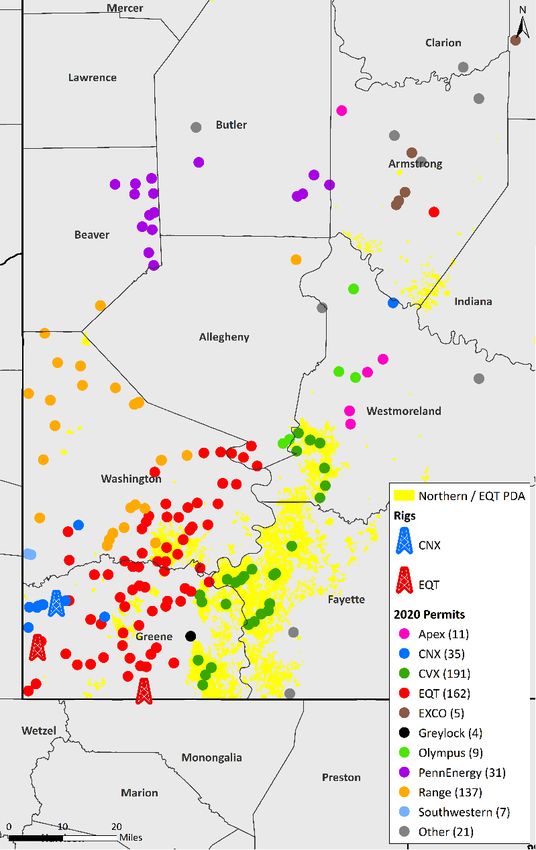
THE NEW NORTHERN OIL AND GAS
                                                                                                                                                                                                                                                  NYSE American: NOG
Ø Northern is the pre-eminent E&P with focus on non-operated model offering superior returns and free cash flow generation

                                                                                                    ü Exposure to set of leading operators in Williston and Permian (~75% production) and
                   Diversified Asset Base With                                                        Appalachia (~25% production)
                  Exposure to Leading Operators                                                     ü Shale 3.0 operator discipline providing a major increase in attractive non-operated deal flow
                                                                                                    ü Balanced and diversified portfolio by fuel and geography

                                                                                                    ü Attractive cash transaction multiple of ~$1,440 / Mcfe/d and ~2.9x 2021E unhedged cash flow
                  Marcellus Entry: Attractive
                                                                                                      from operations
               Purchase Price with Considerable
                            Upside                                                                  ü PV22 deal with identified upside of ~2.5x above the purchase price(1)

                                                                                                    ü Anticipated multi-year free cash flow generation with competitive FCF yield
                Strong Balance Sheet and Ample                                                                 ü >$125MM FCF expected in 2021(2); >15% FCF yield
                           Liquidity                                                                ü
Q4:20 EARNINGS PRESENTATION - NYSE American: NOG - NYSE American: NOG - cloudfront.net
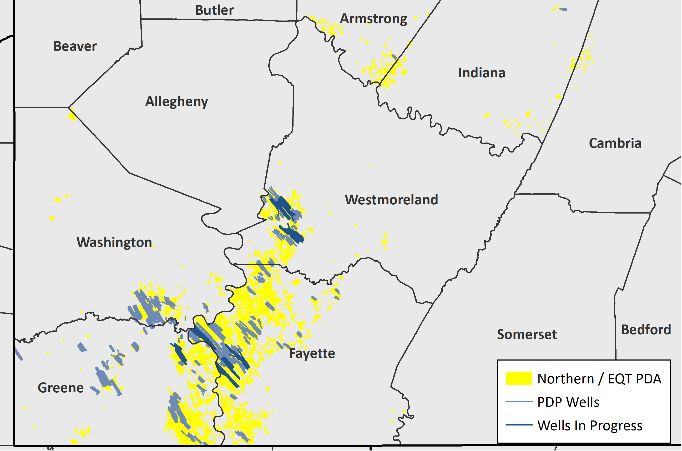
BENEFITS OF NORTHERN’S NON-OPERATOR MODEL
                                                                                                                         NYSE American: NOG

                                              HIGH RETURN WAY TO PLAY E&P SPACE
                                           Peer leading cost structure & Corporate ROCE
                                           Unit G&A costs >50% less than operating peers
                                           Scalable Model: NOG has only 25 Employees

       SHALE 3.0 BENIFICIARY                                                                       LEVERAGING EXPERIENCE
 Northern is capitalizing on industry                                                       Proprietary database, built from
 strategy shift has operators focusing                                                      participation in over 7,000 wells,
 on free cash flow generation instead                                                       including >40% of all wells drilled in the
 of growth. This has led to record level                                                    Williston
 non-op “Ground Game” opportunities

                                               CAPITAL ALLOCATION FLEXIBILITY
                    Ability to “Cherry-Pick” from over 50 Operating Partners across 1MM+ gross acres in 3 basins
                   Absolute flexibility to manage capital allocation and to do so quickly
                   Costs limited to Drilling, Completion, and acreage
                                                                                                                                         7
RETURNS METRICS CONTINUE TO LEAD THE PACK
                                                                                                                                             NYSE American: NOG
 High Return Business Driven by Low G&A Burden
                    Peer-Leading ROCE (2021)… Raymond James E&P Research Coverage
       35%
       30%
       25%
                                                                                                                       Non-operator model allows us to
       20%
       15%
                                                                                                                       run a lean cost structure and cash
       10%                                                                                                             efficient business, generating
        5%
                                                                                                                       industry-leading ROCE
        0%
       -5%

                       R

                                                                                                          Y
                       X

                                                                                            P
                                                                                            R

                                                                                                         RO
                      C

                      N

                      M

                      G
                      G

                      P

                      A

                                                                                         OM
                      C

                       S
                      N

                                                                                                        SM
                      G

                       L
                                                                                          AR
                    NG

                      D
                       I
             G
                     LP

                   NR
                   HE

                                                                                                       OX
                                                                                        KR
                   CN
                    XE

                   CO
                   RR

                                                                                         CL
                   TD
                   PX

                   NF
                  DV

                   AP
                  CO
                  SW

                   EO

                  BS
          NO

                                                                                                       M
                 FA

                                                                                      VN
                 M
                 M  ….and low G&A ($MM) per completed well (2021)
         $3.50
         $3.00
         $2.50                                                                                                         Low overhead costs mean
         $2.00                                                                                                         significantly lower SG&A expense
         $1.50
                                                                                                                       per well drilled — especially
         $1.00
         $0.50
                                                                                                                       versus SMid-cap peers
         $0.00
                 FANG NOG   LPI   PXD   COG   EOG MTDR SM     DVN   XEC   CLR   MRO SWN   RRC   NFG   AR   OXY   CNX

                                                                                                                                                            8
Source: Raymond James Research on ROCE and Cash G&A per well completed
“SHALE 3.0” PARADIGM IDEAL FOR ACTIVE NON-OP MODEL
                                                                                                            NYSE American: NOG
Capital Constrained E&P’s reassessing their Non-Op Positions

          SHALE 3.0                            Operators commit to CAPEX levels no more than 70-80% of cash flow.

                                               A growth-driven shale strategy simply hasn’t worked. US production
          BUT, WHY?                            skyrocketed, but oil prices and E&P cash flows suffered. Investors have
                                               rightfully demanded that the focus shifts to free cash flow generation and
                                               returning that capital to shareholders, which keeps US supply in check.

      GOOD FOR NOG?                            100%

                                               Under a 70-80% cash flow reinvestment scenario, every dollar matters, and
                                               operated budgets take precedent over non-op budgets regardless of
          BUT, WHY?                            economics. With these dynamics, NOG’s pipeline of “drill-ready” non-op
                                               prospects stands at an all-time high. We target
2020 GROUND GAME ADVANTAGE – SHALE 3.0 CASE STUDY
                                                                                                                                                                  NYSE American: NOG
 Highly Accretive Full Cycle Return Opportunities
                      2020 Ground Game Wells in Process Acquisitions                                                          Free Cash Flow Derivation ($MM)
                                                               2020            2021       2022       2023          100
          Net Wells Turned-in-Line                                     3.9          6.5        1.0         0.9      80
                                                                                                                                         57.9                                54.4
          Forecasted Production (boe/d)                               521        3,956      3,031       2,198       60
                                                                                                                                                     39.8
          Cash Flow From Operation (millions)(1)                      $5.3       $57.9      $39.8       $26.5       40                                           26.5
          Development Capital Expenditures                                                                          20
                                                                                                                               5.3
          (millions)                                             $34.0           $36.3       $7.8           $5.8     0
                                                                                                                                                     (7.8)       (5.8)
          Acquisition Cost (millions)                            $19.6            $0.2       $0.2           $0.2   (20)      (34.0)                  (0.2)
                                                                                                                                         (36.3)                  (0.2)
            Expected ROCE(2)                                       5%             55%        41%            28%    (40)                   (0.2)
                                                                                                                   (60)      (19.6)
                       Williston Ground Game Map                             Permian Ground Game Map                          2020       2021        2022        2023     2024-2029
                                                                                                                          Cash Flow     Capex        Acquisition Cost      Cum. FCF

                                                                                                                              200+ ground game deals executed since 2018

                                                                                                                              Only targeting deals that raise our already industry
                                                                                                                              leading ROCE

                                                                                                                              Ability to throttle activity levels up/down to fit
                                                                                                                              with optimal capital allocation strategy

                                                                                                                              Current environment is ripe for deals

1) Oil/gas price assumptions were done at the 3/05/21 Strip.
                                                                                                                                                                                      10
2) Calculated at the asset level.
MAJOR BALANCE SHEET UPGRADE ACHIEVED
                                                                                                                                                                                                                          NYSE American: NOG

                         ($ in millions)         $950 million of funded debt (100% of
                                                          total) due by 2024                                                                                                                        § Weighted Avg. Maturity: 2.4 years
                                                                                                                                                                                                    § Liquidity: $128 million
            12/31/20

                                                                                                          $128

                                                                                                          $532

                                                                                  $288
                                   $65                     $65
                                   2021                    2022                    2023                   2024                    2025                    2026                 2027                 2028           2029            2030
                                                                                          Revolver (Drawn)        Revolver (Undrawn)          Senior Secured Second Lien Notes         VEN Bakken Notes

                         ($ in millions)
                                                 $412 million of funded debt (52% of                                                           Current $660MM facility does not                     ü Weighted Avg. Maturity: 5.5 years
                                                                                                                                             incorporate added reserves from the                    ü Liquidity: $248 million
                                                         total) due by 2024
                                                                                                                                                 pending Marcellus acquisition
            3/11/21(1)

                                                                                                          $248

                                                                                                          $412                                                                                      $550

                                   2021                    2022                    2023                   2024                    2025                    2026                 2027                 2028           2029           2030

                                                                                                             Revolver (Drawn)          Revolver (Undrawn)           New Senior Notes

(1) Proforma for the expected April close of Marcellus acquisition ($108.9MM) and the planned May retirement of the ~$15.7MM of remaining Senior Secured Notes due 2023
                                                                                                                                                                                                                                          11
NOG COMMITTED TO GOOD GOVERNANCE
                                                                                  NYSE American: NOG

     ENVIRONMENTAL                        SOCIAL                     GOVERNANCE

 • Operators are selected for                                   • Separate CEO and Chairman
   environmental and safety     • NOG employees provided          roles
   records                        free health care and paid
                                  family leave                  • Significant shareholder
 • North Dakota has been a                                        representation on Board
   leader in flaring            • Northern donates to several     (>20%)
   management and gas             local charities in its
   capture                        community                     • 95% of executive incentive
                                                                  compensation in stock
 • In November, 93% of gas      • Northern currently
   was captured in the            analyzing carbon offset       • NOG G&A per Boe is among
   Williston Basin, Northern      projects                        the lowest in the industry
   properties average 94%

                                                                                                 12
NYSE American: NOG

I.   LAUNCH OF A NATIONAL NON-OP FRANCHISE
II. Q4 TAKEAWAYS AND 2021 GUIDANCE
III. MARCELLUS TRANSACTION OVERVIEW- ADJUSTED FOR
     EQT’S EXERCISED PREFERENTIAL PURCHASE RIGHT
IV. APPENDIX: SUPPLEMENTAL INFO

                                  Northern Oil & Gas, Inc. - November 2020   13
Q4:20 FINANCIAL & OPERATING HIGHLIGHTS
                                                                                                                                                                                NYSE American: NOG

                         Q4 CFFO(1)                                                         Q4 Recycle Ratio(2)                  Q4:20 Highlights
                                                                                                                                 •   CFFO(1) increased 23% from Q3 and above
                         $81.8MM                                                            2.87X                                    CAPEX: $81.8 million vs. capital expenditures of
                                                                                                                                     $48.9 million
                                                                                          Cash Margin                DD&A
                         > Q4 Capex of $48.9mm                                            $28.69/boe                 $9.97/boe   •   Strong margins and returns(2): NOG’s recycle ratio
                                                                                                                                     (2.87x) and ROCE (23.5%) remain amongst the
                           Q4 Debt Retirement                                              Q4 ROCE(2)                                best in the industry

                          -$39MM                                                           23.5%                                 • Further debt reduction: $39.0 million of debt was
                                                                                                                                   retired during Q4
                          $178mm Retired in 2020                                           Top-Tier Across Industry              • Seizing attractive Permian opportunities:
                                                                                                                                   Following Northern’s initial Permian acquisition
                                                                                                                                   announced on 9/10/20, the Company has
                           Q4 Production                                                    Active Ground Game
                                                                                                                                   transacted on 7 Permian Ground Game

                          35.7Mboe/d                                                       $30.4 MM                                acquisitions in Q4:20 and Q1:21
                                                                                                                                 • Counter cyclical investing pays off: 2020 Ground
                          4 Mboe/d estimated reduction                                     High return Ground Game                 Game investments are projected to produce a
                          from curtailments and delays                                     related Capex in Q4
                                                                                                                                   2021 ROCE of 55%

(1)   Cash flow from operations, excluding $8.8 million spent to reduce net working capital during the third quarter
(2)   See Slide 37 for definition and methodology. Recycle Ratio and ROCE may be considered non-GAAP financial measures.

                                                                                                                                                                                               14
2020 WELL PERFORMANCE SETTING RECORDS…
                                                                                                                                                                           NYSE American: NOG
 Ø Completion technology and high-grading of well locations has led to improved well recovery across the basin

                                       NOG’s INCREASING WELL PRODUCTIVITY
                                                       2015 Cum (1)
                                                                                                                       +90%                HIGHER RECOVERIES + STABLE COSTS =
                                    280,000
                                                       2016 Cum (1)
                                                       2017 Cum (1)                                                                           IMPROVED CAPITAL EFFICIENCY
                                                       2018 Cum (1)
                                                                (1)
                                                       2019 Cum
                                    240,000            2020 Cum
                                                                (1)

                                                                                                                                                  Higher type-curves versus
                                    200,000                                                                                                           other US basins
             Cum Production (Boe)

                                    160,000

                                                                                                                                             2019 wells in-line with 2018 results…
                                    120,000

                                     80,000
                                                                                                                                              …despite more step-out wells in 2019
                                     40,000

                                         0
                                              -   30    60     90     120   150   180   210   240   270   300   330   360
                                                                                                                                      2020’s program the strongest in company history
                                                                              Days Online

1.   Wells assigned to years based on year in which they started producing. Cumulative type curves comprised of the following numbers of
     gross wells: 2015 – 296; 2016 – 162; 2017 – 291; 2018 – 479; 2019-460 ; 2020-266. Includes producing wells as of December 31, 2020.
                                                                                                                                                                                         15
…AND EXCEEDS RESERVE AUDITOR EXPECTATIONS
                                                                                                                                                                              NYSE American: NOG

                                      220                                                                                                                                                220
                                                                                                                                                      2019 Internal Type Curve
                                      200
                                                                                                                         New wells exceeding                                             200
                                                                                                                         type curve by 20%
                                      180                                                                                                                                                180

                                      160                                                                                                                                                160
  Cumulative Oil Production (mbbls)

                                                           Daily Production
                                      140                                                                                                                                                140

                                      120                                                                                                                                                120

                                                                                                                                                                                               Well Count
                                      100                                                                                       Audited Type Curve                                       100

                                       80                                                                                                                                                80

                                       60                                                   2019 Internal Type Curve                                                                     60
                                                                                            Daily Production
                                       40                                                                                                                                                40
                                                                                            2019 YE Audited Type Curve
                                       20                                                   Well Count                                                                                   20

                                        -                                                                                                                                                -
                                            -   30   60       90             120             150           180            210        240        270          300        330        360
                                                                                Normalized Producing Days - Excluding Downtime
(1) Includes PDP wells as of December 31, 2020 classified as PDNP or PUD in yearend 2019 reserve report.                                                                                                    16
2021 GUIDANCE
                                                                                                                                           NYSE American: NOG

              2021 Bakken/Permian Guidance                     2021 Marcellus Guidance (full-year)                Corporate G&A Guidance (per Boe)
                                                                                                                                   Q1 Pre-RIL      Q2-Q4 Post-
  Annual Production (Boe per day) 37,750 - 42,750          Annual Production (Mmcf per day)   75 - 85
                                                                                                                                   Close           RIL Close
  Net Wells Added to Production      32 - 34               Net Wells Added to Production      3.5 - 3.8       Cash (ex one-time
                                                                                                                                   $1.10 – $1.20   $0.75-$0.85
                                                                                                              transaction costs)
  Total Capital Expenditures ($ in                         Total Capital Expenditures ($ in
                                     $180 - $225                                              $20 - $25
  millions)                                                millions)                                          Non-Cash             $0.30           $0.20
  Production Expenses (per Boe)      $8.75 - $9.75
                                                           Production, Asset G&A and
                                     10% of Net Oil                                           $0.85 - $0.95
                                                           Marketing Expenses (per Mcf)
  Production Taxes                   Revenues, $0.06 per
                                     Mcf for Natural Gas   Average Differential to NYMEX
                                                                                              $0.55 - $0.65
                                                           Henry Hub (per Mcf)
  Oil as a Percentage of
                                     78 - 80%
  Production Volumes
  Average Differential to NYMEX
                                     $6.50 - $8.50
  WTI

                                                                                                                                                             17
Source: Company disclosures.
NYSE American: NOG

I.   LAUNCH OF A NATIONAL NON-OP FRANCHISE
II. Q4 TAKEAWAYS AND KEY POINTS
III. MARCELLUS TRANSACTION OVERVIEW- ADJUSTED FOR
     EQT’S EXERCISED PREFERENTIAL PURCHASE RIGHT
IV. APPENDIX: SUPPLEMENTAL INFO

                                  Northern Oil & Gas, Inc. - November 2020   18
RELIANCE APPALACHIA TRANSACTION OVERVIEW
                                                                                                                                                                                                                                                           NYSE American: NOG

                                                   §      Northern agreed to acquire a non-operated interest in Appalachia natural gas assets from Reliance Marcellus, LLC
             Transaction                                  (“Reliance”) for an unadjusted cash purchase price of $126.4MM plus equity warrants issued to Reliance upon closing(1)
              Summary                                         §      Effective date of July 1, 2020 with expected closing in April 2021; transaction subject to customary purchase price
                                                                     adjustment and satisfaction of customary closing conditions

               Financing                           §      The transaction was funded through a $140MM equity raise and a $550MM debt offering

                                                   §      Attractive valuation: PDP + wells-in-process PV10 of $238MM vs. $126MM cash purchase, equates to a PV22
                                                          transaction. Implied multiples of ~$1,440 flowing Mcfe/d and ~2.9x expected 2021 unhedged cash flow from operations
                                                   §      Accretive on what matters: Go-forward leverage, free cash flow, return on capital employed, EV/EBITDA, corporate
                                                          decline rate, and sustaining capital requirements
                                                   §      Considerable free cash flow: $95MM of free cash flow expected over the next four years, average free cash flow yield of
                                                          >18% over that timeframe
               Rationale                           §      Tangible upside identified with EQT taking over as operator: >$200MM of potential upside value if EQT succeeds in
                                                          lowering G&A costs, well costs, and improves well performance
                                                   §      Catalyst for a meaningful balance sheet improvement: Line-of-sight to achieve leverage of
ENTRY INTO ATTRACTIVE BASIN WITH A LEADING LOW COST
OPERATOR – EQT
                                                                                                                                                                                                                                                                    NYSE American: NOG

                                                 • Non-operated interests in the Reliance / EQT Participation and Development Agreement
                                                   (“PDA”)
                                                       • Average, blended working interest of ~27%
                                                 • EQT announced its acquisition of Chevron’s Appalachia interests in September 2020
                                                 • July 2020 production (net to Northern) of ~88 MMcfe/d, 95.1 net wells, and ~62,000 net
           Asset Overview                          acres
                                                 • Total unadjusted cash purchase price of ~$181MM (and warrants(2)) with Arch Energy
                                                   Partners acquiring an undivided 30% interest in the assets for a cash purchase price of
                                                   ~$54MM
                                                            • Arch entered into a cooperation agreement with Northern simultaneous with the
                                                              execution of the acquisition agreement

                                                 • 21.6 Marcellus net work-in-progress ("WIP") wells expected to add substantial, near-term
                                                   cash flow with high capital efficiency
           Attractive Near                                                                                                                                                                                                                                                      (1)

                                                 • Preliminary 2021 and 2022 budget confirms development of both wells in process and
            Term Projects                          additional development of undeveloped locations
                                                 • Development plan provides production growth while remaining free cash flow positive
                                                                                                                                                                                                                                                                                (1)

                                                 • ~1,150 gross undeveloped locations (management estimate)
            Low Risk High                              • IRRs of 33% - 93% at strip as of March 5, 2021
            Impact Upside                        • EQT is a low-cost operator in Appalachia and will look to optimize development with a
                                                   lean operating structure and capital cost reduction targets for Marcellus wells of
PV22 DEAL WITH MEANINGFUL UPSIDE
                                                                                                                                              NYSE American: NOG
Ø In addition to operational improvements and capital efficiencies future performance is expected to benefit from operational expertise from EQT

                                                                                        >$250MM in Potential Value Upside

                                                                                                                                                                               >$400MM

                     ~$126MM

             Cash Purchase Price                    PDP + WIP PV10       G&A Savings            Capex Reductions         Productivity Uplift          Undeveloped              Total Value
                                                                                                                                                       Inventory
             • Transaction             • PDP + WIP PV10              • Estimated G&A           • Opportunity for ~15%    • EQT’s current wells in • Assumes asset is run in
               underwritten on basis     based on reserve              reduced by >2/3 in        reduction from previous   this area have >20%      maintenance case for
               of Chevron as operator,   report                        2021 and 2022 vs. 2020    operator $/ft D&C by      productivity compared    2025+ (~8 net wells per
               significant                                             based on most recent      moving inline with EQT    to previous operator     year)
               opportunities for                                       budget proposal           targets                                          • Significant undeveloped
               improvement                                           • Previous operator had • Recent WIP D&C cost                                  resource
                                                                       ~1,000 employees          proposals below $700/ft                          • 7 undeveloped locations
                                                                       working on the asset at                                                      have been converted into
                                                                       one point; EQT is more                                                       new WIPs already
                                                                       efficient
Source: Management projections and Reliance data.                                                                                                                                            21
RELIANCE APPALACHIA: ASSET-LEVEL PROJECTION DETAIL
                                                                                                                                                                                        NYSE American: NOG
Ø Projections assume PDP and WIP completions and no further development of new wells (strip pricing as of 3/5/21)

                           Production (MMcfe/d)                                                                                Cash Flow From Operations ($MM)
                        150                                                                                                     $100

                            0                                                                                                     $0
                                          2021                      2022                      2023                      2024            2021            2022             2023                2024

                           ROCE(1)                                                                                             Free Cash Flow ($MM)
                        40%                                                                                                     $80
                                                                                                                                         Cumulative free cash flow >$95MM from 2021 – 2024

                          0%                                                                                                    $0
Source: NOG Management projections.       2021                      2022                      2023                      2024           2021            2022             2023             2024
Note: Shown at 70% ownership of Reliance PDA asset. Strip pricing as of 3/5/21.                                                                                                                        22
(1) ROCE calculated as EBIT / Capital Employed. Capital Employed is calculated as Total Assets – Current Liabilities.
EQT EXPECTED TO DRIVE MATERIAL IMPROVEMENTS IN
OPERATIONAL PERFORMANCE AND COST LEADERSHIP
                                                                                                                                                                                                            NYSE American: NOG
Ø EQT expected to deliver better operating results with lower costs and will benefit from economies of scale and application of best practices

                     EQT vs CVX Production Performance                                                                                              PA Marcellus Well Costs(1) ($/ft)
      700
                                                                  EQT has a >20% uplift
                                                                after the first three years                                                                               >2 0 %
                                                                                                                                                                                   impro
      600                                                               historically                                                                                                    vemen
                                                                                                                                                                                             t year
                                                                                                                                                                                                      over y
                                                                                                                                                       $970                                                  ear
      500
                                                                                                                                                                  $850
                                                                                                                                                                           $800
                                                                                                                                                                                                                   Target: $700
      400                                                                                                                                                                                  $745
                                                                                                                                                                                                           $680              $660
      300

      200

      100

         0
             0                 6                  12                  18                  24                  30                 36

                                                               CVX           EQT

                                                                       Average Lateral Average IP90                                                  Legacy (FY   3Q19     4Q19            1Q20            2Q20              3Q20
                          Operator               Well Count              Length (ft)   (Mcfpd / 1,000')                                                2019E)

                              CVX                      35                     6,189                     587
                              EQT                      43                     9,789                   1,049
Source: Public disclosures.
Note: Using wells with first production in 2016+, located in Greene, Fayette, and Washington Counties and producing from the Marcellus reservoir.
(1) Includes pad construction and production facilities.
                                                                                                                                                                                                                                    23
NATURAL GAS DIVERSITY WELCOMED
                                                                                                                                                                                               NYSE American: NOG
                                                   • Rapid decline in oil-directed activity materially reduces associated gas          Rig Counts
                                                                                                                                       450
                                                     supply
                                                                                                                                       400
                                                              • U.S. rigs down ~51% reducing well inventory and affecting future gas
                                                                supply                                                                 350

                                                                                                                                       300
                                                   • Appalachia and Haynesville rig counts are well below maintenance activity
          Expectations for an                        levels                                                                            250
            Undersupplied                                                                                                              200
                                                   • Gas producers are focused on deleveraging and cash flow, reducing dry gas
            Market in 2021                           growth                                                                            150

                                                   • Current commodity price environment does not incentivize adequate supply          100

                                                     response to meet future growth                                                     50

                                                              • Gas markets may be short supply over the near term suggesting an         0
                                                                undervalued strip                                                              Permian     Eagle Ford    Appalachia       MidCon         Other
                                                                                                                                                                        Jan-20   Jan-21

                                                                                                                                       Natural Gas Strip Price ($/MMBtu)
                                                                                                                                       $3.50
                                                   • Natural Gas Prices strengthen as demand loss more than offset by supply
                                                     declines
                                                                                                                                       $3.00

          Natural Gas Pricing                                 • Witnessed modest declines in lower 48 gas production, requires
            Environment                                         cautious approach to higher prices                                     $2.50

              Improves
                                                                                                                                       $2.00
                                                   • Long-term price support expected from continued capital discipline, increased
                                                     power generation demand, long-term LNG demand and coal/nuclear
                                                     retirements                                                                       $1.50
                                                                                                                                               Q1 2021 Q2 2021 Q3 2021 Q4 2021 Q1 2022 Q2 2022 Q3 2022 Q4 2022

                                                                                                                                                         Strip as of 1.1.20               Strip as of 1.20.21

Source: EIA, Baker Hughes, Wall Street Research, and Factset as of 1/20/21.                                                                                                                                      24
NYSE American: NOG

I.   LAUNCH OF A NATIONAL NON-OP FRANCHISE
II. Q4 TAKEAWAYS AND KEY POINTS
III. MARCELLUS TRANSACTION OVERVIEW- ADJUSTED FOR
     EQT’S EXERCISED PREFERENTIAL PURCHASE RIGHT
IV. APPENDIX: SUPPLEMENTAL INFO

                                  Northern Oil & Gas, Inc. - November 2020   25
DIVERSIFIED BASE & PARTNERED WITH BASIN LEADERS
                                                                                                                    NYSE American: NOG
 Ø Leverage to some of the best performing operators in multiple basins

                                 % OF NET PRODUCING WELLS BY OPERATOR
                        OTHERS (65% of Q4 2020’s wells in process are
                                                                                  12%
                                                                                          operated by ConocoPhillips,
                                          4%                                              Continental Resources, Slawson,
                                           5%                                             Enerplus, WPX and Mewbourne
                                                                                 10%    ü 97% of wells in process are located in
                                               6%
                                                                                          the ‘Big 4’ counties
                                                        7%
                                                                           9%
                                                                      9%

Source: Producing wells as of 12/31/20 inclusive of Reliance acquisition
                                                                                                                                   26
NON-OP OF SCALE WITH IMPROVING COST STRUCTURE
                                                                                                                                                                                                             NYSE American: NOG
  Ø Participation in the highest quality wells with stable AFE costs generates consistent production & higher IRRs
                         CONSISTENTLY FUNDING ATTRACTIVE WELLS…                                                              …GENERATES CONSISTENT PRODUCTION
                  Organic Net Wells added to Production                                                                                                      Production (mBoe/d)
                  Wells In Process @ Period End
                                                                                                                             Material, but measured
                     Consistent well                                                                                          historical production
                                                             14.6                                                                    growth
                      participation               13.3                                                                                                                 43.9
                                                                         7.3          1.3       3.4           5.9                                                               43.7
                           7.0         8.1                                                                                        36.3                        40.8                                           35.7
               7.7                                                                                                                         34.6      35.0
                                                                        27.2       26.7         28.3      28.1                                                                                     29.1
                          24.7         25.0       24.2       25.8                                                                                                                         23.8
               22.8

              Q4 '18      Q1 '19      Q2 '19     Q3 '19     Q4 '19      Q1'20     Q2'20         Q3'20     Q4'20                  Q4 '18    Q1 '19   Q2'19     Q3 '19   Q4 '19   Q1 '20    Q2'20    Q3'20     Q4'20

                         PARTICIPATING IN COST-EFFECTIVE AFES…                                                             …WHILE MAINTAINING PEER-LEADING LOW CASH G&A1
                                                  Avg. Consented Well AFE ($MM)                                                                                 Cash G&A per BOE
                                                                                                                                                    Reduc
                          Declining well costs across Williston counties                                                                                 ing ov
                                                                                                                                                                erhead                    *$1.61
                                                                                                                                                                       G&           A cost           $1.39
                       $8.1        $8.2        $7.7       $7.7      $8.1       $7.6         $7.7       $7.0         $7.2                            $1.13     $1.15
                                                                                                                                          $1.06
                                                                                                                                                                                 $0.95
                                                                                                                                                                                                              $1.04
                                                                                                                               $0.92                                   $0.91

                       Q4 '18      Q1 '19     2Q '19     Q3 '19     Q4 '19     Q1'20        Q2'20     Q3'20     Q4'20           Q4 '18    Q1 '19    Q2 '19    Q3 '19   Q4 '19    Q1 '20    Q2'20     Q3'20     Q4'20
1. Cash G&A is a non-GAAP financial measure. Please see the appendix for reconciliation to the most directly comparable GAAP Measure.
                                                                                                                                                                                                                           27
2. Increase reflects 46% reduction in production. On a non-per BOE basis, cash G&A actually declined by 8% sequentially.
CURRENT BAKKEN SNAPSHOT
                                                                                                                                                        NYSE American: NOG
 Ø Portfolio of high-quality acreage in the heart of the basin with interests in over 7,000 gross Bakken/Three Forks oil wells
                                                          NET ACREAGE SUMMARY

                            9%                                              9%                                    8%
                                                                                                                                        183,242
                                                                                                                                            NET ACRES

                                  91%                                             91%                                  92%

                North Dakota            Montana                       HBP 1      % Non-HBP            ND % HBP1 ND % Non-HBP                91%
                                                                                                                                       HELD BY PRODUCTION1
                                                            NET ACRES BY COUNTY
                   49,962                                                                        Northern’s top counties are the
                                       37,351                                                   ‘Big 4’ in the core of the Williston
                                                          28,507
                                                                              17,594         16,325      17,016          16,487              40+
                                                                                                                                       OPERATOR PARTNERS

                  McKenzie            Mountrail           Williams             Dunn          Divide       Other    Montana and Other
                                                                   NORTH DAKOTA                                       MONTANA

Source: Company data as of 9/30/20. ‘HBP’ is acreage held by production
                                                                                                                                                                      28
1. Includes acreage classified as held by production, held by operations or developed
STRONG BAKKEN INVENTORY DRIVES NAV UPSIDE
                                                                                                                                    NYSE American: NOG
                      Undeveloped Locations By Operator                                        Undeveloped Locations By Reservoir
                                                                                                               TF3
                      OTHERS                      114.5                                                        41.7
                                  155.5
                                                                                                       TF2
                                                                                                      115.1
                           26.4                               88.0                                                    BKKN
                          28.1                                                                                        329.0
                           32.2
                                                              83.3                                      TF1
                             47.1                                                                      285.6

                                    60.7            74.1
                                           61.5

                      Undeveloped Locations By County                       Key Takeaways
                                                                     ü Over 60% of 771 future drilling locations controlled by strong
                                  OTHERS
                                                   MCKENZIE
                                                                       balance sheet companies such as Continental, Hess, Slawson, XTO,
                                   179.2
                                                    206.0              Petro-Hunt, and ConocoPhillips
                           DUNN
                            56.3                                     ü 77% of net locations in ‘Big 4’ counties
                              MOUNTRAIL            WILLIAMS
                                149.7               180.1            ü Conservative booking approach with minimal locations in lower
                                                                       bench Three Forks
Source: Company info – Undeveloped inventory as of 12/31/19
                                                                                                                                                  29
2020 BAKKEN WELLS WERE IN STRONG AREAS
                                                                                                       NYSE American: NOG
 Ø The 2020 program was focused in core areas
                                                                                Williston Basin Core

                       NOG’S DATA ADVANTAGE

                                                          NORTHERN HAS
                               45%                    PARTICIPATED IN ~45% OF
                                                       WELLS EVER DRILLED IN
                                                        THE WILLISTON BASIN

                                         HIGHLIGHTS
            ü Positive reserve performance adjustments
              in 4 of last 6 years
            ü Top-tier return on capital metrics

Sources: Company info, and North Dakota Industrial Commission                                                        30
HEDGE PROFILE
                                                                                                                                                                                  NYSE American: NOG
 Ø Northern continues to execute a strategy built around the safeguard of returns during a commodity down-cycle, while
   retaining flexibility to capture the opportunistic upside
               CRUDE OIL DERIVATIVE PRICE SWAPS                                                             NATURAL GAS DERIVATIVE PRICE SWAPS
                                                                                                                                                          Total Hedged
                        Contract                                  Total Hedged    Weighted Average Price   Contract   Million British Thermal Units Per                  Weighted Average Price
                                      Barrels Per Day (Bbls/d)                                                                                              Volumes
                         Period                                  Volumes (Bbls)          ($/Bbl)            Period             Day (mmbtu/d)                                  ($/mmbtu)
                                                                                                                                                            (mmbtu)
        2021(1):           Q1                   24,333             2,190,000              $55.66             Q1                    37,500                  3,375,000             $2.473
                           Q2                   24,200             2,202,208              $56.37             Q2                    65,104                  5,924,507             $2.741
                           Q3                   23,168             2,131,410              $54.13             Q3                    97,598                  8,979,028             $2.822
                           Q4                   23,071             2,122,506              $53.76             Q4                    95,481                  8,784,210             $2.817
                       Avg./Total               23,688             8,646,124              $55.00                                   74,145                  27,062,745            $2.759

        2022(1):           Q1                   12,000             1,080,000              $51.29             Q1                    30,000                  2,700,000             $2.980
                           Q2                   10,250              932,750               $51.20             Q2                    10,000                   910,000              $2.612
                           Q3                   10,750              989,000               $51.49             Q3                    10,000                   920,000              $2.612
                           Q4                   10,750              989,000               $51.49             Q4                    10,000                   920,000              $2.612
                       Avg./Total               10,934             3,990,750              $51.37                                   14,932                  5,450,000             $2.795

         2023:             Q1                    1,250              112,500               $51.65             Q1                       -                        -                   -
                       Avg./Total                1,250              112,500               $51.65                                      -                        -                   -
Ø In addition, Northern has approximately 13,930 barrels per day of Clearbrook linked hedges at approximately ($2.38)
Ø Northern also has 0.5 mmbtu/day of Waha natural gas basis hedges for 2H21 for growing Permian volumes
Ø Northern also has 17,900 mmbtu/day of natural gas basis hedges for 2021 and 9,750 mmbtu/day for 2022 related to Appalachia volumes at approximately ($0.613)

(1) See hedging disclosures in the back of this presentation.
                                                                                                                                                                                                  31
WELL POSITIONED TO WEATHER REGULATORY HEADWINDS
                                                                                                                                                                                     NYSE American: NOG

                               Federal Land Policy Risk

                 Ø Northern has minimal exposure to federal lands with ~8% of total leasehold position subject to the federal regulation

                 Ø Across the ~14,500 net acres on federal land there is currently a backlog of 220 federal permits that have already been approved

                 Ø Additionally, there are 340 permits that have been approved by the North Dakota Industrial Commission that have no exposure to federal acreage or
                   regulatory process

                               Dakota Access Pipeline Considerations                           Bakken Crude Oil Takeaway Capacity by System
                                                                                                        3.00                                                       2.72         2.75          2.68
                 Ø NOG is well positioned for a possible DAPL shutdown given strong                     2.50                                      2.32
                                                                                                                                                         2.44
                                                                                                                                        2.23
                   diversity in exposure to all key Bakken operators                                                       1.92
                                                                                                        2.00   2.62
                            Ø Benefits include access to various transportation links (other

                                                                                               MMbl/d
                                                                                                        1.50
                              pipelines, rail, trucking) through diverse base of operators
                                                                                                        1.00

                 Ø In the worst case – the estimated incremental cost of a DAPL shutdown                0.50
                   to NOG is ~$2/Bbl                                                                    0.00
                                                                                                               2013       2014          2015      2016   2017      2018         2019         2020
                                                                                                                 Local Refining Capacity                        Butte Pipeline
                                                                                                                 Enbridge North Dakota Pipeline                 Enbridge Bakken Expansion Pipeline
                                                                                                                 Plains Bakken North Pipeline                   Kinder Morgan Double H Pipeline
                                                                                                                 Bridger Expansion Project                      ETP Dakota Access Pipeline
                                                                                                                 Rail Loading Capacity                          Bakken Production
                                                                                                                                                                                                     32
Source: Company disclosures and IHS Markit.
NORTHERN’S SENIOR MANAGEMENT TEAM
                                                                                                                                                      NYSE American: NOG
       Nicholas O’Grady: Chief Executive Officer
       Ø Nicholas O’Grady has served as Chief Executive Officer since January 2020, following ~18 months as the Company’s Chief Financial Officer. Mr. O’Grady leads the
           Northern team in all respects of the business, including investments, financial management and business strategy. He has nearly two decades of finance
           experience, both as an investment banker and as a principal investor. Mr. O’Grady began his career in the Natural Resources investment banking group at Bank
           of America, later moving to the hedge fund industry, with roles at Highbridge Capital Management and Hudson Bay Capital Management.
       Adam Dirlam: Chief Operating Officer
       Ø Adam Dirlam has served as Chief Operating Officer since January 2020 following roles as Executive Vice President - Land & Operations since May 2018, Senior
          Vice President of Land & Operations since 2013 and various other roles upon joining the Company in 2009. Mr. Dirlam leads the M&A and capital allocation
          efforts. Prior to Northern, Mr. Dirlam served in various finance and accounting roles for Honeywell International.
       Mike Kelly, CFA: Chief Strategy Officer
       Ø Mike Kelly was named Chief Strategy Officer in February 2021 after serving as the Executive Vice President of Finance since joining Norhtern in January 2020.
           Mr. Kelly leads the business development function, helping source and analyze potential acquisitions. He also plays an integral role in Northern’s financial
           planning and investor relations. Prior to joining Northern, Mr. Kelly was a Partner and Head of E&P Research at Seaport Global Securities, where he was a
           Partner and Head of E&P Research covering over 30 companies in the exploration and production sector since 2011. Prior to that, he spent over five years
           working as an energy analyst for Kennedy Capital Management in St. Louis.

       Chad Allen: Chief Financial Officer
       Ø   Chad Allen has served as Chief Financial Officer since January 2020 following roles as Chief Accounting Officer since August 2016 and Corporate Controller upon
           joining the Company in August 2013. He was also interim CFO from January-May 2018. Mr. Allen leads all accounting, financial and public company related
           functions. Prior to joining Northern, Mr. Allen was in the audit practice with Grant Thornton LLP from 2010 to 2013, and in the audit practice at McGladrey &
           Pullen, LLP from 2004 to 2010.
       Erik Romslo, Chief Legal Officer and Secretary
       Ø Erik Romslo has served as Chief Legal Officer since January 2020 after joining the Company as General Counsel and Secretary in October 2011 and being named
            Executive Vice President in January 2013. Mr. Romslo oversees all legal, regulatory and SEC related matters as Chief Legal Officer, and facilitates all Board
            functions as Secretary. Prior to joining the Company, Mr. Romslo practiced law in the Minneapolis office of the Company’s outside counsel, Faegre Drinker
            Biddle & Reath LLP (formerly Faegre & Benson LLP), from 2005 until 2011, in which he was a member of the Corporate group.
       Jim Evans: Executive Vice President and Chief Engineer
       Ø Jim Evans was named Executive Vice President and Chief Engineer in February 2021 following roles as Vice President of Engineering since June 2018 and
            Reservoir Engineering Manager since 2015. Mr. Evans oversees all aspects of Northern’s engineering process, including the valuation of properties, reserves and
            production forecasting. He began his career as a Reservoir Engineer with Cabot Oil & Gas, overseeing the reserves and development planning for the Green River
                                                                                                                                                                            33
            Basin, and has also held roles at Cornerstone Natural Resources and Fidelity Exploration.
HISTORICAL OPERATING & FINANCIAL INFORMATION
                                                                                                                                                                                                                     NYSE American: NOG

                                       HISTORICAL OPERATING INFORMATION                                                                    YEAR ENDED DECEMBER 31,                                                   THREE MONTHS ENDED,
                                                                                    2015           2016           2017           2018                 2019                  2020               December 31, 2019         December 31, 2020
                                                                  PRODUCTION
                                                                    Oil (MBbls)          5,168.7        4,325.9        4,537.3        7,790.2                11,325.4                9,361.1               3,218.9                    2,508.6
                                                 Natural Gas and NGLs (Mmcf)             4,651.6        4,026.9        5,187.9        9,224.8                16,590.8               16,473.3               4,942.2                    4,675.9
                                                      Total Production (Mboe)            5,944.0        4,997.1        5,402.0        9,327.6                14,090.5               12,106.7               4,042.6                    3,287.9
                                                                      REVENUE
                       Realized Oil Price, including settled derivatives ($/bbl)     $     68.94    $     49.44    $     45.92    $     57.78                $     54.66        $     52.69        $        51.91             $        50.20
     Realized Natural Gas and NGL Price, including settled derivatives ($/Mcf)              1.60           1.82           3.74           4.74                       1.60               1.14        $         0.47             $         2.13
             Total Oil & Gas Revenues, including settled derivatives (millions)            363.7          221.2          227.7          471.0                      645.6              512.3        $        169.4             $        135.0
                                                Adjusted EBITDA (millions)(1)              277.3          148.5          144.7          349.3                      454.2              351.8        $        114.2             $         94.3
                                          KEY OPERATING STATISTICS ($/Boe)
                                                       Average Realized Price        $     61.19    $     44.27    $     42.16    $     50.50                 $ 45.82           $ 42.32             $       51.91             $        41.06
                                                         Production Expenses                8.77           9.14           9.21           7.15                    8.44              9.61                      8.84                       8.58
                                                            Production Taxes                3.63           3.10           3.81           4.86                    4.10              2.46                      3.92                       2.75
                                   General & Administrative Expenses-Cash                   2.15           2.31           2.38           1.15                    1.11              1.19                      1.10                       1.04
                                                              Total Cash Costs       $     14.55    $     14.55    $     15.40    $     13.16                 $ 13.65           $ 13.26             $       13.86             $        12.37
                                                   Operating Margin ($/Boe)          $     46.64    $     29.72    $     26.76    $     37.34                 $ 32.17           $ 29.06             $       28.05             $        28.69
                                                          Operating Margin %               76.2%          67.1%          63.5%          73.9%                   70.2%             68.7%                     66.9%                      69.9%

                     HISTORICAL FINANCIAL INFORMATION ($'S IN MILLIONS)
                                                                                            2015           2016           2017          2018                        2019               2020    December 31, 2019         December 31, 2020
                                                                         ASSETS
                                                                 Current Assets      $     128.8    $      46.9    $     152.8    $   228.4                  $   133.0          $     125.6         $        133.0            $        125.6
                                                  Property and Equipment, net              589.3          376.2          473.2      1,202.7                    1,748.6                735.2                1,748.6                     735.2
                                                                   Other Assets             15.8            8.4            6.3         72.5                       23.8                 11.3                   23.8                      11.3
                                                                   Total Assets      $     733.9    $     431.5    $     632.3    $ 1,503.6                  $ 1,905.4              $ 872.1            $   1,905.4                $    872.1
                                                                    LIABILITIES
                                                              Current Liabilities    $   78.1       $   77.4       $  123.6       $   231.5                  $      203.5       $   182.5           $        203.5            $       182.5
                                                                           Debt         847.8          832.6          979.3           830.2                      1,118.2            879.8                  1,118.2                    879.8
                                                     Other Long-Term Liabilities          5.6            8.9           20.2            12.0                          25.1            33.1                     25.1                     33.1
                                                   Stockholders' Equity (Deficit)      (197.6)        (487.4)        (490.8)          429.9                         558.6         (223.3)                    558.6                  (223.3)
                               Total Liabilities & Stockholders' Equity (Deficit)    $ 733.9        $ 431.5        $ 632.3        $ 1,503.6          $           1,905.4        $ 872.1                $   1,905.4                $ 872.1
                                                             CREDIT STATISTICS
                                 Adjusted EBITDA (Annual, Q2 2019/20 TTM)            $     277.3    $     148.5    $     144.7    $     349.3            $          454.2   $         351.8         $        454.2            $        351.8
                                                                       Net Debt      $     831.9    $     826.1    $     877.1    $     832.7                     1,111.7             948.3         $      1,111.7            $        948.3
                                                                     Total Debt      $     835.3    $     832.6    $     979.3    $     835.1                     1,127.7             949.8         $      1,127.7            $        949.8
                                                     Net Debt/Adjusted EBITDA               3.0x           5.6x           6.1x           2.4x                        2.4x              2.7x                   2.4x                      2.7x
                                                    Total Debt/Adjusted EBITDA              3.0x           5.6x           6.8x           2.4x                        2.5x              2.7x                   2.5x                      2.7x
1.   Adjusted EBITDA is a non-GAAP measure. See reconciliation on the slide that follows.
                                                                                                                                                                                                                                                34
NON-GAAP RECONCILIATIONS: EBITDA & OTHER
                                                                                                                                                                                                                     NYSE American: NOG
                                              Adjusted EBITDA by Year (in thousands)
                                                                                                            2015           2016           2017           2018           2019           2020
                                              Net Income (Loss)                                         $    (975,355) $    (293,494) $     (9,194) $     143,689   $    (76,318) $     (906,041)
                                                Add:
                                                  Interest Expense                                             58,360        64,486        70,286          86,005        79,229            58,503
                                                  Income Tax Provision (Benefit)                             (202,424)        (1,402)       (1,570)            (55)           -              (166)
                                                  Depreciation, Depletion, Amortization and Accretion         137,770        61,244        59,500         119,780       210,201          162,120
                                                  Impairment of Oil and Natural Gas Properties              1,163,959       237,013             -              -              -        1,066,668
                                                  Impairment of Other Current Assets                               -              -             -              -           6,398               -
                                                  Non-Cash Share Based Compensation                             6,273          3,182         6,107          3,876          7,954            4,119
                                                  Write-off of Debt Issuance Costs                                 -           1,090             95            -              -             1,543
                                                  (Gain) Loss on the Extinguishment of Debt                        -              -            993        173,430        23,187             3,718
                                                  Debt Exchange Derivative (Gain) Loss                             -              -             -             598         (1,390)              -
                                                  Contingent Consideration (Gain) Loss                             -              -             -          28,968        29,512               169
                                                  Severance - Cash                                                 -              -             -              -             759               -
                                                  Financing Expense                                                -              -             -             884          1,447               -
                                                  (Gain) Loss on Unsettled Interest Rate Derivatives               -              -             -              -              -             1,019
                                                  (Gain) Loss on Unsettled Commodity Derivatives               88,716        76,347        18,443        (207,892)      173,214           (39,878)
                                              Adjusted EBITDA                                           $     277,299 $     148,466 $     144,660 $       349,283 $     454,193 $        351,774

                                              Adjusted EBITDA by Quarter (in thousands)
                                                                                                            2Q19           3Q19           4Q19           1Q20           2Q20           3Q20              4Q20
                                              Net Income (Loss)                                         $     44,399   $     94,381   $   (107,937) $     368,286   $   (899,200) $     (233,060) $      (142,123)
                                                Add:
                                                  Interest Expense                                             17,778         21,510       20,393          16,551        13,957          14,693           13,358
                                                  Income Tax Provision (Benefit)                                   -              -             -            (166)           -                -               -
                                                  Depreciation, Depletion, Amortization and Accretion          46,091         55,566       63,411          61,809        36,756          30,786           32,769
                                                  Impairment of Oil and Natural Gas Properties                     -              -             -              -        762,716         199,489          104,463
                                                  Impairment of Other Current Assets                            2,694          5,275        (1,571)            -             -                -               -
                                                  Non-Cash Share Based Compensation                             1,643           (114)        3,674          1,078         1,214              890             936
                                                  Write-off of Debt Issuance Costs                                 -              -             -              -             -             1,543              -
                                                  (Gain) Loss on the Extinguishment of Debt                       425             -        22,762           5,527          (217)          (1,592)             -
                                                  Debt Exchange Derivative (Gain) Loss                          4,874              23           -              -             -                -               -
                                                  Contingent Consideration (Gain) Loss                         24,763          5,262           879             -             -                -              168
                                                  Severance - Cash                                                 -              -            759             -             -                -               -
                                                  Financing Expense                                                -              -          1,447             -             -                -               -
                                                  (Gain) Loss on Unsettled Interest Rate Derivatives               -              -             -             677           752             (224)           (186)
                                                  (Gain) Loss on Unsettled Commodity Derivatives              (31,857)       (57,506)     110,408        (345,075)      150,077          70,198           84,923
                                              Adjusted EBITDA                                           $    110,810 $      124,396 $     114,225 $       108,687 $      66,055 $        82,723 $         94,308

                                              Other Non-GAAP Metrics by Quareter (in thousands)
                                                                                                            2Q19           3Q19           4Q19           1Q20           2Q20           3Q20              4Q20
                                                 Cash General and Adminstrative Expense                 $      3,607   $      4,319 $        4,443   $      3,792   $      3,495   $      3,716      $      3,425
                                                 Non-cash General and Adminstrative Expense                    1,643           (114)         3,674          1,079          1,214            889               936
                                                 Total General and Adminstrative Expense                $      5,250   $      4,206 $        8,117   $      4,871   $      4,709   $      4,605      $      4,361

                                                 Net Production (Boe)                                          3,182          3,752          4,043          3,980          2,166           2,673            3,288
                                                 Cash General and Adminstrative Expense per Boe         $       1.13   $        1.15 $        1.10   $       0.95   $       1.61   $        1.39     $       1.04
                                                 Non-cash General and Adminstrative Expense per Boe     $       0.52   $       (0.03) $       0.91   $       0.27   $       0.56   $        0.33     $       0.29

                                                 Total Principal Balance on Debt                        $    861,491 $     1,145,491 $ 1,127,733 $ 1,047,489 $          995,287 $       988,755 $        949,755
                                                 Less: Cash and Cash Equivalents                               (2,794)         (1,901)    (16,068)     (8,512)            (1,838)         (1,803)          (1,428)

Note: Adjusted EBITDA is a non-GAAP measure
                                                 Net Debt                                               $    858,697 $     1,143,590 $ 1,111,665 $ 1,038,977 $          993,449 $       986,952 $        948,327                   35
NON-GAAP RECONCILIATIONS: ROCE & RECYCLE RATIO
                                                                                                                                          NYSE American: NOG

                      Q4:20 Return on Capital Employed (ROCE)
                                                                                             • EBIT: $246.2MM (Q4:20 annualized)
                                                                                                 • + Adj. EBITDA: $94.3MM
                                                Capital
                  EBIT                 ÷       Employed
                                                                          =          23.5%
                                                                                                 • - DD&A: $32.76MM
                                                                                             • Capital Employed: $1,049MM (Avg. of Q4:19/20)
                                                                                                 • + Total Assets: $1,242MM (Avg.)
                                                                                                 • - Current Liabilities: $193MM (Avg.)

                      Q4:20 Recycle Ratio

                                                                                              • Cash Margin: $30.94/boe
                Cash                               DD&A                                           • + Realized avg. commodity price: $41.06/boe
               Margin                  ÷            Rate
                                                                          =          2.69x        • - Cash Costs: $12.37/boe(1)
                                                                                              • DD&A Rate: $9.97/boe

(1) Incorporates Adjusted Cash G&A of $1.04/boe, which excludes stock compensation
Note: Adjusted EBITDA is a non-GAAP measure. Numbers may be off due to rounding.
                                                                                                                                                         36
HEDGING DISCLOSURES
                                                                                                                                                                                                                                 NYSE American: NOG
 Further Detail about Swap Transaction and Swaption Volumes
 1.   The Company has entered into certain crude oil derivative contracts for 2022 and 2023 volumes that give counterparties the option to extend such derivative contracts for additional three month, six-month, and twelve-month
      periods. Options covering a notional volume of 1,010,250 barrels for Q1 2022 at $53.18 per barrel, 1,021,475 barrels for Q2 2022 at $53.18 per barrel, 549,700 barrels for Q3 2022 at $51.67 per barrel, 549,700 barrels for Q4 2022 at
      $51.67 per barrel are exercisable on December 31, 2021. Options covering a notional volume of 1,170,000 barrels for Q1 2023 at $50.67 per barrel, 819,000 barrels for Q2 2023 at $50.00 per barrel, 851,000 barrels for Q3 2023 at
      $50.22 per barrel, 851,000 barrels for Q4 2023 at $50.22 per barrel are exercisable on December 31, 2022. If the counterparties exercise all such options, the notional volume of the Company’s existing crude oil derivative contracts will
      increase by these amounts for those respective periods in 2022 and 2023.

 2.   The Company has entered into certain crude oil derivative basis swap contracts for 2021. Contracts covering a notional volume of 627,990 barrels for Q1 2021 at -$2.338 per barrel, 1,459,640 barrels for Q2 2021 at -$2.188 per barrel,
      1,498,680 barrels for Q3 2021 at -$2.483 per barrel, and 1,498,680 barrels for Q4 2021 at -$2.483 are open.

 3.   The Company has entered into certain natural gas derivative basis swap contracts related to the volumes in the Permian Basin for 2021. Contracts covering a notional volume of 46,000 MMBTU for Q3 2021 at -$0.275 per MMBTU and
      23,000 MMBTU for Q4 2021 at -$0.290 are open.

 4.   The Company has entered into certain natural gas derivative basis swap contracts related to the volumes in the Appalachian Basin for 2021 and 2022. Contracts covering a notional volume of 2,739,507 MMBTU for Q2 2021 at -$0.595
      per MMBTU and 1,330,102 MMBTU for Q3 2021 at -$0.626 and 2,462,714 MMBTU for Q4 2021 at -$0.618 are open. In addition, contracts covering a notional volume of 3,557,290 MMBTU for Q1 2022 at -$0.619 per MMBTU are open.

1. See Appendix for further disclosures.                                                                                                                                                                                                             37
You can also read