For announcement to the ASX - Bell Direct
←
→
Page content transcription
If your browser does not render page correctly, please read the page content below
3 February 2021

For announcement to the ASX

 Amcor (NYSE: AMCR; ASX: AMC) filed the attached Form 8K regarding Half Year 2021 financial results for the six
 months ending 31 December 2020 with the SEC on Tuesday 2 February 2021. A copy of the filing is attached.

 Authorised for release by:

 Damien Clayton
 Company Secretary
                                                                ENDS

 For further information please contact:

 Investors:
 Tracey Whitehead                           Damien Bird
 Global Head of Investor Relations          Vice President Investor Relations
 Amcor                                      Amcor
 +61 3 9226 9028                            +61 3 9226 9070
 tracey.whitehead@amcor.com                 damien.bird@amcor.com

 Media – Europe                             Media – Australia                           Media – North America
 Ernesto Duran                              James Strong                                Daniel Yunger
 Head of Global Communications
 Amcor                                      Citadel-MAGNUS                              KekstCNC
 +41 78 698 69 40                           +61 448 881 174                             +1 212 521 4879
 ernesto.duran@amcor.com                    jstrong@citadelmagnus.com                   daniel.yunger@kekstcnc.com

About Amcor
Amcor is a global leader in developing and producing responsible packaging for food, beverage, pharmaceutical,
medical, home- and personal-care, and other products. Amcor works with leading companies around the world to
protect their products and the people who rely on them, differentiate brands, and improve value chains through a
range of flexible and rigid packaging, specialty cartons, closures, and services. The company is focused on making
packaging that is increasingly light-weighted, recyclable and reusable, and made using a rising amount of recycled
content. Around 47,000 Amcor people generate US$12.5 billion in sales from operations that span about 230
locations in 40-plus countries. NYSE: AMCR; ASX: AMC
www.amcor.com I LinkedIn I Facebook I Twitter I YouTube

 Amcor plc
 Head Office / UK Establishment Address: 83 Tower Road North, Warmley, Bristol, England, BS30 8XP, United Kingdom
 UK Overseas Company Number: BR020803
 Registered Office: 3rd Floor, 44 Esplanade, St Helier, JE4 9WG, Jersey
 Jersey Registered Company Number: 126984 | Australian Registered Body Number (ARBN): 630 385 278
UNITED STATES
                         SECURITIES AND EXCHANGE COMMISSION
                                                         Washington, D.C. 20549

                                                           FORM 8-K

                                                         CURRENT REPORT
                                                    Pursuant to Section 13 or 15(d)
                                                of the Securities Exchange Act of 1934

                                   Date of Report (Date of earliest event reported): February 2, 2021

                                                         AMCOR PLC
                                          (Exact name of registrant as specified in its charter)

                   Jersey                                      001-38932                                    98-1455367
         (State or other jurisdiction                    (Commission File Number)                  (IRS Employer Identification No.)
              of incorporation)

                     83 Tower Road North
                        Warmley, Bristol
                        United Kingdom                                                              BS30 8XP
              (Address of principal executive offices)                                              (Zip Code)

                                                              +44 117 9753200
                                         (Registrant’s telephone number, including area code)

Check the appropriate box below if the Form 8-K filing is intended to simultaneously satisfy the filing obligation of the registrant
under any of the following provisions:

 ☐ Written communications pursuant to Rule 425 under the Securities Act (17 CFR 230.425)
 ☐ Soliciting material pursuant to Rule 14a-12 under the Exchange Act (17 CFR 240.14a-12)
 ☐ Pre-commencement communications pursuant to Rule 14d-2(b) under the Exchange Act (17 CFR 240.14d-2(b))
 ☐ Pre-commencement communications pursuant to Rule 13e-4(c) under the Exchange Act (17 CFR 240.13e-4(c))

Securities registered pursuant to Section 12(b) of the Act:

               Title of each class                            Trading symbol(s)          Name of each exchange on which registered
   Ordinary Shares, par value $0.01 per share                      AMCR                            The New York Stock Exchange
  1.125% Guaranteed Senior Notes Due 2027                         AUKF/27                          The New York Stock Exchange

Indicate by check mark whether the registrant is an emerging growth company as defined in Rule 405 of the Securities Act of 1933
(§230.405 of this chapter) or Rule 12b-2 of the Securities Exchange Act of 1934 (§240.12b-2 of this chapter).
 ☐ Emerging growth company

If an emerging growth company, indicate by check mark if the registrant has elected not to use the extended transition period for
complying with any new or revised financial accounting standards provided pursuant to Section 13(a) of the Exchange Act. ☐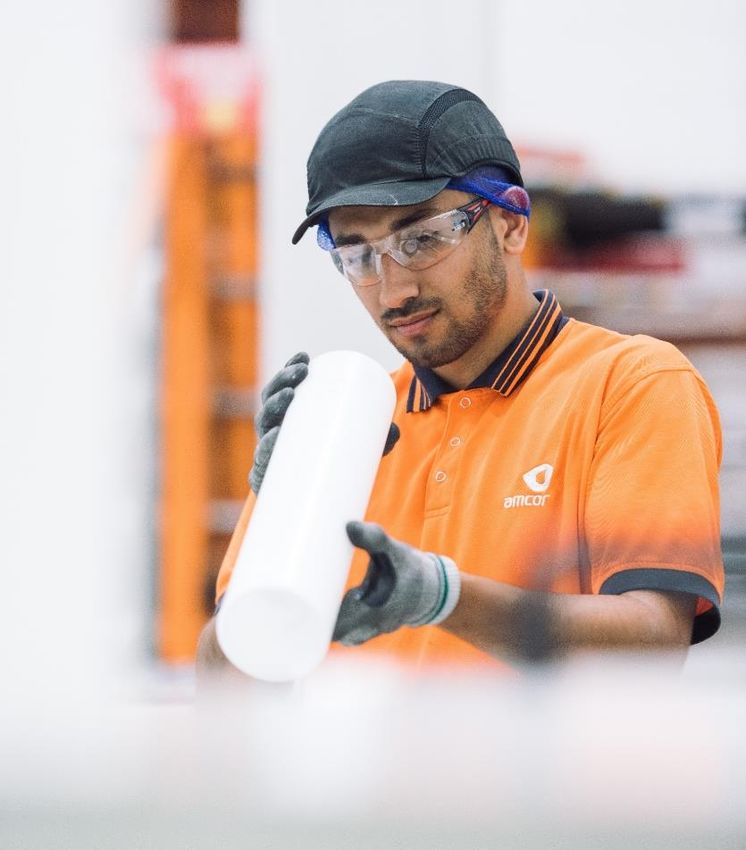
Item 2.02. Results of Operations and Financial Condition.

           On February 2, 2021, Amcor plc (the “Company”) issued a press release regarding financial results for the first half of fiscal
year 2021. The press release is furnished as Exhibit 99.1 hereto. The Company is also furnishing an investor presentation relating to its
first half of fiscal year 2021 (the “Presentation”), which will be used by management for presentations to investors and others. A copy
of the Presentation is attached hereto as Exhibit 99.2 and incorporated into this Item 2.02 by reference. The Presentation is also
available on the Company’s website at https://www.amcor.com/investors. The Company is not including the information contained on
its website as part of, or incorporating it by reference into, this Current Report on Form 8-K.

        The information in this Current Report on Form 8-K shall not be deemed “filed” for purposes of Section 18 of the Securities
Exchange Act of 1934, as amended (the “Exchange Act”), or incorporated by reference in any filing under the Securities Act of 1933,
as amended (the “Securities Act”), or the Exchange Act, except as shall be expressly set forth by specific reference in such a filing.

Item 8.01 Other Events

         On February 2, 2021, the Board of the Directors of the Company approved a $200 million repurchase of the Company’s
ordinary shares and of the Company’s CDIs over the next twelve months. Pursuant to this program, purchases of the Company’s
ordinary shares and CDIs will be made subject to market conditions and at prevailing market prices, through open market purchases.
The Company expects to complete the share buyback over the next twelve months; however, the timing, volume and nature of
repurchases may be amended, suspended or discontinued at any time.

Item 9.01. Financial Statements and Exhibits.

                                                             Exhibit Index
      Exhibit No.                                                         Description
          99.1           First Half of Fiscal Year 2021, Earnings Press Release
          99.2           First Half Fiscal Year 2021, Earnings Investor Presentation
                         Cover Page Interactive Data File. The cover page XBRL tags are embedded within the inline XBRL
          104            document (contained in Exhibit 101)
Cautionary Statement Regarding Forward-Looking Statements

This Current Report on Form 8-K (including the Exhibits hereto) contains certain statements that are “forward-looking statements”
within the meaning of Section 27A of the Securities Act and Section 21E of the Exchange Act. The Company has identified some of
these forward-looking statements with words like “believe,” “may,” “could,” “would,” “might,” “possible,” “will,” “should,”
“expect,” “intend,” “plan,” “anticipate,” “estimate,” “potential,” “outlook” or “continue,” the negative of these words, other terms of
similar meaning or the use of future dates. Such statements are based on the current expectations of the management of the Company,
and are qualified by the inherent risks and uncertainties surrounding future expectations generally. Actual results could differ
materially from those currently anticipated due to a number of risks and uncertainties. None of the Company or any of its respective
directors, executive officers or advisors, provide any representation, assurance or guarantee that the occurrence of the events expressed
or implied in any forward-looking statements will actually occur. Risks and uncertainties that could cause results to differ from
expectations include, but are not limited to, those discussed in the Company’s disclosures described under Part I, "Item 1A - Risk
Factors" in the Company’s Annual Report on Form 10-K for the fiscal year ended June 30, 2020. Forward looking statements
included herein are made only as of the date hereof and the Company does not undertake any obligation to update any forward-looking
statements, or any other information in this Current Report on Form 8-K, as a result of new information, future developments or
otherwise, or to correct any inaccuracies or omissions in them which become apparent. All forward-looking statements in this Current
Report on Form 8-K are qualified in their entirety by this cautionary statement.

SIGNATURES

         Pursuant to the requirements of the Securities Exchange Act of 1934, as amended, the registrant has duly caused this report to
be signed on its behalf by the undersigned hereunto duly authorized.

                                                  AMCOR PLC

Date      February 2, 2021                        /s/ Damien Clayton
                                                  Name:              Damien Clayton
                                                  Title:             Company Secretary
February 2, 2021, US; February 3 2021, Australia

Amcor reports first half results and raises outlook for fiscal 2021
Highlights - Six Months Ended December 31, 2020
•      GAAP Net Income of $417 million, up 65%; GAAP earnings per share (EPS) of 26.5 cents per share, up 71%;
•      Adjusted EPS of 33.3 cents per share, up 16% in constant currency terms;
•      Adjusted EBIT of $743 million, up 8% in constant currency terms;
•      $35 million Bemis cost synergies in H1; expect approximately $70 million (previously $50-$70 million) in FY21;
•      A further $200 million of share repurchases approved bringing the total announced in fiscal 2021 to $350 million;
•      Quarterly dividend higher than last year at 11.75 cents per share; and
•      Fiscal 2021 outlook for adjusted EPS growth raised to 10-14% in constant currency terms (previously 7-12%).

          Strong First Half and Increased Guidance and Shareholder Returns for Fiscal 2021
Amcor’s CEO Ron Delia said: “Amcor delivered strong financial results ahead of our expectations for the first
half and we have raised the outlook for the full year as our teams continue to demonstrate resilience and
outstanding execution."

"Sales growth of 3% was balanced across our businesses and regions, cost performance has been strong
and synergies from the Bemis acquisition are running ahead of schedule. We have built momentum in both
operating segments resulting in Adjusted EBIT growth of 9% in Flexibles and 10% in Rigid Packaging in
constant currency terms. That momentum translates into higher expectations for the full year with Adjusted
EPS growth now forecast at 10-14% in constant currency terms as well as an increased dividend and
additional share repurchases.”

“Amcor’s investment case remains as strong as ever. We are well positioned to continue generating growth
from attractive consumer and healthcare end markets, our leadership and scale in emerging markets and our
extensive innovation capabilities. With annual free cash flow of more than $1 billion, we have substantial
capacity to create value for shareholders by reinvesting in the business, pursuing acquisitions, and returning
capital through a compelling and growing dividend and share repurchases.”
.
Key Financials(1)
                                                                                                                                          Half Year Ended December 31,
    GAAP results                                                                                                                         2019 $ million    2020 $ million
    Net sales                                                                                                                                    6,184             6,200
    Net income                                                                                                                                      252              417
    EPS (diluted US cents)                                                                                                                         15.5             26.5

                                                                              Half Year Ended December 31,                                                               Constant
                                                                                                                                         Reported ∆%                    Currency ∆%
    Adjusted non-GAAP results                                                2019 $ million    2020 $ million
    Net sales(2)                                                                      6,184            6,200                                               —%                              3%
    EBITDA                                                                              911               948                                               4%                             5%
    EBIT                                                                                699               743                                               6%                             8%
    Net income                                                                          473               522                                              10 %                           12 %
    EPS (diluted US cents)                                                             29.2              33.3                                              14 %                           16 %
    Free cash flow                                                                      310               276                                             (11)%
(1) Adjusted non-GAAP results exclude items which management considers as not representative of ongoing operations. Further details related to non-GAAP measures and reconciliations to
GAAP measures can be found under "Presentation of non-GAAP financial information” and in the tables included in this release.
(2) Constant Currency ∆% for Net sales excludes 2% unfavorable impact from the pass through of lower raw material costs.
Note: All amounts referenced throughout this document are in US dollars unless otherwise indicated and numbers may not add up precisely to the totals provided due to rounding.

                                                                                                                                                                                          1
Bemis cost synergies
The Bemis business was acquired through an all-stock transaction in June 2019.
Amcor has continued to execute well against overhead, procurement and footprint initiatives and delivered
approximately $35 million (pre-tax) of incremental cost synergies during the first half. Of this amount, approximately
$30 million was recognized in the Flexibles segment and $5 million in Other.
As a result of this strong progress, Amcor expects to deliver incremental cost synergy benefits of approximately $70
million (pre-tax) in fiscal 2021 (previously $50 to $70 million (pre-tax)). Combined with the $80 million delivered in
fiscal 2020, this will result in cumulative cost synergies of $150 million (pre-tax) by the end of fiscal 2021 and leaves
the business well positioned to deliver total cost synergies of $180 million by the end of fiscal 2022.

Shareholder returns
Dividend
The Amcor Board of Directors today declared a quarterly cash dividend of 11.75 cents per share (compared with 11.5
cents per share in the same quarter last year). The dividend will be paid in US dollars to holders of Amcor’s ordinary
shares trading on the NYSE. Holders of CDIs trading on the ASX will receive an unfranked dividend of 15.21
Australian cents per share, which reflects the quarterly dividend of 11.75 cents per share converted at an AUD:USD
average exchange rate of 0.7724 over the five trading days ended January 28, 2021.
The ex-dividend date will be February 23, 2021, the record date will be February 24, 2021 and the payment date will
be March 16, 2021.

Share repurchases
Amcor is committed to an investment grade credit rating, maintains strong credit metrics and generates significant
annual free cash flow. This provides substantial capacity to simultaneously reinvest in the business, pursue
acquisitions and return cash to shareholders through a compelling and growing dividend as well as share
repurchases.
The Amcor Board of Directors has approved the repurchase of a further $200 million of ordinary shares and CDIs,
bringing the total approved in fiscal 2021 to $350 million.
During the first half of fiscal 2021, Amcor repurchased 6.5 million shares, resulting in a 0.4% reduction in the total
number of shares issued and outstanding.

Financial results - Half Year ended December 31, 2020
Segment information

                                                    Half Year Ended December 31, 2019                                           Half Year Ended December 31, 2020
                                                                                        EBIT / Average                                                              EBIT / Average
Adjusted non-GAAP                    Net sales          EBIT           EBIT /          funds employed            Net sales          EBIT           EBIT /          funds employed
results(1)                           $ million        $ million       Sales %                %(2)                $ million        $ million       Sales %                %(2)
Flexibles                                 4,846             602            12.4 %                                     4,850             653            13.5 %
Rigid Packaging                           1,340             127              9.5 %                                    1,352             134              9.9 %
Other                                         (2)            (30)                                                         (2)            (45)
Total Amcor                               6,184             699            11.3 %                      13.8 %         6,200             743            12.0 %                      14.6 %
(1) Adjusted non-GAAP measures exclude items which management considers as not representative of ongoing operations. Further details related to non-GAAP measures and reconciliations to
GAAP measures can be found under "Presentation of non-GAAP financial information” and in the tables included in this release.
(2) Average funds employed includes shareholders equity and net debt, calculated using a four quarter average and LTM adjusted EBIT.

First half net sales for the Amcor Group of $6,200 million were 3% higher than the same period last year excluding a
combined unfavorable impact of currency and the pass through of lower raw material costs. Overall volumes were 3%
higher than the prior period and price/mix had no material impact on net sales.

                                                                                                                                                                                      2
Flexibles                                                                            Half Year Ended December 31,                                   Constant
                                                                                    2019 $ million   2020 $ million                  Reported ∆%   Currency ∆%
Net sales(1)                                                                                     4,846                       4,850           —%              1%
Adjusted EBIT                                                                                       602                       653            8%              9%
Adjusted EBIT / Sales %                                                                            12.4                       13.5
(1) Constant Currency ∆% for Net sales excludes a 1% unfavorable impact from the pass through of lower raw material costs.

Overall first half segment volumes were 2% higher than the same period last year. All geographic regions delivered
volume growth and by end market, growth in food, pet food and beverage was partially offset by lower volumes in
certain healthcare end markets driven by reduced elective surgery rates and lower prescription trends.
Volume growth and a 1% unfavorable impact from price/mix resulted in overall sales being 1% higher than the prior
period excluding a net unfavorable impact of currency and the pass through of lower raw material costs.
In North America, volumes grew in the mid single digit range, mainly driven by strength in the meat, frozen food, liquid
beverage, pet food and home and personal care end markets as well as specialty folding cartons. This was partly
offset by lower healthcare volumes. In Europe, growth strengthened through the half year and overall low single digit
volume growth was driven by higher volumes in cheese, snacks, coffee, pet food and ready meal end markets partly
offset by lower confectionary, yogurt and healthcare volumes.
Flexible packaging volumes grew at mid single digit rates across the Asian emerging markets, with mid single digit and
double digit growth in China and India respectively, partly offset by lower volumes in South East Asia. In Latin America
overall volumes grew in the low single digit range compared with the prior period.
Adjusted EBIT for the first half of $653 million was 9% higher than the prior period in constant currency terms. This
includes organic growth of 4%, primarily reflecting higher volumes and strong cost and operating performance across
the business. The remaining 5% earnings growth reflects $30 million of synergy benefits related to the Bemis
acquisition.
Adjusted EBIT margin of 13.5% compares with 12.4% for the prior period.

Rigid Packaging                                                                      Half Year Ended December 31,                                   Constant
                                                                                    2019 $ million    2020 $ million                 Reported ∆%   Currency ∆%
Net sales(1)                                                                                      1,340                      1,352            1%            10 %
Adjusted EBIT                                                                                        127                       134            6%            10 %
Adjusted EBIT / Sales %                                                                               9.5                      9.9
(1) Constant Currency ∆% for Net sales excludes a 7% unfavorable impact from the pass through of lower raw material costs.

Overall first half segment volumes were 6% higher than the same period last year, with volume growth in North
America partially offset by marginally lower volumes in Latin America.
Price/mix had a 4% favorable impact and includes pricing to recover cost inflation in Latin America. Overall sales
were therefore 10% higher than the prior period excluding the unfavorable impacts of currency and the pass through
of lower raw material costs.
In North America, beverage volumes were 9% higher than the prior period with hot fill container volumes up 19%.
There has been strong consumer demand across all beverage segments, particularly in hot fill juices as well as hot fill
sports drinks where Amcor also benefited from favorable customer mix. Strong consumer demand reflects higher at
home consumption of packaged beverages supported by higher retail sales in multi-pack formats across a range of
segments. Growth was also driven by several launches of brand extensions and new health and wellness oriented
products in PET containers. Specialty container volumes were also higher than the prior period with continuing growth
in certain categories including spirits, personal care and home cleaning.
In Latin America, volumes were marginally lower than the prior period. Month to month volumes remain variable,
however trends generally strengthened through the half year. Volumes were higher in Brazil, Central America and
Argentina, offset by lower volumes across the rest of the region.
Adjusted EBIT for the first half of $134 million was 10% higher than the prior period in constant currency terms,
reflecting positive mix across the business and higher volumes in North America partly offset by increased labor and
transportation costs to service higher demand and lower volumes in Latin America.

                                                                                                                                                                 3
Other Half Year Ended December 31,
Adjusted EBIT 2019 $ million 2020 $ million
AMVIG (equity accounted investment, net of tax) (1) 5 3
Corporate expenses (35) (48)
Total Other (30) (45)
(1) As announced on 24 September 2020, Amcor sold its investment in AMVIG. As a result no further earnings will be recognized in relation to this investment.
Net interest and income tax expense
First half net interest expense was $70 million compared with $99 million in the same period last year, with the
decrease primarily driven by lower interest rates on floating rate debt. Offsetting this, first half tax expense (adjusted
to exclude amounts related to non-GAAP adjustments) was $145 million compared with $123 million in the same
period last year. Adjusted tax expense represents an effective tax rate of 21.5% in the current period.
Cash flow
First half adjusted free cash flow was $276 million. Excluding an unfavorable impact of approximately $50 million
related to timing of cash tax payments in the US which were deferred from the fourth quarter of fiscal 2020, free cash
flow was higher than the same period last year.
Balance sheet
Net debt was $5,730 million at 31 December 2020. Leverage, measured as net debt divided by adjusted trailing
twelve month EBITDA, was 2.9 times, in line with Amcor's expectations.
Fiscal 2021 guidance
For the twelve month period ending 30 June 2021, the Company expects:
• Adjusted constant currency EPS growth of approximately 10 to 14% (previously 7 to 12%), compared with
adjusted EPS of 64.2 US cents per share in fiscal 2020.
◦ This includes pre-tax synergy benefits associated with the Bemis acquisition of approximately $70
million (previously $50 to $70 million).
◦ Assuming current exchange rates prevail for the remainder of the year, it is estimated that currency
would have no material impact on reported EPS.
• Adjusted free cash flow of approximately $1.0 to $1.1 billion.
Amcor’s guidance contemplates a range of factors, including the COVID-19 pandemic which creates a higher degree
of uncertainty and additional complexity when estimating future financial results. Amcor's business has demonstrated
resilience given that it plays an important role in the supply of essential consumer goods. While this is expected to
continue, the level of earnings and free cash flow generated across the business could be impacted by COVID-19
related factors such as the extent and nature of any future operational disruptions across the supply chain,
government imposed restrictions on consumer mobility and the pace of macroeconomic recovery in key global
economies. The ultimate magnitude and duration of the pandemic’s future impact on the business remains uncertain
at this time.
Conference Call
Amcor is hosting a conference call with investors and analysts to discuss these results on Tuesday February 2, 2021
at 5:30pm US Eastern Standard Time / Wednesday February 3, 9.30am Australian Eastern Daylight Time. Investors
are invited to listen to a live webcast of the conference call at our website, www.amcor.com, in the “Investors” section.
Those wishing to access the call should use the following toll-free numbers, with the Conference ID 8641389:
• US & Canada – 866 211 4133
• Australia – 1800 287 011
• United Kingdom – 0800 051 7107
• Singapore – 800 852 6506
• Hong Kong – 800 901 563
From all other countries, the call can be accessed by dialing +1 647 689 6614 (toll).
4A replay of the webcast will also be available in the Investors section on www.amcor.com following the call.
About Amcor
Amcor is a global leader in developing and producing responsible packaging for food, beverage, pharmaceutical,
medical, home and personal-care, and other products. Amcor works with leading companies around the world to
protect their products and the people who rely on them, differentiate brands, and improve supply chains through a
range of flexible and rigid packaging, specialty cartons, closures, and services. The company is focused on making
packaging that uses less materials, is increasingly recyclable and reusable, and is made with more recycled content.
Around 47,000 Amcor people generate $12.5 billion in annual sales from operations that span about 230 locations in
40-plus countries. NYSE: AMCR; ASX: AMC
www.amcor.com I LinkedIn I Facebook I Twitter I YouTube
Contact Information
Investors
Tracey Whitehead Damien Bird
Global Head of Investor Relations Vice President Investor Relations
Amcor Amcor
+61 3 9226 9028 +61 3 9226 9070
tracey.whitehead@amcor.com damien.bird@amcor.com
Media - Australia Media - Europe Media - North America
James Strong Ernesto Duran Daniel Yunger
Head of Global Communications
Citadel-MAGNUS Amcor Kekst CNC
+61 448 881 174 +41 78 698 69 40 +1 212 521 4879
jstrong@citadelmagnus.com ernesto.duran@amcor.com daniel.yunger@kekstcnc.com
Amcor plc UK Establishment Address: 83 Tower Road North, Warmley, Bristol, England, BS30 8XP, United Kingdom
UK Overseas Company Number: BR020803
Registered Office: 3rd Floor, 44 Esplanade, St Helier, JE4 9WG, Jersey
Jersey Registered Company Number: 126984, Australian Registered Body Number (ARBN): 630 385 278
5Cautionary Statement Regarding Forward-Looking Statements
This document contains certain statements that are “forward-looking statements” within the meaning of the safe harbor provisions of the U.S.
Private Securities Litigation Reform Act of 1995. Forward-looking statements are generally identified with words like “believe,” “expect,”, “target,”
“project,” “may,” “could,” “would,” “approximately,” “possible,” “will,” “should,” “expect,” “intend,” “plan,” “anticipate,” “estimate,” “potential,” “outlook,”
or “continue,” the negative of these words, other terms of similar meaning or the use of future dates. Such statements are based on the current
expectations of the management of Amcor and are qualified by the inherent risks and uncertainties surrounding future expectations generally. Actual
results could differ materially from those currently anticipated due to a number of risks and uncertainties. None of Amcor or any of its respective
directors, executive officers or advisors provide any representation, assurance or guarantee that the occurrence of the events expressed or implied
in any forward-looking statements will actually occur. Risks and uncertainties that could cause actual results to differ from expectations include, but
are not limited to: the continued financial and operational impacts of the COVID-19 pandemic on Amcor and its customers, suppliers, employees
and the geographic markets in which it and its customers operate; fluctuations in consumer demand patterns; the loss of key customers or a
reduction in production requirements of key customers; significant competition in the industries and regions in which Amcor operates; failure to
realize the anticipated benefits of the acquisition of Bemis Company, Inc. (“Bemis”), and the cost synergies related thereto; failure to successfully
integrate Bemis’ business and operations in the expected time frame or at all; integration costs related to the acquisition of Bemis; failure by Amcor
to expand its business; the potential loss of intellectual property rights; various risks that could affect our business operations and financial results
due to our international operations; price fluctuations or shortages in the availability of raw materials, energy and other inputs; disruptions to
production, supply and commercial risks, including counterparty credit risks, which may be exacerbated in times of economic downturn; the
possibility of labor disputes; fluctuations in our credit ratings; disruptions to the financial or capital markets; and other risks and uncertainties
identified from time to time in Amcor’s filings with the U.S. Securities and Exchange Commission (the “SEC”), including without limitation, those
described under Item 1A. “Risk Factors” of Amcor’s annual report on Form 10-K for the fiscal year ended June 30, 2020 and any subsequent
quarterly reports on Form 10-Q. You can obtain copies of Amcor’s filings with the SEC for free at the SEC’s website (www.sec.gov). Forward-looking
statements included herein are made only as of the date hereof and Amcor does not undertake any obligation to update any forward-looking
statements, or any other information in this communication, as a result of new information, future developments or otherwise, or to correct any
inaccuracies or omissions in them which become apparent, except as expressly required by law. All forward-looking statements in this
communication are qualified in their entirety by this cautionary statement.
Presentation of non-GAAP financial information
Included in this release are measures of financial performance that are not calculated in accordance with U.S. GAAP. These measures include
adjusted EBIT (calculated as earnings before interest and tax), adjusted net income, adjusted earnings per share, adjusted free cash flow, and net
debt. In arriving at these non-GAAP measures, we exclude items that either have a non-recurring impact on the income statement or which, in the
judgment of our management, are items that, either as a result of their nature or size, could, were they not singled out, potentially cause investors to
extrapolate future performance from an improper base. While not all inclusive, examples of these items include:
• material restructuring programs, including associated costs such as employee severance, pension and related benefits, impairment of
property and equipment and other assets, accelerated depreciation, termination payments for contracts and leases, contractual
obligations and any other qualifying costs related to the restructuring plan;
• earnings from discontinued operations and any associated profit or loss on sale of businesses or subsidiaries;
• consummated and identifiable divestitures agreed to with certain regulatory agencies as a condition of approval for Amcor’s acquisition of
Bemis;
• impairments in goodwill and equity method investments;
• material acquisition compensation and transaction costs such as due diligence expenses, professional and legal fees and integration
costs;
• material purchase accounting adjustments for inventory;
• amortization of acquired intangible assets from business combinations;
• payments or settlements related to legal claims; and
• impacts from hyperinflation accounting
Management has used and uses these measures internally for planning, forecasting and evaluating the performance of the company’s reporting
segments and certain of the measures are used as a component of Amcor’s board of directors’ measurement of Amcor’s performance for incentive
compensation purposes. Amcor also evaluates performance on a constant currency basis, which measures financial results assuming constant
foreign currency exchange rates used for translation based on the rates in effect for the comparable prior-year period. In order to compute constant
currency results, we multiply or divide, as appropriate, current-year U.S. dollar results by the current-year average foreign exchange rates and then
multiply or divide, as appropriate, those amounts by the prior-year average foreign exchange rates. Constant currency net sales performance also
excludes the impact from passing through movements in raw material costs. Amcor believes that these non-GAAP measures are useful to enable
investors to perform comparisons of current and historical performance of the company. For each of these non-GAAP financial measures, a
reconciliation to the most directly comparable U.S. GAAP financial measure has been provided herein. These non-GAAP financial measures should
not be construed as an alternative to results determined in accordance with U.S. GAAP. The company provides guidance on a non-GAAP basis as
we are unable to predict with reasonable certainty the ultimate outcome and timing of certain significant forward-looking items without unreasonable
effort. These items include but are not limited to the impact of foreign exchange translation, restructuring program costs, asset impairments,
possible gains and losses on the sale of assets and certain tax related events. These items are uncertain, depend on various factors and could
have a material impact on U.S. GAAP earnings and cash flow measures for the guidance period.
Dividends
Amcor has received a waiver from the ASX’s settlement operating rules, which will allow the Company to defer processing conversions between its
ordinary share and CDI registers from February 23, 2021 to February 24, 2021 inclusive.
6U.S. GAAP Condensed Consolidated Statement of Income (Unaudited)
Three Months Ended December 31, Half Year Ended December 31,
($ million) 2019 2020 2019 2020
Net sales 3,043 3,103 6,184 6,200
Cost of sales (2,426) (2,452) (5,020) (4,895)
Gross profit 617 651 1,164 1,305
Selling, general and administrative expenses (309) (308) (680) (637)
Research and development expenses (23) (23) (49) (49)
Restructuring and related expenses (24) (23) (42) (46)
Other income, net 11 10 20 10
Operating income 272 307 413 583
Interest expense, net (46) (33) (99) (70)
Other non-operating income (loss), net 4 3 12 6
Income from continuing operations before income taxes and
equity in income (loss) of affiliated companies 230 277 326 519
Income tax expense (45) (55) (67) (116)
Equity in income (loss) of affiliated companies, net of tax 3 — 5 19
Income from continuing operations 188 222 264 422
Income (loss) from discontinued operations, net of tax(1) — — (8) —
Net income 188 222 256 422
Net (income) loss attributable to non-controlling interests (2) (3) (4) (5)
Net income attributable to Amcor plc 186 219 252 417
USD:EUR FX rate 0.8991 0.8558 0.9013 0.8473
Basic earnings per share attributable to Amcor 0.115 0.140 0.155 0.267
Diluted earnings per share attributable to Amcor 0.115 0.139 0.155 0.265
Weighted average number of shares outstanding – Basic 1,613 1,560 1,618 1,560
Weighted average number of shares outstanding - Diluted 1,615 1,570 1,620 1,568
(1) Represents income/(loss) generated from three former Bemis plants located in the United Kingdom and Ireland from July 1, 2019 to August 8, 2019. Amcor announced the disposal of these
assets to Kohlberg & Company on June 25, 2019. This divestment was required by the European Commission at the time of approving Amcor’s acquisition of Bemis on February 11, 2019.
7U.S. GAAP Condensed Consolidated Statement of Cash Flows (Unaudited)
Half Year Ended December 31,
($ million) 2019 2020
Net income 256 422
Depreciation, amortization and impairment 332 287
Changes in operating assets and liabilities (192) (253)
Other non-cash items (54) (14)
Net cash provided from operating activities 342 442
Purchase of property, plant and equipment and other intangible assets (207) (218)
Proceeds from sale of property, plant and equipment and other intangible assets 3 4
Proceeds from divestiture 397 138
Net debt (repayments) proceeds 178 40
Dividends paid (391) (374)
Share buy-back (223) (75)
Other, including effects of exchange rate on cash and cash equivalents (27) 55
Net increase in cash and cash equivalents 72 12
Cash and cash equivalents at the beginning of the period 602 743
Cash and cash equivalents at the end of the period 674 755
U.S. GAAP Condensed Consolidated Balance Sheet (Unaudited)
($ million) June 30, 2020 December 31, 2020
Cash and cash equivalents 743 755
Trade receivables, net 1,616 1,681
Inventories, net 1,832 1,843
Property, plant and equipment, net 3,615 3,767
Goodwill and other intangible assets, net 7,333 7,357
Other assets 1,303 1,315
Total assets 16,442 16,718
Trade payables 2,171 2,093
Short-term debt and current portion of long-term debt 206 53
Long-term debt, less current portion 6,028 6,432
Accruals and other liabilities 3,350 3,292
Shareholders equity 4,687 4,848
Total liabilities and shareholders equity 16,442 16,718
8Reconciliation of Non-GAAP Measures
Reconciliation of adjusted Earnings before interest, tax, depreciation and amortization (EBITDA), Earnings before interest
and tax (EBIT), Net income and Earnings per share (EPS)
Half Year Ended December 31, 2019 Half Year Ended December 31, 2020
EPS EPS
(Diluted (Diluted
Net US Net US
($ million) EBITDA EBIT Income cents) EBITDA EBIT Income cents)
Net income attributable to Amcor 252 252 252 15.5 417 417 417 26.5
Net income attributable to non-controlling interests 4 4 5 5
(Income) loss from discontinued operations 8 8 8 0.5 — —
Tax expense 67 67 116 116
Interest expense, net 99 99 70 70
Depreciation and amortization 321 287
EBITDA, EBIT, Net income and EPS 751 430 260 16.0 895 608 417 26.5
Material restructuring and related costs 41 41 41 2.5 39 39 39 2.5
Net gain on disposals(1) — — — — (9) (9) (9) (0.6)
Material transaction and other costs(2) 101 101 101 6.3 13 13 13 0.8
Material impact of hyperinflation 18 18 18 1.1 11 11 11 0.7
Amortization of acquired intangibles(3) 109 109 6.8 82 82 5.2
Tax effect of above items (56) (3.5) (29) (1.8)
Adjusted EBITDA, EBIT, Net income and EPS 911 699 473 29.2 948 743 522 33.3
(1) Includes $15 million gain realised upon disposal of AMVIG and losses on disposal of other non-core businesses.
(2) Includes costs associated with the Bemis acquisition. The half year ended December 31, 2019 includes $58 million of acquisition related inventory fair value step-up costs.
(3) The half year ended December 31, 2019 includes $26 million of sales backlog amortization related to the Bemis acquisition.
9Reconciliation of adjusted EBIT by reporting segment
Half Year Ended December 31, 2019 Half Year Ended December 31, 2020
Rigid Rigid
($ million) Flexibles Packaging Other(1) Total Flexibles Packaging Other(1) Total
Net income attributable to Amcor 252 417
Net income attributable to non-
controlling interests 4 5
(Income) loss from discontinued
operations 8 —
Tax expense 67 116
Interest expense, net 99 70
EBIT 392 98 (60) 430 534 110 (36) 608
Material restructuring and related
costs 32 6 3 41 27 10 2 39
Net gain on disposals (2)
— — — — 6 — (15) (9)
Material transaction and other
costs(3) 72 2 27 101 7 1 5 13
Material impact of hyperinflation — 18 — 18 — 11 — 11
Amortization of acquired
intangibles(4) 106 3 — 109 79 3 — 82
Adjusted EBIT(5) 602 127 (30) 699 653 134 (45) 743
Adjusted EBIT / sales % 12.4 % 9.5 % 11.3 % 13.5 % 9.9 % 12.0 %
(1) Other includes equity in income (loss) of affiliated companies, net of tax and general corporate expenses.
(2) Includes $15 million gain realised upon disposal of AMVIG and losses on disposal of other non-core businesses.
(3) Includes costs associated with the Bemis acquisition. The half year ended December 31, 2019 includes $58 million of acquisition related inventory fair value step-up costs.
(4) The half year ended December 31, 2019 includes $26 million of sales backlog amortization related to the Bemis acquisition.
(5) During the first quarter of fiscal 2021, the Company reported that it revised the presentation of the reportable segments Adjusted EBIT to include an allocation of certain research and
development and selling, general and administrative expenses that management previously reflected in Other. Prior periods have been recast to conform to the new cost allocation methodology.
Reconciliations of adjusted free cash flow
Half Year Ended December 31,
($ million) 2019 2020
Net cash provided from operating activities 342 442
Purchase of property, plant and equipment and other intangible assets (207) (218)
Proceeds from sale of property, plant and equipment and other intangible assets 3 4
Operating cash flow related to divested operations 60 —
(1)
Material transaction and integration related costs 112 48
Adjusted free cash flow(2) 310 276
(1) The half year ended December 31, 2020 and 2019 includes cash restructuring and integration costs of approximately $31 million and $45 million respectively.
(2) Adjusted free cash flow excludes material transaction related costs because these cash flows are not considered to be directly related to the underlying business.
Half Year Ended December 31,
($ million) 2019 2020
Adjusted EBITDA 911 948
Interest paid, net (92) (65)
Income tax paid(2) (89) (168)
Purchase of property, plant and equipment and other intangible assets (207) (218)
Proceeds from sale of property, plant and equipment and other intangible assets 3 4
Movement in working capital (195) (209)
Other (21) (16)
Adjusted free cash flow(1) 310 276
(1) Adjusted free cash flow excludes material transaction related costs because these cash flows are not considered to be directly related to the underlying business.
(2) The half year ended December 31, 2019 excludes tax cash paid of $95 million related to disposal proceeds from divestments which were required by the European Commission and the U.S.
Department of Justice at the time of approving Amcor’s acquisition of Bemis.
10Reconciliation of net debt
($ million) June 30, 2020 December 31, 2020
Cash and cash equivalents (743) (755)
Short-term debt 195 40
Current portion of long-term debt 11 13
Long-term debt excluding current portion of long-term debt 6,028 6,432
Net debt 5,492 5,730
112021 Half Year Results
Ron Delia
CEO
Michael Casamento
CFO
February 2, 2021 US
February 3, 2021 Australia
NYSE: AMCR | ASX: AMCDisclaimers
Cautionary Statement Regarding Forward-Looking Statements
This document contains certain statements that are “forward-looking statements” within the meaning of the safe harbor provisions of the U.S. Private Securities Litigation Reform Act of 1995. Forward-looking statements are generally identified with
words like “believe,” “expect,” “target,” “project,” “may,” “could,” “would,” “approximately,” “possible,” “will,” “should,” “expect,” “intend,” “plan,” “anticipate,” “estimate,” “potential,” “outlook” or “continue,” the negative of these words, other terms of similar
meaning or the use of future dates. Such statements are based on the current expectations of the management of Amcor and are qualified by the inherent risks and uncertainties surrounding future expectations generally. Actual results could differ
materially from those currently anticipated due to a number of risks and uncertainties. None of Amcor or any of its respective directors, executive officers or advisors provide any representation, assurance or guarantee that the occurrence of the
events expressed or implied in any forward-looking statements will actually occur. Risks and uncertainties that could cause actual results to differ from expectations include, but are not limited to: the continued financial and operational impacts of the
COVID-19 pandemic on Amcor and its customers, suppliers, employees and the geographic markets in which it and its customers operate; fluctuations in consumer demand patterns; the loss of key customers or a reduction in production
requirements of key customers; significant competition in the industries and regions in which Amcor operates; failure to real ize the anticipated benefits of the acquisition of Bemis Company, Inc. (“Bemis”), and the cost synergies related thereto; failure
to successfully integrate Bemis’ business and operations in the expected time frame or at all; integration costs related to the acquisition of Bemis; failure by Amcor to expand its business; the potential loss of intellectual property rights; various risks
that could affect our business operations and financial results due to our international operations; price fluctuations or shortages in the availability of raw materials, energy and other inputs; disruptions to production, supply and commercial risks,
including counterparty credit risks, which may be exacerbated in times of economic downturn; the possibility of labor disputes; fluctuations in our credit ratings; disruptions to the financial or capital markets; and other risks and uncertainties identi fied
from time to time in Amcor’s filings with the U.S. Securities and Exchange Commission (the “SEC”), including without limitation, those described under Item 1A. “Risk Factors” of Amcor’s annual report on Form 10-K for the fiscal year ended June 30,
2020 and any subsequent quarterly reports on Form 10-Q. You can obtain copies of Amcor’s filings with the SEC for free at the SEC’s website (www.sec.gov). Forward-looking statements included herein are made only as of the date hereof and
Amcor does not undertake any obligation to update any forward-looking statements, or any other information in this communication, as a result of new information, future developments or otherwise, or to correct any inaccuracies or omissions in them
which become apparent, except as expressly required by law. All forward-looking statements in this communication are qualified in their entirety by this cautionary statement.
Presentation of non-GAAP financial information
Included in this release are measures of financial performance that are not calculated in accordance with U.S. GAAP. These measures include adjusted EBIT (calculated as earnings before interest and tax), adjusted net income, adjusted earnings
per share, adjusted free cash flow, net debt and the Supplemental Unaudited Combined Financial Information including adjusted earnings before interest, tax, amortization and depreciation, adjusted earnings before interest and tax, and adjusted
earnings per share and any ratios related thereto. In arriving at these non-GAAP measures, we exclude items that either have a non-recurring impact on the income statement or which, in the judgment of our management, are items that, either as a
result of their nature or size, could, were they not singled out, potentially cause investors to extrapolate future performance from an improper base. While not all inclusive, examples of these items include:
• material restructuring programs, including associated costs such as employee severance, pension and related benefits, impairment of property and equipment and other assets, accelerated depreciation, termination payments for
contracts and leases, contractual obligations and any other qualifying costs related to the restructuring plan;
• earnings from discontinued operations and any associated profit or loss on sale of businesses or subsidiaries;
• consummated and identifiable divestitures agreed to with certain regulatory agencies as a condition of approval for Amcor’s acquisition of Bemis;
• impairments in goodwill and equity method investments;
• material acquisition compensation and transaction costs such as due diligence expenses, professional and legal fees and integration costs;
• material purchase accounting adjustments for inventory;
• amortization of acquired intangible assets from business combinations;
• payments or settlements related to legal claims; and
• impacts from hyperinflation accounting.
Management has used and uses these measures internally for planning, forecasting and evaluating the performance of the company’s reporting segments and certain of the measures are used as a component of Amcor’s board of directors’
measurement of Amcor’s performance for incentive compensation purposes. Amcor also evaluates performance on a constant currency basis, which measures financial results assuming constant foreign currency exchange rates used for translation
based on the rates in effect for the comparable prior-year period. In order to compute constant currency results, we multiply or divide, as appropriate, current-year U.S. dollar results by the current-year average foreign exchange rates and then
multiply or divide, as appropriate, those amounts by the prior-year average foreign exchange rates. Constant currency net sales performance also excludes the impact from passing through movements in raw material costs. Amcor believes that these
non-GAAP measures are useful to enable investors to perform comparisons of current and historical performance of the company. For each of these non-GAAP financial measures, a reconciliation to the most directly comparable U.S. GAAP financial
measure has been provided herein. These non-GAAP financial measures should not be construed as an alternative to results determined in accordance with U.S. GAAP. The company provides guidance on a non-GAAP basis as we are unable to
predict with reasonable certainty the ultimate outcome and timing of certain significant forward-looking items without unreasonable effort. These items include but are not limited to the impact of foreign exchange translation, restructuring program
costs, asset impairments, possible gains and losses on the sale of assets and certain tax related events. These items are uncertain, depend on various factors and could have a material impact on U.S. GAAP earnings and cash flow measures for the
guidance period.
2Safety
Committed to our goal of ‘no injuries’
Recordable-case frequency rate
• Staying safe and healthy – our first (per million hours worked)
priority for 2021 fiscal year 4.5
4.1
4.0
4 Acquisition
impacts
• 29% reduction in number of injuries 3.5 3.4
3.2
compared with 1H20 3
2.6 2.6
2.8
2.4
2.5 2.4
• 54% of sites injury free for >12 months 2
2.0 2.0 2.0
2.1
• All business groups reporting fewer 1.5
1
injuries than 1H20
0.5
0
Notes: Recordable cases per million hours worked. All data shown for a 12 month period ended June 30, unless otherwise indicated.
2010 to 2012 includes the demerged Orora business. 2015 to 2018 include acquired businesses from the first day of ownership. The Bemis acquisition is excluded for all periods labelled 2010 through 2019. 2019PF and onwards includes Bemis. The increase
3 in frequency rate between 2016 and 2018 reflects inclusion of the Alusa and Sonoco acquisitions and the increase between 2019 and 2019PF reflects the inclusion of the Bemis acquisition.Key messages for today
Strong first half, increased guidance and shareholder returns
1. Strong first half result ahead of expectations
2. Raised guidance for fiscal 2021 EPS growth to 10-14%
3. Increased dividend and additional share repurchases
4. The Amcor investment case has never been stronger
4 Note: Refer slide 16 for further information regarding revised guidance for fiscal 2021 EPS growthGlobal leader in consumer packaging
• Founded in Australia in 1860
• NYSE (AMCR) and ASX (AMC) listed
• ~$17 bn market cap
• FY20 sales of $12.5 bn & Adjusted EBITDA of $1.9 bn
• ~230 locations, ~47,000 employees, >40 countries
Western
Europe Other Other
24% consumer 4%
HPC 9%
Global reach, Differentiated 5%
geographically balanced $12.5 bn consumer packaging Healthcare
$12.5 bn Food
Emerging 44%
FY20 sales by FY20 sales by
>$3 bn Emerging Markets markets ~$2 bn Healthcare 14%
end market
geography 26%
sales
North
America sales
47%
ANZ Beverage
3% 24%
Notes: Market cap data as of January 29, 2021
5 HPC is Home & Personal CareProven track record of financial performance
Fiscal 2010 - 2020
>20 +6% +8% +15%
YEARS
4.6%
Investment Adjusted Adjusted Average TSR
grade credit EBITDA EPS CAGR Dividend Yield CAGR
rating CAGR (6% DPS CAGR)
Notes: 10 year CAGR based on 2010 IFRS results as reported by Amcor in AUD converted at an FX rate of 0.876 compared to 2020 US GAAP results.
6 Compound TSR reflects period from 1 July 2010 to 30 June 2020 based on local currency7
Amcor Shareholder Value Creation Model
Substantial cash flow funds multiple drivers of value for shareholders
Capital
expenditure
(~ $500 m)
EPS growth
~ 5-10%
SIGNIFICANT Total
ANNUAL Acquisitions / (Organic ~ 3-4%) Shareholder Value
share repurchases
CASH FLOW (~ $300-400 m)
(EPS growth + yield)
10-15% per year
Dividend Historical yield
(~ $750 m) ~ 4-5%
7The Amcor investment case has never been stronger
Global industry leader with proven track record and clear strategy
Consistent growth from consumer and healthcare end markets
Attractive and growing dividend with current yield >4%
Strong balance sheet, substantial capacity to invest and many growth opportunities
Momentum building - organic growth plus synergies
EPS growth + Dividend yield = 10-15% per year
8 Slide as presented in Amcor’s September 2020 Investor BriefingMultiple drivers of organic growth
1 2 Proactive Mix 3 4
Markets Management Innovation Cost Productivity
Growing consumer markets End segments, Products, Differentiated products Scale and capabilities
Customers
Leadership positions in Growth and margin from higher Delivering innovative, more sustainable packaging
growing end markets value market & product segments
healthcare, food and beverage
Protein, premium coffee, hot fill containers,
Balanced global reach with barrier films, etc.
>$3 bn sales in ~$2 bn healthcare sales
Emerging Markets across pharmaceutical and medical
device segments Industry first Reusable Bio-based Lightest weight
microwaveable structure coffee edible oil PET
recycle ready packaging container in
pouch Brazil
+20%* +7%*
Sustainability
Amcor’s greatest opportunity for growth and differentiation
9 * Amcor 1H21 volume growthComprehensive sustainability agenda
Responsible Packaging:
Waste Management
Packaging Design Waste Management Consumer Participation
Infrastructure
Full range of sustainable packaging options Leadership roles in partnerships across the value chain
Recycle ready 100% recycled Aluminum
material
Compostable Bio based Paper
materials
Independent recognition for our ESG strategy and progress
10
10Fiscal 2021 first half result summary
Strong result ahead of expectations
EPS EBIT EBIT margin Strong cash flow & increasing
shareholder returns
Quarterly dividend higher than last year at
11.75 US cps
+16% +8% +70bps
A further $200 million of share repurchases,
bringing total announced in fiscal 2021 to $350
million
33.3 $743 12.0%
cents million
Outstanding execution
Safety, working capital, Bemis synergies, cost performance, innovation
Notes: EPS, EBIT and EBIT margins presented on an adjusted basis. Adjusted non-GAAP measures exclude items which management considers as not representative of ongoing operations.
11 Further details related to non-GAAP measures and reconciliations to U.S. GAAP measures can be found in the appendix section.
EPS and EBIT growth rates expressed in constant currency terms.First half result - Flexibles segment
9% Adjusted EBIT growth compared with last year
1H20 1H21 Highlights
• Adjusted EBIT growth 9% on a constant currency basis
Adjusted EBIT ($m) 602 653 +9%
• 4% organic growth
Adjusted EBIT margin 12.4% 13.5% • 5% ($30 million) synergy benefits
• Higher volumes
• Low to mid single digit growth in all regions
• Volume growth in meat, snack food, cheese and
frozen food, pet food and beverage
• Strong cost performance
First designed to be recycled • Innovative product launches for new and existing
Recycle ready product PVDC free shrink bag for protein
customers in food, personal care, medical and beverage
launch for a leading dairy
end markets.
brand in China
Notes: Non-GAAP measures exclude items which management considers are not representative of ongoing operations. Further detail s related to non-GAAP measures and reconciliations to U.S. GAAP measures can
12 be found in the appendix section.
.Bemis cost synergies tracking ahead of expectations
$35 million benefit in first half fiscal 2021
~$70 million expected in fiscal 2021 (previously $50 to $70 million).
Well positioned to deliver total of $180 million
Annual cost synergies delivered and expected ($ million)
180
~70 ~150
~35
80
Delivered fiscal 2020 Expected fiscal 2021 Cumulative expected by end Cumulative expected by end
fiscal 2021 fiscal 2022
13
13First half result - Rigid Packaging segment
10% Adjusted EBIT growth compared with last year
1H20 1H21 Highlights
• Adjusted organic EBIT growth of 10% on a constant
Adjusted EBIT ($m) 127 134 +10% currency basis
Adjusted EBIT margin 9.5% 9.9% • Higher volumes and positive mix
• North America volumes up
• Beverage volumes up 9% - hot fill up 19%
• Specialty Container volumes higher
Increased use of New product
recycled material launch in PET • Latin America volumes marginally lower
conversion to 86% format for a • New innovations to support customer product launches,
PCR container leading US brand
increase use of post consumer recycled material and
lighter weight containers
Notes: Non-GAAP measures exclude items which management considers are not representative of ongoing operations. Further detail s related to non-GAAP measures and reconciliations to U.S. GAAP measures can
14 be found in the appendix section.
PCR refers to Post Consumer Recycled. 86% PCR applies to 118ml containers.You can also read