Visualizing Tweets from Confirmed Fake Russian Accounts
←
→
Page content transcription
If your browser does not render page correctly, please read the page content below
https://doi.org/10.2352/ISSN.2470-1173.2019.1.VDA-678
                                                                                         © 2019, Society for Imaging Science and Technology

Visualizing Tweets from Confirmed Fake Russian Accounts
Stephen Hsu, David Kes, and Alark Joshi, University of San Francisco, San Francisco, CA, USA

Abstract                                                               Visualizing Social Media Content
      Social media has played a huge role in the 2016 US Presi-              Diakopoulous et al. [7] created Vox Civitas - one of the early
dential Elections. In this paper, we present the results of an ex-     visual analytics interfaces that aggregated and annotated social
ploratory visualization of 200,000+ tweets from confirmed fake         media data with interactive visualizations that can help journalists
twitter accounts. We analyze the user accounts by examining their      summarize social media reactions for high visibility events such
user names, descriptions/bios, tweets, tweet frequency, and con-       as the State of the Union. Abdullah et al. [1] introduced a way to
tent. We found that they made themselves relatable using politi-       measure happiness in a society by evaluating smiles through their
cal and religious beliefs and then used their influence by joining     Smile Index that analyzes smiles in 9 million geo-located tweets
into popular hashtags on Twitter and posting strongly polarizing       over a year. Hochman and Manovich [12] presented an innovative
tweets at crucial times such as debates and primaries in the elec-     approach to visualize the photographs that were posted on social
tion cycle.                                                            media. They identified networks, superimposed locations of pho-
                                                                       tos on geographic locations, identified patterns from the images,
                                                                       and so on. Mallela et al. [14] introduced a system - CEST (City
Introduction
                                                                       Event Summarization Tool) that is agnostic of events and data,
      Social media plays an important role in today’s world with its   but is able to capture sentiments and events dynamically as the
influence on entertainment, sports, news, and even elections [11].     data streams in. Miranda et al. [16] introduced a system - Ur-
With the fervor of the Presidential election being skewed by Rus-      ban Pulse that adopts techniques from computational topology to
sian interference on Twitter and Facebook as well as the notorious     identify the signature of a city. They convert a variety of social
Facebook / Cambridge Analytica scandal [21], it was obvious that       media input to scalar functions that change over time and analyze
there was some interference and we wanted to explore the data.         it to identify the “pulse“ of a city. Their approach is agnostic of
We wanted to explore who these “fake users/twitter bots” were          a city and they demonstrate its application in New York and San
and their characteristics. Specifically, we asked questions such as    Francisco. Xu et al. [24] developed a streamgraph-style interface
“Who are these fake users disguising as?” “How are these fake          to visualize the ebbs and flows of various topics being discussed
users influencing individuals people?”                                 in social media. They showcased their techniques on the 2012
      We applied a combination of natural language processing          United States Election and the Occupy Wall Street movement.
techniques as well as exploratory data visualization techniques
to examine the fake Russian users Tweet data. In particular, we        Visualizing Traffic and Movement
analyzed information about the users and their tweets through the            Endarnoto et al. [8] developed innovative ways to use twitter
following questions:                                                   data to extract traffic conditions that can be consumed on a mobile
                                                                       device. Chen et al. [6] provide an approach to identify movement
  1.   Who these fake users pretend to be - names and descriptions     patterns using social media data. Their technique works on sparse
  2.   When the fake accounts were being created                       data using geolocation and incorporate uncertainty visualization.
  3.   When the fake accounts were most active in tweeting             This conveys the probability of the movement patterns using their
  4.   What topics the accounts were covering                          heuristic rather than communicate sparse information with cer-
                                                                       tainty.
      We also dug into the data and present the results of a case
                                                                       Event and Outlier Detection
study of the most successful users. Specifically, we examined
                                                                             Xia et al. [23] introduced a system that allows users to see
the velocity, polarity, and subjectivity of the tweets from these
                                                                       patterns and outliers in a city by analyzing social media data.
influential accounts. We found that the top twenty influential
                                                                       They use geo-tagged photos in their system to analyze patterns
accounts posted polarizing tweets especially on weekends when
                                                                       and flag unusual activities. In subsequent work, Xia et al. [22]
scandals/announcements occurred. Later these accounts changed
                                                                       improved their approach to identify ’new’ events in a city based
their approach by joining trending hashtags on twitter and inject-
                                                                       on spatio-temporal analysis of social media data. They use a com-
ing propaganda into those tweets.
                                                                       bination of Twitter and Instagram posts to validate their findings
                                                                       and to further find events that have low spatial and temporal devia-
Related Work                                                           tion. Ferracani et al. [9] developed a web interface that allows the
     Social media is widely being used to analyze current senti-       identification of local events in an urban environment using statis-
ments, events, movement patterns, and so on. [3, 5]. With the          tical methods. Giridhar et al. [10] developed a novel unsupervised
large amount of data available in terms of text, images, videos,       approach to fuse multiple social media data (specifically Twitter
geolocation, hashtags, and so on, such analysis can be invaluable      and Instagram posts) and correlate events being detected across
and provide insight into the data.                                     various social platforms. Borges et al. [3] provide an overview of

IS&T International Symposium on Electronic Imaging 2019
Visualization and Data Analysis 2019                                                                                                    678-1
veys the distribution of the First and Last “Names” of all the users
                                                                          in the data. Through bar graphs, we are able to quickly see the
                                                                          popularity of such ”fake” names.

                                                                          What are their profile descriptions?
                                                                                Once we had an understanding of the user account names,
                                                                          we turned our attention to the description/bio of the users. Ev-
                                                                          ery Twitter user has the option of including a short description of
                                                                          themselves and the description frequently helps a reader separate
                                                                          a user from a tweet bot. Users often post their summaries and
                                                                          ideologies for others to see. Specifically, Figure 2 right hand side
                                                                          shows one topic in common with the fake accounts: religion. By
                                                                          using words like “God,” “InGodWeTrust,” and “GodBlessAmer-
                                                                          ica,” the fake accounts became relatable to a large group of people.
                                                                          Other bios include black lives matters, Repeal Obamacare and
                                                                          official news sounding descriptions (such as “sports,” “weather,”
                                                                          and “official”) as well as foreign topics. Therefore, by quickly,
Figure 1. First and Last “Names” of the Users. Common American Names,
                                                                          relating to this fake user, users are more likely to follow or agree
Respectable sounding news outlets, and Foreign names were the three ma-
                                                                          with the fake accounts tweets. These fake accounts used the well-
jor categories of all the users in the data.
                                                                          known attitude similarity work by Byrne [4] that states that in-
                                                                          dividuals with similar attitudes and beliefs are attracted to each
                                                                          other, whereas dissimilarity results in repulsion [19]. In 2014,
the various ways in which events can be detected in urban envi-           Balmaceda [15] found that when interacting online individuals
ronments. They show how events such as music concerts too can             are attracted to others with similar opinions and beliefs.
be identified using social media. Chen et al. [5] provide a similar             Figure 2 shows a visualization of topics estimated using La-
overview on the kinds of visual analytics that can be performed           tent Dirichlet Allocation (LDA) [2]. LDA is a statistical model to
on social media data. They take a comprehensive approach to so-           find clusters of topics within a corpus. It then assigns each cluster
cial media using a variety of social media such Twitter, Flickr,          a numerical value to which the user must interpret a theme. The
Foursquare, Sina Weibo, and so on.                                        figure shows a visualization of the LDA clusters of topics on the
                                                                          left and a histogram of the related terms for the user selected topic
Approach                                                                  on the right. In the figure, the user selected topic cluster 7 and
      To understand the influence of Twitter on elections, we             is shown a histogram of related terms that contain controversial
started by looking into Twitter data that was linked to Russia            terms related to black lives matter, Obama, police, AmericaFirst,
during the 2016 U.S. Presidential Elections. We used the data             and so on. Many of these topics were controversial during the
published by NBC News [17] that contained more than 200,000               election and were being debated and discussed by the politicians
tweets that Twitter has tied to “malicious activity“ from Russia-         as well as users online. Through this technique, we able to simply
linked accounts to the election. These accounts coordinated to            interpret clusters of words rather than the entire corpus to discover
work together as part of a large network and sent out thousands of        topics. We used the LDAVis [20] tool to generate the figure.
inflammatory tweets.
      Our goal was to uncover any underlying structures in the            When were they made?
data and detect any outliers or anomalies through the use of ex-                The next important issue to consider is when these fake ac-
ploratory interactive visualization. We will first show the results       counts were created. Figure 3 shows a timeline of when the ac-
of exploring the entire dataset to highlight characteristics of all the   counts were created. Of the 454 accounts deemed to be fake
user accounts and then present a case study exploring the tweets          Russian accounts, we can see the creation of the fake accounts
of the top 20 most prolific and influential user accounts.                started in 2009 and reached its peak of creations in 2013 before
                                                                          slowly lessening all the way to the start of 2017 as evidenced by
Who are these fake users?                                                 the spikes in the graph. Interestingly, this means the majority of
      To understand the user accounts of fake users, we first ex-         fake accounts were created years before the actual 2016 Presi-
plore just the user names and found that there are three clear cat-       dential election, perhaps to cause strife and division amongst US
egories of the fake account names. The first combination con-             readers well in advance of the election.
sists of American sounding first names such as “Chris”, “Rick” or
“Jeremy” combined with American sounding last names such as               Where are they from?
“Green,” “Roberts,” or “Cox.” The second combination consists                   We then explored the origin of these accounts and discovered
of formal sounding news sources such as “Washington Online” or            that of the 454 values, approximately half the values were miss-
“Atlanta Today.” Finally, the third combination consists of purely        ing. Of the 287 locations listed, 124 were listed as some form
foreign names. From this, we can see that its often difficult to          of “United States”, 68 were listed as a large metropolitan cities
tell which accounts are fake based off the name alone as it could         in the United States (for example, San Francisco, New York, At-
be any average Joe, news site, or just a foreign individual with          lanta, Los Angeles), and 37 values were in foreign countries, and
an unrecognizable name. Figure 1 shows a histogram that con-              the remaining 58 values were imaginary like “located at the corner

                                                                                          IS&T International Symposium on Electronic Imaging 2019
678-2                                                                                                          Visualization and Data Analysis 2019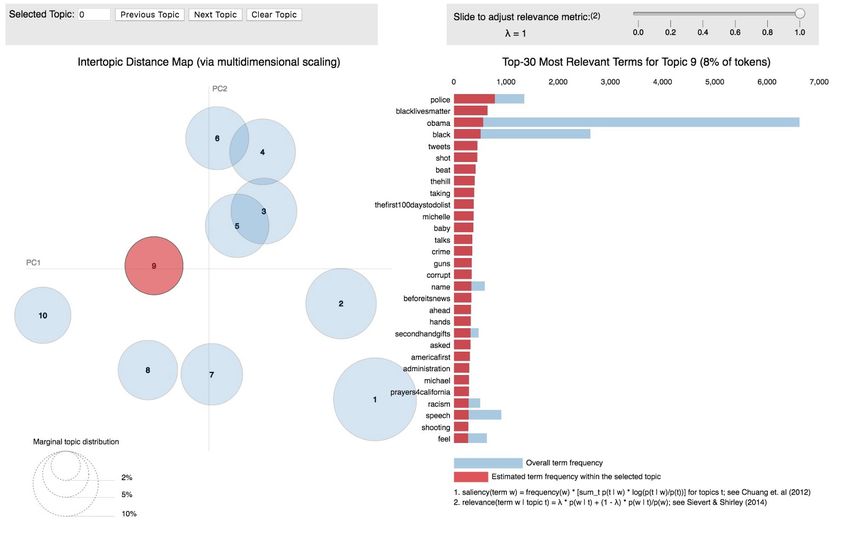
Figure 2.   Topics Within the Descriptions of Fake Users’ Profiles. The left half of the figure shows the various topics that can be selected and the right half of
the figure shows a histogram of the terms in that topic. In this figure, we picked Topic 7 on the left and related terms for that topic such as God, Conservative,
Wake Up America, and so on are shown on the right. We used the LDAVis [20] tool to analyze the profile descriptions.

Figure 3.   Russian Fake Accounts Created from 2009 to 2017. Some ac-
counts were created well in advance of the 2016 elections and were proba-
bly being explored for their influence on the 2014 midterm elections but were
then kept alive with regular tweets to increase their influence.

                                                                                     Figure 4.   Followers vs. Number of Tweets of Fake Accounts. As can be
of happy and healthy” or “the block down the street.” Therefore,                     seen here, users who tweeted frequently had high numbers of followers. Out-
since the data was missing for a majority of the users, and most                     liers such as the fake Jenna Abrams account whose racist and controversial
likely fake, we opted from analyzing the data further.                               tweets were being discussed in the mainstream media can be seen here.

How influential are these accounts?
    We next wanted to explore the impact these fake accounts
were having on the users of Twitter. We use the number of fol-
lowers as a metric to see which accounts could be considered “in-

IS&T International Symposium on Electronic Imaging 2019
Visualization and Data Analysis 2019                                                                                                                            678-3
their polarizing opinions to these sensitive events and topics that
were already being discussed actively on social media.
Case Study - The top 20 users
Now that we have explored the various characteristics of the
fake account, we explore the data further in the form of a case
study of the top 20 users. We used Figure 4 to determine the 20
most influential fake users to examine their tweeting behavior in
terms of velocity, sentiment, and subjectivity over time of the top
20 followed fake Russian accounts.
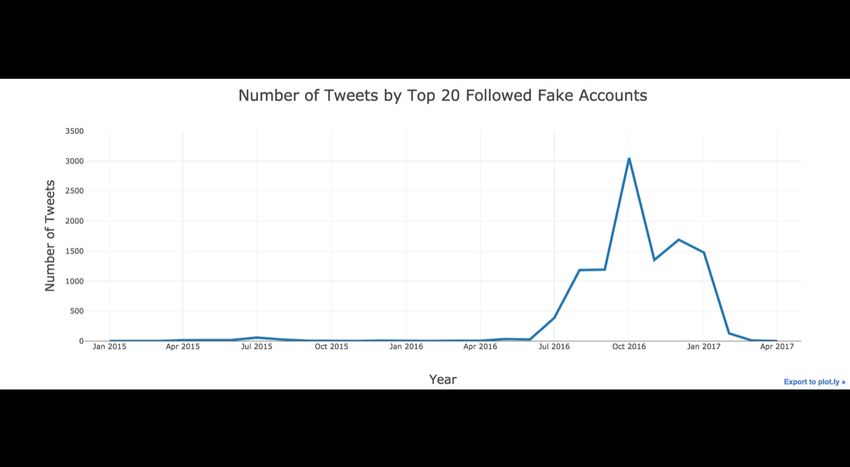
Tweet Velocity
Figure 5. Heat Map of Fake User Tweet Activity shows that Sundays and Figure 7 shows the overall volume of tweets from the 20
Tuesdays especially as the elections got closer (August-December) were fake accounts. In terms of pure tweet volume, we can see a trend
more frequent for the fake accounts. of the fake accounts being almost nonexistent until around June
2016, at which point the volume of Tweets increases dramatically:
reaching its apex in October 2016. The tweets then tumble down
fluential.” Figure 4 plots the number of tweets versus the number in volume after November 2016 (election month), with one last
of followers and we can see an overall trend of the number of resurgence around December 2016 before going back to an almost
Tweets increasing with the number of followers as marked with inactive state. This trend shows the opportunistic behavior of the
the line of best fit. This makes sense as these fake accounts are fake accounts, tweeting at the most tense and vital points of the
leveraging their popularity on social media to reach out and in- election fervor.
fluence more individuals with more tweets. Using the labels of
points as a method of zooming in, we were able to detect one
Tweet Sentiment and Subjectivity
the infamous Jenna Abrams account, whose racist, controversial,
Detecting the Sentiment and Subjectivity of a tweet was done
and fake tweets were at one point covered in mainstream media.
using a Naı̈ve Bayes classifier from the Textblob [13] package
Given the large number of followers that these fake accounts had
in Python. Textblob uses the NLTK Naı̈ve Bayes classifier [18]
amassed, it does seem that these accounts were influential on the
for classification. If the word has never been seen before, the
Twitter platform.
classifier ignores that word, otherwise, the classifier determines
what the polarity or the subjectivity is for each specific word and
When are they posting?
uses the Bayes Rule to determine what the polarity or subjectivity
We wanted to explore the days of the week when these fake
is of the entire sentence.
accounts would post more frequently than others. We generated a
The Sentiment could either be positive or negative and was
heat map to visualize the days of the week and aggregated the data
scored on a +1 (most positive) to -1 (most negative) scale. Sub-
according to the month in the year. Figure 5 shows the above heat
jectivity was also computed as a value between 0 and 1, where 0
map where we can see that the fake users are predominantly post-
is very objective and 1 is very subjective. Subjective tweets are
ing on Sundays and Tuesdays in the later months of the year such
those where personal opinions and biases are clearly reflected,
as August, September, October, November, and December as the
whereas objective tweets are those that stick to the facts.
elections got closer. Based on the heatmap, we can determine that
there is a pattern and that the tweets were not randomly posted. Figure 8 is the average sentiment and subjectivity of the
The fake users clearly understand the influence of their content tweets made by the top 20 followed users. In the context of
and that it may be retweeted with more individuals on weekends tweets, sentiment is defined as an attitude, thought, or judgment.
rather than weekdays in the later half of the year when the elec- In Textblob, the score ranges from 0 for very objective and 1 for
tion takes place as seen with the noticeably darker hues forming heavily subjective or opinionated.
towards the corner right of the figure.
Time Series Point Analysis
What are they saying? We further explored the data and annotated the series of
Figure 6 shows a screen shot of the Topical Modeling of the tweets using the hashtags and their popularity. Figure 9 shows the
Tweet Content. Similar to the descriptions of the fake users, we series of tweets and the popularity of the various hashtags, with
examined the topics covered within the actual tweet content using key hashtags noted and emphasized. Using the power of hind-
LDA to cluster the data into topic clusters with terms. Figure 6 sight and the Wikipedia of US current events, we can see what
shows that the Black Lives Matters and other racial subject mat- some notable spikes are related to:
ters were one such topic that the Russian accounts targeted with
words such as “police,” “blacklivesmatter,” “crime,” and refer- • August 4, 2016: spike of hash tag #obamaswishlist which
ences to the shooting in San Bernardino, particularly about the were posts about fanciful and perceived hypocritical items
perpetrator being of minority descent. Other topics that we dis- Obama “wanted”
covered were being propagated by the users consisted of Hillary • August 17, 2016: spike of the hash tag #trumpsfavoritehead-
Clintons private email server, ISIS, pro-Trump slogans, slander- line which are Tweets about sardonic headlines that Donald
ings of the election debates, and school shootings. They added Trump would endorse
IS&T International Symposium on Electronic Imaging 2019
678-4 Visualization and Data Analysis 2019
Figure 6. Topics in the tweets of the fake users. The left half shows the various topics and the right half of the figure shows a histogram of the terms in a user
selected topic. We picked Topic 9 on the left and related terms for that topic such as Black Lives Matter, Obama, AmericaFirst, and so on are shown on the right.
We used the LDAVis [20] tool to analyze the bios.

Figure 7.   Number of Tweets by the top 20 Fake Accounts. We can see                Figure 8.    Average Sentiment and Subjectivity of Top 20 Followed Users.
that the volume of the tweets was highest during the run up to the Elections        The positive sentiment and subjective tweets were seen during crucial times
which was followed by a slow demise to an almost inactive state in 2017.            in the election cycle. The first big spike was seen during the first Republican
                                                                                    debate on August 6, 2015. The second big spike is just before and on March
                                                                                    1st, 2016 which was Super Tuesday when 11 states voted in their primaries
                                                                                    for their parties candidates.
   • September 28, 2016: #ihavearighttoknow movement by
     fake accounts to know what Hillary Clintons emails were
   • October 5, 2016: #ruinadinnerinonephrase was actually                             • December 7, 2016: #idrunforpresidentif “Id known I needed
     seen as both politically-backed and non-politically-backed                          literally zero experience” and other sardonic comments
     with some referencing it to Hillary Clinton while others                            about the presidential election
     made memes out of the hashtag
   • October 17, 2016: #makemehateyouinonephrase, another                                 Perhaps coincidentally or not, the initial spikes were all re-
     hash tag movement that was seen as either part of a meme                       lated to fake accounts simultaneously using hashtags to mock
     culture or part of the political systems                                       presidents and presidential candidates. The tweets were clearly
   • November 14, 2016: #reallifemagicspells used in reference                      politically-based with the name drops to actual candidates. How-
     with black lives matters and Trumps family                                     ever, as time progressed, the distinguishing factor between these

IS&T International Symposium on Electronic Imaging 2019
Visualization and Data Analysis 2019                                                                                                                            678-5
Figure 9.   Time Series Tweets with Hash Tags. This figure shows when the top 20 most influential accounts tweeted and has been annotated with popular
hashtags coinciding with the spikes. The fake accounts joined in with the popular hashtags and injected propaganda in them.

tweets became less obvious, as the fake accounts used actual pop-                        IEEE SmartWorld, Ubiquitous Intelligence & Computing,
ular hashtags that were not clearly political. Additionally, the                         Advanced & Trusted Computed, Scalable Computing
tweets seemed to be initially aimed at all the candidates rather                         & Communications, Cloud & Big Data Computing,
than one particular candidate until Trump was actually elected, at                       Internet of People and Smart City Innovation (Smart-
which point these fake accounts joined the popular hashtags at-                          World/SCALCOM/UIC/ATC/CBDCom/IOP/SCI).                 IEEE,
tacking Trump.                                                                           2017.
                                                                                   [4]   Donn Byrne. An overview (and underview) of research and
Conclusion                                                                               theory within the attraction paradigm. Journal of Social and
                                                                                         Personal Relationships, 14(3):417–431, 1997.
     From our analysis, we learned that the fake accounts dis-
                                                                                   [5]   Siming Chen, Lijing Lin, and Xiaoru Yuan. Social media
guised themselves as (1) average Americans, (2) news sites with
                                                                                         visual analytics. In Computer Graphics Forum, volume 36,
metropolitan names, or (3) international names that describe
                                                                                         pages 563–587. Wiley Online Library, 2017.
themselves with relatable topics such as political and religious
                                                                                   [6]   Siming Chen, Xiaoru Yuan, Zhenhuang Wang, Cong Guo,
beliefs. We also found that they achieved their objective of in-
                                                                                         Jie Liang, Zuchao Wang, Xiaolong Luke Zhang, and Jiawan
fluencing Twitter users by posting polarizing tweets at oppor-
                                                                                         Zhang. Interactive visual discovering of movement pat-
tunistic times such as the weekends when scandals and large an-
                                                                                         terns from sparsely sampled geo-tagged social media data.
nouncements occurred. Finally, they grew sentient of their obvi-
                                                                                         IEEE transactions on visualization and computer graphics,
ous posts by subtly joining trending hashtags and injecting propa-
                                                                                         22(1):270–279, 2016.
ganda within it.
                                                                                   [7]   Nicholas Diakopoulos, Mor Naaman, and Funda Kivran-
                                                                                         Swaine. Diamonds in the rough: Social media visual an-
References                                                                               alytics for journalistic inquiry. In Visual Analytics Science
 [1] Saeed Abdullah, Elizabeth L Murnane, Jean MR Costa, and                             and Technology (VAST), 2010 IEEE Symposium on, pages
     Tanzeem Choudhury. Collective smile: Measuring societal                             115–122. IEEE, 2010.
     happiness from geolocated images. In Proceedings of the                       [8]   Sri Krisna Endarnoto, Sonny Pradipta, Anto Satriyo Nu-
     18th ACM Conference on Computer Supported Cooperative                               groho, and James Purnama. Traffic condition information
     Work & Social Computing, pages 361–374. ACM, 2015.                                  extraction & visualization from social media twitter for an-
 [2] David M Blei, Andrew Y Ng, and Michael I Jordan. Latent                             droid mobile application. In Electrical Engineering and In-
     dirichlet allocation. Journal of machine Learning research,                         formatics (ICEEI), 2011 International Conference on, pages
     3(Jan):993–1022, 2003.                                                              1–4. IEEE, 2011.
 [3] Julio Borges, Henrik Hain, Simon Sudrich, and Michael                         [9]   Andrea Ferracani, Daniele Pezzatini, Lea Landucci,
     Beigl.     Event detection for smarter cities.     In 2017

                                                                                                   IS&T International Symposium on Electronic Imaging 2019
678-6                                                                                                                   Visualization and Data Analysis 2019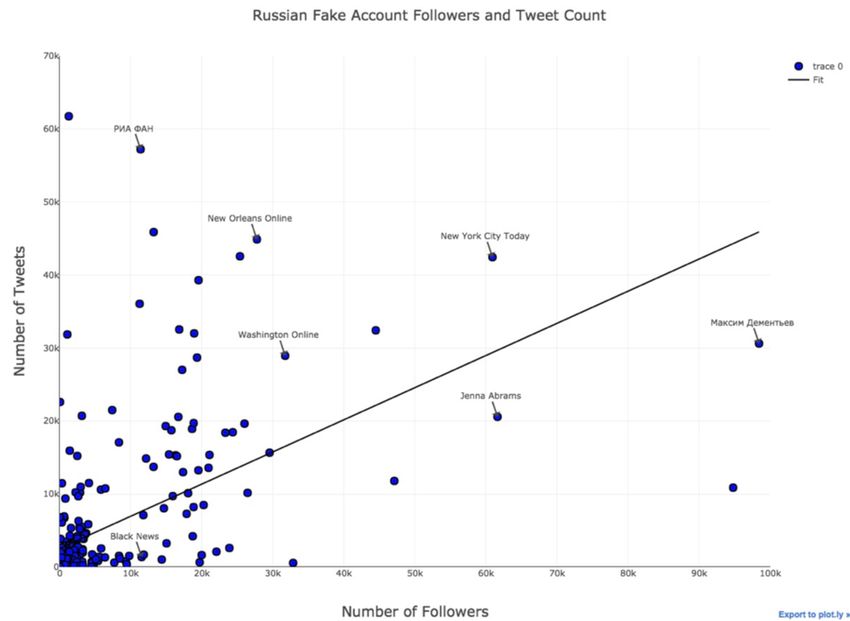
Giuseppe Becchi, and Alberto Del Bimbo. Separating the            time social media visualization of hyper-local city data. In
       wheat from the chaff: Events detection in twitter data. In        Proceedings of the 23rd International Conference on World
       Proceedings of the 15th International Workshop on Content-        Wide Web, pages 167–170. ACM, 2014.
       Based Multimedia Indexing, page 14. ACM, 2017.               [24] Panpan Xu, Yingcai Wu, Enxun Wei, Tai-Quan Peng, Shixia
[10]   Prasanna Giridhar, Shiguang Wang, Tarek Abdelzaher, Tan-          Liu, Jonathan JH Zhu, and Huamin Qu. Visual analysis of
       vir Al Amin, and Lance Kaplan. Social fusion: Integrat-           topic competition on social media. IEEE Transactions on
       ing twitter and instagram for event monitoring. In Auto-          Visualization and Computer Graphics, 19(12):2012–2021,
       nomic Computing (ICAC), 2017 IEEE International Con-              2013.
       ference on, pages 1–10. IEEE, 2017.
[11]   Guardian.        Twitter admits far more russian bots
       posted on election than it had disclosed.            https:
       //www.theguardian.com/technology/2018/jan/19/
       twitter-admits-far-more-russian-bots-posted-on-election-than-it-had-disclosed,
       2018.
[12]   Nadav Hochman and Lev Manovich. Zooming into an in-
       stagram city: Reading the local through social media. First
       Monday, 18(7), 2013.
[13]   Steven Loria. Textblob - simplified text processing. https:
       //textblob.readthedocs.io/en/dev/, 2017.
[14]   Deepa Mallela, Dirk Ahlers, and Maria Soledad Pera. Min-
       ing twitter features for event summarization and rating. In
       Proceedings of the International Conference on Web Intelli-
       gence, pages 615–622. ACM, 2017.
[15]   Jose Maria Balmaceda, Silvia Schiaffino, and Daniela
       Godoy. How do personality traits affect communication
       among users in online social networks? Online Informa-
       tion Review, 38(1):136–153, 2014.
[16]   Fabio Miranda, Harish Doraiswamy, Marcos Lage, Kai
       Zhao, Bruno Gonçalves, Luc Wilson, Mondrian Hsieh, and
       Cláudio T Silva. Urban pulse: Capturing the rhythm of
       cities. IEEE transactions on visualization and computer
       graphics, 23(1):791–800, 2017.
[17]   NBC News.                Twitter deleted 200,000 rus-
       sian troll tweets. read them here.                   https:
       //www.nbcnews.com/tech/social-media/
       now-available-more-200-000-deleted-russian-troll-tweets-n844731,
       2018.
[18]   Team NLTK. NLTK Naı̈ve Bayes Classifier. https://
       www.nltk.org/, 2017.
[19]   Joanna Schug, Masaki Yuki, Hiroki Horikawa, and Kosuke
       Takemura. Similarity attraction and actually selecting simi-
       lar others: How cross-societal differences in relational mo-
       bility affect interpersonal similarity in japan and the usa.
       Asian Journal of Social Psychology, 12(2):95–103, 2009.
[20]   Carson Sievert and Kenneth Shirley. Ldavis: A method for
       visualizing and interpreting topics. In Proceedings of the
       workshop on interactive language learning, visualization,
       and interfaces, pages 63–70, 2014.
[21]   New York Times. Facebook and cambridge analytica:
       What you need to know as fallout widens. https:
       //www.nytimes.com/2018/03/19/technology/
       facebook-cambridge-analytica-explained.html,
       2018.
[22]   Chaolun Xia, Jun Hu, Yan Zhu, and Mor Naaman. What is
       new in our city? a framework for event extraction using so-
       cial media posts. In Pacific-Asia Conference on Knowledge
       Discovery and Data Mining, pages 16–32. Springer, 2015.
[23]   Chaolun Xia, Raz Schwartz, Ke Xie, Adam Krebs, Andrew
       Langdon, Jeremy Ting, and Mor Naaman. Citybeat: real-

IS&T International Symposium on Electronic Imaging 2019
Visualization and Data Analysis 2019                                                                                               678-7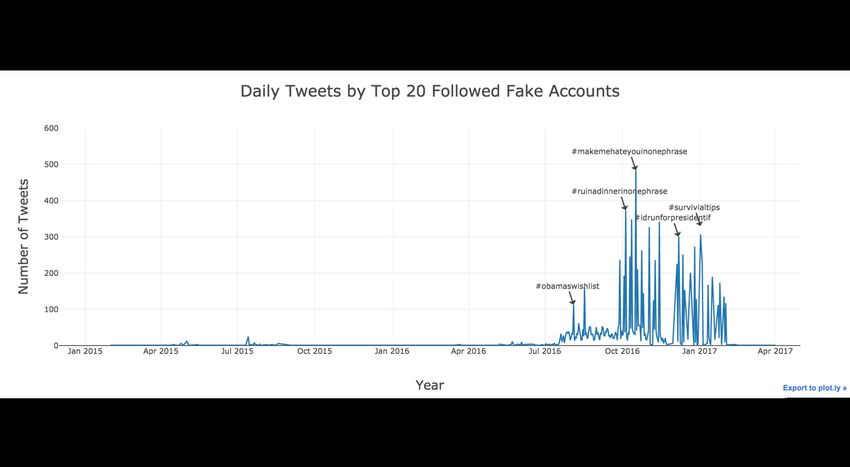
JOIN US AT THE NEXT EI!

 IS&T International Symposium on

 Electronic Imaging
 SCIENCE AND TECHNOLOGY

Imaging across applications . . . Where industry and academia meet!

• SHORT COURSES • EXHIBITS • DEMONSTRATION SESSION • PLENARY TALKS •
• INTERACTIVE PAPER SESSION • SPECIAL EVENTS • TECHNICAL SESSIONS •

                  www.electronicimaging.org
                                                             imaging.org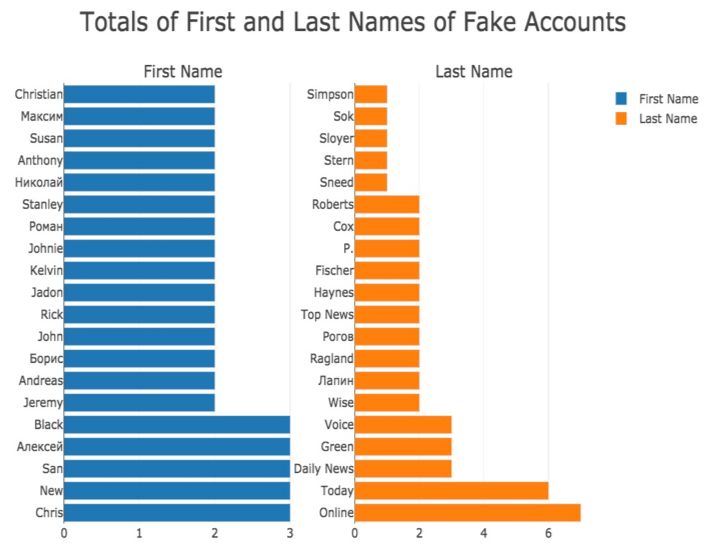
You can also read