Infrared Physics and Technology
←
→
Page content transcription
If your browser does not render page correctly, please read the page content below
Infrared Physics & Technology 115 (2021) 103733
Contents lists available at ScienceDirect
Infrared Physics and Technology
journal homepage: www.elsevier.com/locate/infrared
Assessing firmness in mango comparing broadband and
miniature spectrophotometers
Nur Fauzana Mohd Kasim a, Puneet Mishra b, *, Rob E. Schouten a, Ernst J. Woltering a, b,
Martin P. Boer c
a
Horticulture and Product Physiology, Wageningen University and Research Centre, Wageningen, The Netherlands
b
Wageningen Food and Biobased Research, Wageningen University and Research Centre, Wageningen, The Netherlands
c
Biometris, Wageningen University and Research Centre, Wageningen, The Netherlands
A R T I C L E I N F O A B S T R A C T
Keywords: The aim of this study was to compare a laboratory-based and a pocket-sized near-infrared (NIR) spectropho
SCiO tometer (SCiO) to predict mango fruit firmness. Three batches of mango fruit were measured to explore batch
Portable specific and global models. To gain insight to useful wavelengths important for predicting mango firmness
Variable selection
variables, the bootstrapping soft shrinkage (BOSS) variable selection routine was used. Modelling was performed
Chemometrics
with partial least-squares regression (PLSR). The reference firmness measurements were performed with AWETA
Non-destructive
acoustic firmness analyser. The SCiO and the laboratory-based instrument showed similar performances pre
dicting the reference firmness in terms of prediction coefficient of determination (R2). However, the root mean
squared error of prediction (RMSEP) was slightly lower for the laboratory-based instrument compared to the
SCiO, likely because a broader spectral region was used. The performance of the batch specific models was
improved by up to 8% in R2 with a 13% reduction in RMSEP when BOSS was applied. For both laboratory based
and SCiO, the global models based on combined data from the three batches, showed good performance (R2
0.74–0.93, RMSEP 4.8 – 8.2 Hz2g2/3 depending on the batch) to predict the firmness. Due to comparable per
formance of the SCiO compared to the laboratory-based spectrophotometer, the pocket-sized SCiO NIR sensor
has the potential to become a low-cost, easy to use non-destructive tool to measure firmness in mango fruit.
1. Introduction mainly related to the action of cell wall hydrolyzing enzymes that loosen
the cell–cell adhesion and the structural integrity of the cell walls. In
Mango (Mangifera indica L.) holds significant world-wide economic addition, softening may also be related to the disappearance of starch
values in terms of production and consumption (https://www.tridge. and the loss of water from the ripening fruit [35,4,12,34]. Traditionally,
com/intelligences/mango/export). Mango fruit are widely cultivated firmness of mango fruit can be measured using a texture analyzer [29].
in tropical and subtropical areas and it is categorized as a climacteric However, this practice is destructive, and prevents monitoring of the
fruit that ripens after harvest. In the European as well as global market, same fruit repeatedly. The monitoring of same fruit is necessary as it
the Netherlands plays an important role in mango import and export allows making decision of the fruit ‘ready to eat’ stage during the arti
trade. Mango fruit are imported into the Netherlands and re-exported to ficial ripening process.
the neighboring European countries. The Netherlands market has seen Visible and near-infrared (VNIR) spectroscopy is one of the tech
an increase of 88.4% in export trade for mango fruit in the past five years niques in the quest for identification of the best robust technique for
(Tridge, 2018). Ripening of mango is suppressed at low temperatures routine firmness analysis [31]. This is because VNIR spectroscopy can
and therefore fruit are commonly transported in refrigerated containers capture physicochemical properties of fruit peel and pulp of which some
at about 8–10 ◦ C. Mango fruit that arrive in the Netherlands are often properties have a correlation with the firmness. VNIR spectroscopy has
artificially ripened before they are delivered to the retail. In mango, been widely explored for assessment of chemical components in mango
firmness is the most widely used quality indicator to determine its fruit such as soluble solids content (SSC) [8], dry matter (DM) [27], and
readiness for the market [7,25]. The loss of firmness during ripening is titratable acidity (TA) [8]. The assessment of chemical components is
* Corresponding author.
E-mail address: puneet.mishra@wur.nl (P. Mishra).
https://doi.org/10.1016/j.infrared.2021.103733
Received 18 January 2021; Received in revised form 28 March 2021; Accepted 30 March 2021
Available online 6 April 2021
1350-4495/© 2021 The Author(s). Published by Elsevier B.V. This is an open access article under the CC BY license (http://creativecommons.org/licenses/by/4.0/).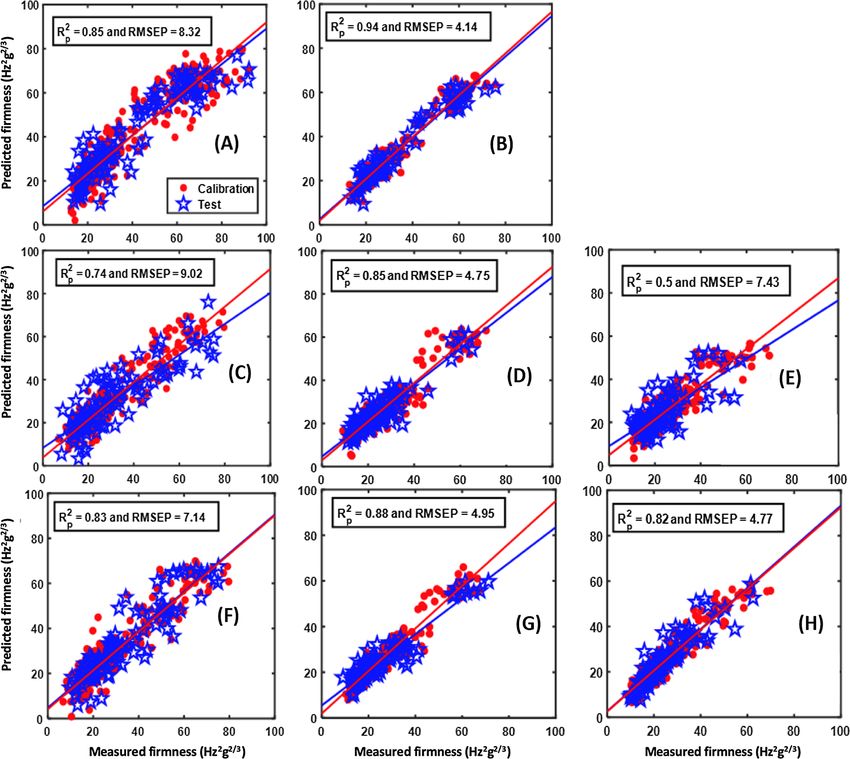
N.F.M. Kasim et al. Infrared Physics and Technology 115 (2021) 103733
mango fruit harvested in three consecutive weeks. During the experi
ment, all mango fruit were stored at 13 ◦ C. VNIR measurement with
Zeiss spectrophotometer were taken at six time points during twenty
days. SCiO measurements were carried out during five measurement
days for batch 1 and three measurement days for batch 2. All mea
surements were done on four positions on each individual fruit, with two
measurements per cheek (Fig. 1).
2.2. Firmness measurements with AWETA
Non-destructive firmness measurements were performed with
AWETA (Aweta, Pijnacker, The Netherlands) acoustic firmness sensor
[25], directly after the mango fruit were removed from the 13 ◦ C stor
age. AWETA acoustic firmness analyzer uses a gentle tap on the fruit
surface and uses a microphone to record the sound frequencies gener
ated by the tap on fruit. Further, it performs Fourier analysis to find the
natural frequency (f) of the fruits and combines it with the fruit weight
Fig. 1. Position on each mango fruit where firmness and VNIR spectra (w) to estimate the fruit firmness/toughness as firmness = f2 × w2/3. For
were measured. calibration modelling with the VNIR spectroscopy, averaged firmness
measurements were used in the modelling.
possible as the VNIR spectroscopy spectral range (400–2500 nm) cap
tures 1st, 2nd and 3rd overtones and a combination of functional group 2.3. VNIR spectroscopy measurement
vibrations [14,16]. The major overtones observed are from O-H, N-H
and C-H bonds that are characteristic of water, proteins, sugars and fatty Vis-NIR spectroscopy measurements were done by two different type
acids. Although there are many applications for prediction of chemical of spectrophotometers: a Zeiss and a SCiO portable spectrophotometer.
components, use of VNIR spectroscopy for prediction of a physical VNIR acquisition was done within two hours of transferring the mango
property such as firmness are still emerging. A prediction R2 of 0.82 was fruit from the 13 ◦ C storage using the Zeiss spectrophotometer while the
obtained for a set of ‘Keitt’ and ‘Kent’ mango fruit by correlating near- NIR acquisition for the SCiO was done immediately after. A fast acqui
infrared (NIR) spectroscopy data with acoustic firmness [28]. A pre sition was performed to minimize the effect of temperature difference on
diction R2 of 0.75 for ‘Kent’ mango fruit was obtained by correlating the NIR spectra. For each fruit, the spectral measurements were per
near-infrared (NIR) spectroscopy with acoustic firmness [17]. Texture formed on the same 4 spots as used for acoustic firmness measurements
analysis was also used as a reference to calibrate NIR spectroscopy data (Fig. 1). Further, all 4 spectra were averaged to have a single mean
attaining a prediction R2 of 0.82. However, a main drawback of texture spectra per fruit to compensate for spatial variability in fruit.
analysis is that the same fruit cannot be followed during the ripening
[22]. 2.3.1. Zeiss spectrophotometer
In the past decade, portable spectroscopy gained wide attention [1,3] This apparatus consisted of two connected spectrophotometers: 1)
and several applications of portable spectroscopy emerged in the Zeiss MCS 521 Vis NIR-E (Carl Zeiss, Jena, Germany) which measures
domain of fresh fruit analysis [6,18] measuring in the 700–1100 nm the visible spectrum from 305 to 962 nm at intervals of 3.2 nm and, 2)
region to capture the 3rd overtones of the O-H, C-H and N-H bonds. Zeiss MCS 511 NIR 1.7, spectrophotometer (Carl Zeiss, Jena, Germany)
Pocket-sized NIRS sensors emerged; easy to use, low in cost and con which measures the NIR spectrum from 962 to 1713 nm at intervals of
nected by smartphone, allowing users to develop new applications [26]. 6.3 nm. Both spectrophotometers were equipped with dual fiber light
The SCiO was demonstrated to predict chemical components (SSC and source (Schott, KL1500). Radiometric calibration was done with a black
DM) with moderate accuracy in kiwifruit, apple, avocado and feijoa and a white reflectance i.e. Spectralon references on the sensor. One
[10]. Another recent SCiO application involved prediction of DM con spectrum was derived from an average of 10 measurement scans in each
tent in avocado fruit where a prediction R2 of 0.71 was obtained [26]. measurement spot on each individual fruit. VNIR measurement was
In this study, we compared the performance of SCiO with the done in the dark. The measurement was performed in reflectance mode
traditional laboratory-based spectrophotometer for prediction of firm by keeping the sensor and light source 1 cm apart from mango skin.
ness in mango fruit during ripening. The reference firmness measure
ments were performed with AWETA acoustic firmness sensor. The 2.3.2. SCiO pocket molecular scanner
acoustic firmness was used as the reference as the same fruit was A SCiO (Consumer edition, Consumer Physics, Israel) was equipped
required to be followed during its ripening, hence, a traditional radial with a standard extension tool attached to the front of the device in order
based firmness measurement cannot be used as it damages the fruit. The to maintain a constant distance (2 cm) between the sensor and the
regression modelling was performed with partial least-squares regres mango skin. The white reference measurements using the reflectance
sion (PLSR). Three batches of mango fruit were measured in the standard supplied by SCiO. Data collected was sent to the SCiO cloud
experiment to study the generalizability of approach. Both the batch storage. Stored data was later extracted as .xlsx files for further analysis.
specific and global models were explored. Further, to gain insight to The SCiO device measured in the spectral range of 740 nm to 1070 nm.
wavelengths important for predicting mango firmness, the boot
strapping soft shrinkage (BOSS) approach was used. 2.4. Data pre-processing
2. Materials and methods Spectral data from both the Zeiss and SCiO spectrophotometers were
analyzed in MATLAB (2018b, Natick, MA, USA). First, the noise signal of
2.1. Mango samples the spectra was inspected, and spectra identified as outliers were
excluded. Due to noise, the extreme spectral bands from the spectra
Three batches of ‘Keitt’ mango fruit were imported from the same obtained from Zeiss spectrophotometer were reduced from 305–1713
region in Malaga, Spain in the months of November and December of nm to 408–1683 nm. The SCiO spectra were used in full. Further,
2016. Transport was by refrigerated truck. Each batch consisted of 50 spectral smoothing was performed with the Savitzky-Golay [24]
2
N.F.M. Kasim et al. Infrared Physics and Technology 115 (2021) 103733
batches. To optimize PLSR, Venetian-blind (10 random blocks) cross-
validation (CV) was performed resulting in the root mean squared
error cross-validation (RMSECV) [32]. Since, the data has multiple
batches, the cross validation set for global models included data from all
batches to attain a generalized model. The elbow point in the cross-
validation plot was used for selecting the LVs in the case of PLSR. The
performance of the models were evaluated using the prediction coeffi
cient of determination (R2P) and the root mean squared error of pre
diction (RMSEP).
2.4.2. Boss
Bootstrapping soft shrinkage (BOSS) is a recently developed variable
selection approach for highly colinear data such as VNIR data [2]. In the
domain of VNIR spectroscopy, the BOSS method has already out
performed high performing variable selection methods such Monte
Carlo uninformative variable elimination, competitive adaptive
reweighted sampling and genetic algorithm partial least squares [2].
The BOSS method combines the ideas of weighted bootstrap sampling
and model population analysis [2]. The weights of variables are deter
mined based on the absolute values of regression coefficients. Weighted
bootstrap sampling is applied according to the weights to generate sub-
models and model population analysis is used to analyze the sub-models
Fig. 2. Firmness loss of “Keitt” mangoes during storage at 13 ◦ C. N=~50; error to update weights for variables. During optimization soft shrinkage is
bars represent standard error of mean. imposed, in which less important variables are assigned smaller weights.
The algorithm runs iteratively and terminates when a variable is
smoothing filter (window size of 21 and the 2nd order polynomial). The selected. The optimal variables carrying low cross-validation error
correction to reduce the additive and multiplicative light scattering ef (RMSECV) are retained and a new calibration is established with the
fects was performed by estimating standard normal variates (SNV). retained variables. The BOSS was implemented in MATLAB (2018b,
Further, to reveal the underlying peaks the 2nd derivative was estimated Natick, MA, USA).
[15]. The same pre-processing process was applied to both the SCiO and
Zeiss data. Before feeding to the regression analysis, the spectra and the 3. Results
reference firmness values were mean centered. After the pre-processing
procedure, spectral data were again checked for outliers (PLS T2 and Q 3.1. Firmness of ripening mangoes
statistics plots) and deviated samples were excluded. For each batch,
spectra were divided as 70% for calibration and 30% for independent Mango firmness decreased over the ripening and storage period
testing. The partition of the spectra in calibration and testing datasets (Fig. 2). Batch 1 mangoes lost firmness faster in the first eight days of
were performed utilizing the Kennard-Stone (KS) algorithm [9]. storage, but this slowed down from day 8 onwards whereas firmness of
batch 2 and batch 3 mangoes dropped faster in the first four days and
2.4.1. Partial least square regression slowed down from day 4 onwards. After day 4, batch 2 and batch 3
NIRS data is made up of an overlapping mixture of underlying mangoes showed overlapping softening behavior.
spectral signatures. Such a spectral mixture makes the data highly
collinear and a multi-linear regression model will overfit [19]. However,
PLSR was developed to deal with such a scenario by identification of a 3.2. Spectral characteristics of mango and reference measurements
subset of latent variables (LVs) [11,23,33]. PLSR does that by selecting
variables that have maximum covariance with the response variables. In the case of the mean Zeiss spectrum (Fig. 3A), three main regions
Once, the LVs were identified PLSR runs a multi-linear regression to (408–670 nm, 670–990 nm and 990–1683 nm) can be identified. The
obtain the predictive model. In the present work, different PLSR models spectral region from 408 to 670 nm is representative of the peel color
were developed depending on the batches and the combination of [14]. The peak at around 600 nm is related to chlorophyll which
Fig. 3. Mean spectra of mango fruit. (A). Zeiss spectrophotometer, (B). Zeiss spectrophotometer response in spectral range of 740–1044 nm, and (C) SCiO.
3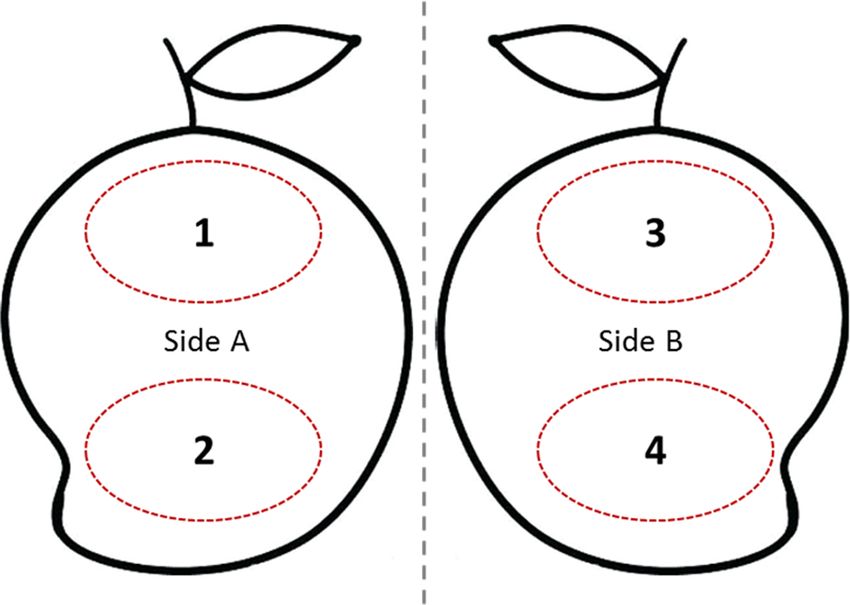
N.F.M. Kasim et al.                                                                                                      Infrared Physics and Technology 115 (2021) 103733

Table 1                                                                                (740–1044 nm) is also shown in Fig. 3B. A key point to note is that unlike
Mean and standard deviation of acoustic firmness. The samples were partitioned         SCiO continuous spectra (Fig. 3C), the Zeiss spectra in the SCiO range
into calibration and test set using the Kennard Stone (KS) sample partitioning.        (Fig. 3B) has discontinuity at ~ 980 nm. This discontinuity was due to
The outliers were removed prior to the KS sample partitioning.                         different detector used by the Zeiss spectrometer for spectral range >
  Batch           Calibration                      Test                                980 nm.
                  Mean (Hz2g2/   Standard          Mean        Standard                    A summary of acoustic firmness measurements is provided in
                  3
                   )             deviation         (Hz2g2/     deviation
                                                                                       Table 1. Spectral measurements with SCiO were done for two batches (1
                                 (Hz2g2/3)         3
                                                    )          (Hz2g2/3)
                                                                                       and 2); spectral measurements with Zeiss were done for all three batches
  Batch 1         41.88          22.06             42.33       22.52                   (1, 2 and 3). Batch 1 was harvested one week before batch 2 and 2 weeks
    SciO
                                                                                       before batch 3. Please note that although the Batch 1 and Batch 2
  Batch 2         36.06          17.29             34.45       17.10
    SciO                                                                               initially has same number of samples, but due to the several outlying
  Batch 1         30.83          17.27             32.15       17.82                   spectra in the Zeiss measurements, the total number of firm fruit was
    Zeiss                                                                              apparently lower for Zeiss compared to the SCiO. This is the reason why
  Batch 2         28.92          15.51             25.81       12.46
                                                                                       the firmness values for Batch 1 and Batch 2 (Table 1) with respect to
    Zeiss
  Batch 3         26.95          13.43             23.21       10.55                   Zeiss spectrophotometer were lower compared to the SCiO.
    Zeiss
                                                                                       3.3. PLSR and BOSS variable selection

degrades during fruit ripening [5]. The 3rd overtones spectral region                     In Figs. 4 and 5, the top row shows the models made on SCiO data,
(670–990 nm) is similar as shown for the SCiO’s mean spectrum.                         the mid row present the models made on Zeiss data in spectral range of
Further, the spectral region from 990 to 1683 nm captures the 1st and                  740 to 1070 nm (same as SCiO) and the bottom row shows the results of
the 2nd overtones of chemical bond vibrations [21]. In the mean SCiO                   modelling performed on the complete Zeiss data, i.e. 408–1683 nm.
spectrum (Fig. 3C), distinct features can be identified at 760, 810 and                SCiO PLS regression for batch 1 and batch 2 attained slightly higher R2P
970 nm which may correspond to the ArCH, CH3, RNH2 and H2O                             and lower RMSEP compared to the Zeiss PLS models for the similar
overtones [20]. The Zeiss spectra in the spectral range of SCiO                        spectral range (740 to 1070 nm). The PLS regression model for batch 1

Fig. 4. A summary of partial least-square regression (PLSR) models for SCiO and Zeiss data. PLSR models on SCiO data for batch 1 (A) and batch 2 (B). PLSR models
on reduced spectral range Zeiss data for batch 1 (C), batch 2 (D) and batch 3 (E). PLSR models on full spectral range Zeiss data for batch 1 (E), batch 2 (F) and batch
3 (G).

                                                                                   4
N.F.M. Kasim et al. Infrared Physics and Technology 115 (2021) 103733
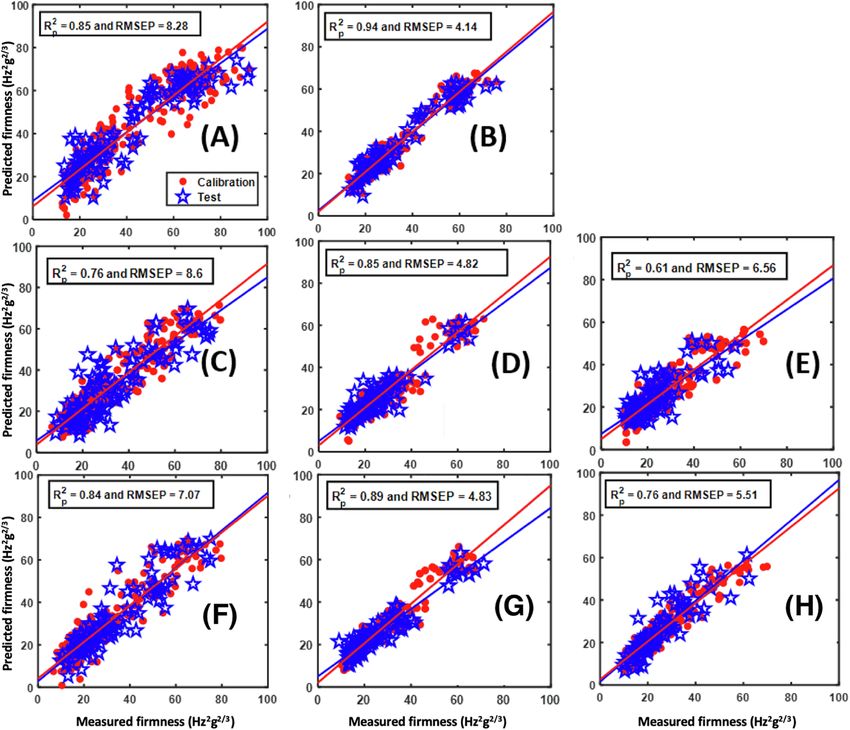
Fig. 5. A summary of models made on variables selected with bootstrapping soft shrinkage (BOSS) approach for SCiO and Zeiss data. PLSR models on SCiO data for
batch 1 (A) and batch 2 (B). PLSR models on reduced spectral range Zeiss data for batch 1 (C), batch 2 (D) and batch 3 (E). PLSR models on full spectral range Zeiss
data for batch 1 (F), batch 2 (G) and batch 3 (H).
made with complete spectral range of Zeiss attained a lower RMSEP compared to the PLSR. For both the sensors i.e. SCiO and Zeiss,
(Fig. 4E), indicating useful information in the extended wavelength reasonable performances were obtained with the global models (based
range for firmness predictions. For batch 2, the SCiO PLS regression on data from 3 fruit batches in the case of measurements with Zeiss and
model attained a higher R2P and lower RMSEP (Fig. 4B) compared to the based on 2 fruit batches in the case of measurements with SCiO) indi
model made on complete spectral range of Zeiss data (Fig. 4F). For batch cating that in commercial practice global firmness models should be
3, no measurements with SCiO were taken. The PLS regression models preferred rather than batch specific models. Table 3 provides a summary
for batch 1–3 made with complete spectral range of Zeiss attained a of the key wavelengths selected by the BOSS for global models.
lower RMSEP (Fig. 4E,F,G) compared to the reduced spectral range
(Fig. 4C,D,E). 4. Discussion
The variable selection with BOSS showed similar performance to that
of the PLSR in most of the cases (Fig. 5). However, BOSS improved the In the present study, three batches of mango fruit were received from
model performance in the case of reduced wavelength Zeiss data model Spain. The difference between the three batches was that the fruit were
for batch 2 (Fig. 5D) and full spectral range Zeiss model for batch 3 harvested a one-week apart from each other from the same orchard.
(Fig. 5G). Fruit were transported to the Netherlands in a refrigerated truck at a
temperature of about 10–12 ◦ C, a temperature considered mostly
blocking the ripening. However, once arrived in the Netherlands, along
3.4. Inter-batch model performance the ripening, mango firmness further decreased. This rapid fall in
firmness led to a skewed firmness distribution with less measurement of
Table 2 provides an overview of the PLSR and BOSS models perfor hard fruit and more measurements of soft fruit. The effect of sudden
mance when calibrated and tested on different batches. In all the PLSR firmness decrease is also prominent in PLS analysis and especially in
models, optimal number of LVs reached up to 56 for global models made batches 2 and 3 where two separate clouds related to firmness can be
on complete spectral range Zeiss data. Both the PLSR and BOSS per seen (Fig. 4D and G). However, to deal with it, the KS algorithm was
formed poor when tested on a different batch. Although BOSS showed used to select well-distributed calibration and test sets. The KS algorithm
slightly improved predictive performance when tested on a new batch
5
N.F.M. Kasim et al. Infrared Physics and Technology 115 (2021) 103733
Table 2
Summary of the partial least-squares regression (PLSR) and bootstrapping soft shrinkage (BOSS) models when tested on different batches. The models showing lower
root mean squared error of prediction (RMSEP) with BOSS compared to PLSR are highlighted in red. Consider that the model showing even a slight improvement in
RMSEP are highlighted in red. LVs : Latent variables for PLS model.
PLSR BOSS
Model on Batch Tested on Batch LVs R2p RMSEP (Hz2g2/3) Number of wavelengths R2p RMSEP
(Hz2g2/3)
Batch 1 (Zeiss) 1 24 0.84 7.06 21 0.83 7.11
2 24 0.81 19.97 21 0.65 11.31
3 24 0.53 17.69 21 0.58 12.01
Batch 2 (Zeiss) 1 10 0.006 18.95 12 0.006 20.30
2 10 0.91 4.58 12 0.89 4.91
3 10 0.70 6.64 12 0.65 6.60
Batch 3 (Zeiss) 1 19 0.03 37.04 12 0.02 27.72
2 19 0.88 33.29 12 0.90 17.23
3 19 0.80 5.30 12 0.83 4.55
Global model (Zeiss) 1 56 0.83 7.27 15 0.77 8.34
2 56 0.88 5.01 15 0.89 4.78
3 56 0.74 5.91 15 0.72 5.96
Batch 1 (Reduced spectral range Zeiss) 1 23 0.77 8.60 10 0.75 8.94
2 23 0.11 18.52 10 0.11 17.87
3 23 0.28 10.01 10 0.28 11.91
Batch 2 (Reduced spectral range Zeiss) 1 10 0.001 21.32 11 0.001 21.98
2 10 0.85 4.82 11 0.85 4.75
3 10 0.56 7.19 11 0.58 6.81
Batch 3 (Reduced spectral range Zeiss) 1 18 0.14 27.71 10 0.41 13.59
2 18 0.09 16.80 10 0.41 9.53
3 18 0.64 6.56 10 0.53 7.17
Global model (Reduced spectral range Zeiss) 1 37 0.80 8.11 10 0.75 8.83
2 37 0.82 5.31 10 0.79 5.71
3 37 0.56 7.36 10 0.74 7.28
Batch 1 (SCiO) 1 8 0.86 8.27 25 0.85 8.42
2 8 0.88 6.09 25 0.86 6.30
Batch 2 (SCiO) 1 10 0.77 11.31 19 0.73 11.19
2 10 0.94 4.06 19 0.93 4.32
Global model (SCiO) 1 11 0.85 8.28 24 0.85 8.35
2 11 0.93 4.84 24 0.92 4.87
this study, the variable selection with BOSS performed better (lower
Table 3
RMSEP) compared to the standard PLSR modeling for most of the batch-
A summary of selected wavelengths by the bootstrapping soft shrinkage
specific and global models (Table 2). R2p were comparable to a similar
approach.
study performed by [22] where the R2pred was in the range of 0.82–0.90.
Sensing technique Wavelengths (nm) Total
However, a direct comparison with the study [22] is not possible
Zeiss full 515, 700, 782, 833, 889, 1142, 1293, 1336, 1344, 15 because the reference firmness analysis was performed with penetrom
1383, 1391, 1469, 1482, 1623, 1632 eter compared to non-destructive acoustic firmness analysis performed
Zeiss reduced 829, 876, 932, 949, 953, 966, 970, 975, 979, 983 10
spectral range
in this study. Penetrometer measures the actual force by destructively
SCIO 748, 759, 771, 786, 788, 797, 818, 828, 829, 830, 24 sampling the fruit, thus, it can provide an estimate of fruit flesh firmness;
831, 858, 903, 904, 910, 912, 928, 941, 974, 975, the acoustic-based non-destructive measurements estimates the global
976, 1038, 1044,1046 fruit stiffness that is more comparable to firmness as sensed by human
touch [13]. Under conditions in commercial practice, a non-destructive
firmness measurement is preferred as it limits the loss of fruit due to
efficiently selects the representative samples utilizing the inter-sample
regular testing in the chain. In addition, it allows regular testing of same
distance matrix [9].
(selected) fruit during the ripening process to monitor the progress.
VNIRS data is made up of highly overlapping peaks corresponding to
The main benefit of pocket-size sensor is their lower cost, high
underlying chemical constituents. To extract the underlying chemical
portability and ease of use. In this study, the SCiO performance was
constituents that correlate the most with the property of interest, latent
slightly better in terms of higher R2pred compared to the Zeiss spectro
variables-based methods such as PLSR are commonly used [23]. How
photometer (batch 1 and 2), however, the RMSEP was lower for the Zeiss
ever, sometimes deciding on the number of LVs can be difficult when the
spectrophotometer. A low error with the laboratory-based instrument
property of interest is not chemical, as no clear peaks corresponding to
could be due to broader spectral range captured, covering the 1st, 2nd
C-H, O-H or N-H overtones can be identified by the PLSR. In this study,
and 3rd overtones of the C-H, O-H and N-H bonds and also the color
spectral data was used to predict the firmness which does not correspond
information which was absent in SCiO. The SCiO captured only the
to any single chemical or physical property of the fruit, rather is a
740–1070 nm range which only explains 3rd overtones of bonds. The
complex mixture of physical and chemical changes. As a result, the
variables selected for the SCiO and the Zeiss spectrophotometer data
optimal number of LVs selected after the cross-validation was high for
have several wavelengths in common such as ~ 786 nm, ~830 nm,
both the SCiO and Zeiss sensor (Table 2). Furthermore, the PLS models
~979 nm. Selected bands also match with those found in a study related
selected different numbers of LVs for different batches highlighting that
to firmness prediction in apples by [30] and mango fruit [28]. Another
apart for the common variability related to the firmness in all the
key point to note is that the measurements performed with Zeiss using
batches, there is within batch variability which is linked to the firmness
the optical fiber assembly were found to have a large number outliers
(Table 2).
compared to the SCiO. A reason for such a better samples acquisition by
Variable selection may improve the modeling by removing the
SCiO could be due to the sample cover attached in the sensing head of
redundant variables thus retaining the most predictive variables [36]. In
6N.F.M. Kasim et al. Infrared Physics and Technology 115 (2021) 103733
SCIO to compensate for any outside interference during the measure [8] S.N. Jha, K. Narsaiah, P. Jaiswal, R. Bhardwaj, M. Gupta, R. Kumar, R. Sharma,
Nondestructive prediction of maturity of mango using near infrared spectroscopy,
ments. Such a cover or assembly was absent in case of measurements
J. Food Eng. 124 (2014) 152–157.
performed with the lab-based Zeiss instrument. [9] R.W. Kennard, L.A. Stone, Computer Aided Design of Experiments, Technometrics
11 (1969) 137–148.
[10] M. Li, Z.Q. Qian, B.W. Shi, J. Medlicott, A. East, Evaluating the performance of a
5. Conclusions consumer scale SCiO (TM) molecular sensor to predict quality of horticultural
products, Postharvest Biol. Technol. 145 (2018) 183–192.
This study compared performance of two spectrophotometers to [11] R.F. Lu, R. Van Beers, W. Saeys, C.Y. Li, H.Y. Cen, Measurement of optical
properties of fruits and vegetables: A review, Postharvest Biol. Technol. 159
predict mango firmness i.e. a laboratory-based instrument operating in (2020).
spectral range of 305–1713 nm and a portable spectrophotometer SCiO [12] M.E. Maldonado-Celis, E.M. Yahia, R. Bedoya, P. Landazuri, N. Loango, J. Aguillon,
740–1070 nm. PLSR models were developed to compare the predictive B. Restrepo, J.C.G. Ospina, Chemical Composition of Mango (Mangifera indica L.)
Fruit: Nutritional and Phytochemical Compounds. Frontiers, Plant Sci. 10 (2019).
performance of mango firmness models. Furthermore, variable selection [13] F. Mendoza, R.F. Lu, H.Y. Cen, Comparison and fusion of four nondestructive
was performed to identify the key wavelengths important for explaining sensors for predicting apple fruit firmness and soluble solids content, Postharvest
mango firmness. The results showed that the SCiO performed similar to Biol. Technol. 73 (2012) 89–98.
[14] P. Mishra, M.S.M. Asaari, A. Herrero-Langreo, S. Lohumi, B. Diezma,
the laboratory-based instrument in terms of R2p, however, the RMSEP
P. Scheunders, Close range hyperspectral imaging of plants: A review, Biosyst. Eng.
for the SCiO was slightly higher than the laboratory-based instrument. 164 (2017) 49–67.
The SCiO model performance with and without variable selection was [15] P. Mishra, A. Biancolillo, J.M. Roger, F. Marini, D.N. Rutledge, New data
preprocessing trends based on ensemble of multiple preprocessing techniques,
similar. The batch-specific models performed poorly when tested in a
TrAC, Trends Anal. Chem. (2020), 116045.
new batch for both the SCiO and Zeiss spectrophotometer. A good model [16] P. Mishra, S. Lohumi, H. Ahmad Khan, A. Nordon, Close-range hyperspectral
performance was observed with global models for both SCiO and Zeiss imaging of whole plants for digital phenotyping: Recent applications and
spectrophotometer. The use of global models is recommended for illumination correction approaches, Comput. Electron. Agric. 178 (2020), 105780.
[17] P. Mishra, E. Woltering, N. El Harchioui, Improved prediction of ‘Kent’ mango
firmness prediction in mango fruit. A portable sensor like SCiO can firmness during ripening by near-infrared spectroscopy supported by interval
support the non-destructive prediction of mango firmness. Rapid esti partial least square regression, Infrared Phys. Technol. 110 (2020), 103459.
mation of firmness with portable sensors can support in optimizing the [18] J.P.D. Neto, M.W.D. de Assis, I.P. Casagrande, L.C. Cunha, G.H.D. Teixeira,
Determination of ’Palmer’ mango maturity indices using portable near infrared
ripening protocols of mango fruit, thus, improving the whole supply (VIS-NIR) spectrometer, Postharvest Biol. Technol. 130 (2017) 75–80.
chain. Higher R2p were obtained for models made on SCiO data [19] B.M. Nicolai, K. Beullens, E. Bobelyn, A. Peirs, W. Saeys, K.I. Theron,
compared to that of Zeiss spectrophotometer data, however, solely J. Lammertyn, Nondestructive measurement of fruit and vegetable quality by
means of NIR spectroscopy: A review, Postharvest Biol. Technol. 46 (2007)
based on the model performance this study does not conclude that SCiO 99–118.
is a better sensor than Zeiss spectrophotometer. However, when better [20] Osborne, B.G. (2006). Near-Infrared Spectroscopy in Food Analysis. In,
model performance is combined with factors such as portability, Encyclopedia of Analytical Chemistry.
[21] B.G. Osborne, T. Fearn, P.H. Hindle, Practical NIR spectroscopy with applications
extremely lower cost, ease-to-use, compatibility to mobile phone and a
in food and beverage analysis, Longman scientific and technical, 1993.
connected cloud framework, then the SCiO can be considered as a better [22] P. Rungpichayapicheta, B. Mahayothee, M. Nagle, P. Khuwijitjaru, J. Mullera,
alternative to traditional laboratory-based spectrophotometers. Robust NIRS models for non-destructive prediction of postharvest fruit ripeness
and quality in mango, Postharvest Biol. Technol. 111 (2016) 31–40.
[23] W. Saeys, N.N. Do Trong, R. Van Beers, B.M. Nicolai, Multivariate calibration of
spectroscopic sensors for postharvest quality evaluation: A review, Postharvest
Declaration of Competing Interest Biol. Technol. 158 (2019).
[24] A. Savitzky, M.J.E. Golay, Smoothing and Differentiation of Data by Simplified
Least Squares Procedures, Anal. Chem. 36 (1964) 1627–1639.
The authors declare that they have no known competing financial [25] R.E. Schouten, S. Fan, J.C. Verdonk, Y.C. Wang, N.F.M. Kasim, E.J. Woltering, L.M.
interests or personal relationships that could have appeared to influence M. Tijskens, Mango Firmness Modeling as Affected by Transport and Ethylene
the work reported in this paper. Treatments, Frontiers Plant Sci. 9 (2018).
[26] P.P. Subedi, K.B. Walsh, Assessment of avocado fruit dry matter content using
portable near infrared spectroscopy: Method and instrumentation optimisation,
Acknowledgements Postharvest Biol. Technol. 161 (2020).
[27] X.D. Sun, P. Subedi, K.B. Walsh, Achieving robustness to temperature change of a
NIRS-PLSR model for intact mango fruit dry matter content, Postharvest Biol.
This research was supported by the Wageningen University & Technol. 162 (2020).
Research knowledge base program ‘Data Driven & High Tech’. [28] M. Valente, R. Leardi, G. Self, G. Luciano, J.P. Pain, Multivariate calibration of
mango firmness using vis/NIR spectroscopy and acoustic impulse method, J. Food
Eng. 94 (2009) 7–13.
References [29] M. Valente, F. Ribeyre, G.U.Y. Self, L. Berthiot, S. Assemat, Instrumental and
sensory charaterization of mango fruit texture, J. Food Qual. 34 (2011) 413–424.
[1] R.A. Crocombe, Portable Spectroscopy, Appl. Spectrosc. 72 (2018) 1701–1751. [30] C. Valero, M. Ruiz-Altisent, R. Cubeddu, A. Pifferi, P. Taroni, A. Torricelli,
[2] B.-C. Deng, Y.-H. Yun, D.-S. Cao, Y.-L. Yin, W.-T. Wang, H.-M. Lu, Q.-Y. Luo, Y.- G. Valentini, D. Johnson, C. Dover, Selection Models for the Internal Quality of
Z. Liang, A bootstrapping soft shrinkage approach for variable selection in Fruit, based on Time Domain Laser Reflectance Spectroscopy, Biosyst. Eng. 88
chemical modeling, Anal. Chim. Acta 908 (2016) 63–74. (2004) 313–323.
[3] C.A.T. dos Santos, M. Lopo, R.N.M.J. Pascoa, J.A. Lopes, A Review on the [31] H.L. Wang, J.Y. Peng, C.Q. Xie, Y.D. Bao, Y. He, Fruit Quality Evaluation Using
Applications of Portable Near-Infrared Spectrometers in the Agro-Food Industry, Spectroscopy Technology: A Review, Sensors 15 (2015) 11889–11927.
Appl. Spectrosc. 67 (2013) 1215–1233. [32] F. Westad, F. Marini, Validation of chemometric models – A tutorial, Anal. Chim.
[4] P.P.S. Gill, S.K. Jawandha, N. Kaur, N. Singh, Physico-chemical changes during Acta 893 (2015) 14–24.
progressive ripening of mango (Mangifera indica L.) cv. Dashehari under different [33] S. Wold, M. Sjostrom, L. Eriksson, PLS-regression: a basic tool of chemometrics,
temperature regimes, J. Food Sci. Technology-Mysore 54 (2017) 1964–1970. Chemometrics Intelligent Laboratory Systems 58 (2001) 109–130.
[5] A. Gitelson, M.N. Merzlyak, Quantitative estimation of chlorophyll-a using [34] H.M. Yashoda, T.N. Prabha, R.N. Tharanathan, Mango ripening-chemical and
reflectance spectra: Experiments with autumn chestnut and maple leaves, structural characterization of pectic and hemicellulosic polysaccharides,
J. Photochem. Photobiol., B 22 (1994) 247–252. Carbohydr. Res. 340 (2005) 1335–1342.
[6] Y. Huang, R. Lu, K. Chen, Prediction of firmness parameters of tomatoes by [35] H.M. Yashoda, T.N. Prabha, R.N. Tharanathan, Mango ripening: changes in cell
portable visible and near-infrared spectroscopy, J. Food Eng. 222 (2018) 185–198. wall constituents in relation to textural softening, J. Sci. Food Agric. 86 (2006)
[7] P.J. Jackson, F.R. Harker, Changes in firmness of the outer pericarp, inner pericarp, 713–721.
and core of Actinidia species during ripening, N. Z. J. Crop Hortic. Sci. 25 (1997) [36] X.B. Zou, J.W. Zhao, M.J.W. Povey, M. Holmes, H.P. Mao, Variables selection
185–189. methods in near-infrared spectroscopy, Anal. Chim. Acta 667 (2010) 14–32.
7You can also read