Mapping Poverty in the Philippines Using Machine Learning, Satellite Imagery, and Crowd-sourced Geospatial Information
←
→
Page content transcription
If your browser does not render page correctly, please read the page content below
Mapping Poverty in the Philippines Using Machine Learning, Satellite Imagery,
                    and Crowd-sourced Geospatial Information
                Isabelle Tingzon1∗ , Ardie Orden1 , Stephanie Sy1 , Vedran Sekara2 , Ingmar
                Weber3 , Masoomali Fatehkia3 , Manuel Garcia Herranz2 and Dohyung Kim2
                                          1
                                            Thinking Machines Data Science
                                                 2
                                                   UNICEF Innovation
                                        3
                                          Qatar Computing Research Institute
                    {issa, ardie, stef}@thinkingmachin.es, {iweber, mfatehkia}@hbku.edu.qa,
                                    {vsekara, mgarciaherranz, dokim}@unicef.org

                               Abstract                           USD. Such surveys are done only every 3 to 5 years and
                                                                  are often aggregated to the regional or provincial level when
        Mapping the distribution of poverty in develop-           reported to the public [Juan-Albacea, 2009]. Without more
        ing countries is essential for humanitarian orga-         granular and up-to-date data to guide their policies and pro-
        nizations and policymakers to formulate targeted          grams, development organizations and government agencies
        programs and aid. However, traditional meth-              risk allocating their limited resources in the wrong areas.
        ods for obtaining socioeconomic data can be time-            In recent years, major advancements in computer vision re-
        consuming, expensive, and labor-intensive. Re-            search and an increasing availability of geospatial resources
        cent studies have demonstrated the effectiveness          have enabled novel methods for estimating socioeconomic in-
        of combining machine learning with satellite im-          dicators [Jean et al., 2016; Babenko et al., 2017; Engstrom
        ages to estimate wealth in sub-Saharan African            et al., 2017]. To tackle the problem of poverty eradication,
        countries [Xie et al., 2015; Jean et al., 2016]. In       we look towards combining machine learning with geospatial
        this study, we investigate the extent to which this       information as a fast, low-cost, and scalable means of pro-
        method can be applied in the context of the Philip-       viding granular poverty estimates. In this study, we examine
        pine archipelago to predict four different socioe-        the extent to which geospatial data including nighttime lights,
        conomic indicators: wealth level, years of educa-         daytime satellite imagery, human settlement data, and crowd-
        tion, access to electricity, and access to water. We      sourced information can be used to estimate socioeconomic
        also propose a cost-effective approach that lever-        well-being in the Philippines.
        ages a combination of volunteered geographic in-             To summarize, our work primarily seeks to answer the fol-
        formation from OpenStreetMap (OSM) and night-             lowing questions: (1) Are satellite-based methods developed
        time lights satellite imagery for estimating socioe-      for poverty prediction in other countries applicable within the
        conomic indicators. The best models, which in-            Philippine context? and (2) How well do predictive models
        corporate regional indicators as predictors, explain      trained on publicly available crowd-sourced geospatial infor-
        approximately 63% of the variation in asset-based         mation compare against state-of-the-art satellite-based meth-
        wealth. Our findings also indicate that models            ods for Philippine poverty estimation?
        trained on publicly available, volunteer-curated ge-
        ographic data achieve the same predictive perfor-
        mance as that of models trained using proprietary         2     Data and Pre-processing
        satellite images.                                         In this section, we describe the five different data sources and
                                                                  pre-processing steps done in this study. The datasets are sum-
1       Introduction                                              marized in Table 1.
Despite best efforts in implementing poverty alleviation pro-     2.1    Demographic and Health Survey
grams, the Philippines still lags behind its Southeast Asian
neighbors in terms of poverty eradication, with approxi-          We used the 2017 Philippine Demographic and Health Sur-
mately 22 million Filipinos living below the national poverty     vey (DHS) as a measure of ground truth for the socioeco-
line [Philippine Statistics Authority PSA, 2018]. A major         nomic indicators. Conducted every 3 to 5 years, the Philip-
challenge in fighting poverty today is the lack of reliable so-   pine Statistical Authority (PSA) collects nationally represen-
cioeconomic data, which is often expensive, time-consuming,       tative information on social, economic, and health-related
and labor-intensive to collect. Conducting on-the-ground          outcomes across hundreds of households, which are grouped
household surveys in the Philippines can cost up to 1.5M          into clusters of 2 to 44 households [Philippine Statistics Au-
                                                                  thority PSA, 2018; Burgert et al., 2013]. In line with the Sus-
    ∗
        Corresponding author                                      tainable Development Goals, we focused our analysis on a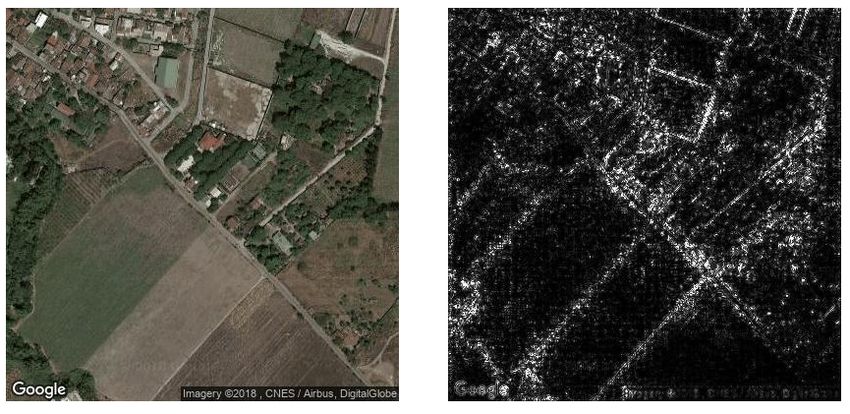
Table 1: Primary datasets used in this study             intensity values into the following five distinct classes: low
                                                                    intensity (zero pixel values), moderately low intensity (0.05-
 Demographic and Health Survey (DHS)                                2), medium intensity (2-15), moderately high intensity (15-
Year Collected                                    2017              30), and high intensity (30-122).
No. of Clusters                                   1,213
No. of Households                                27,496             2.3   Daytime Satellite Imagery
                                                                    We retrieved a number of satellite images per cluster based on
 Nighttime Lights Data (Source: VIIRS DNB)
                                                                    the cluster centroids reported in the DHS dataset, where each
Year Collected                                    2016              cluster location is defined by the mean latitude and longitude
Number of 0.25 km2 pixels                        134,540            of the households, with added noise to preserve the privacy of
 Daytime Satellite Imagery (Source: Google Static Maps API)         the households [Philippine Statistics Authority PSA, 2018].
                                                                    Each cluster location is also labeled with a tag that indicates
Year Collected                                    2018              whether it is within a rural or urban area. We obtained up
No. of images in training set                    150,000            to 400 square tiles of satellite images within a 5 km radius
No. of images in validation set                  13,454             for rural areas and up to 60 square tiles within a 2 km radius
 Human Settlement Data (Source: Facebook Research)                  for urban areas. These tiles surround each cluster centroid
                                                                    and each tile corresponds to a pixel in the VIIRS DNB NTL
Year Collected                                     2017             dataset. Using Google Static Maps API, we downloaded a
 OpenStreetMap Data (Source: Geofabrik)                             total of 134,540 images with a zoom level of 17, scale of
                                                                    1, and pixel resolution of approximately 1.25 m. The size of
Year Collected                                     2018             each image is 400×400 pixels and matches the 0.25 km2 land
No. of road features                                 16             area covered by a single pixel of night time lights data.
No. of building features                             28
No. of POI features                                 101             2.4   High Resolution Settlement Data
                                                                    The High Resolution Settlement Layer dataset [Tiecke et al.,
subset of survey questions and derived the following socioe-        2017] was used to filter out satellite images that contained
conomic indicators from the DHS dataset:                            no human settlements. The dataset provides estimates of hu-
   Wealth Index. Our primary measure of socioeconomic               man population distribution at a resolution of 1 arc-second
well-being is the “wealth index”, which is computed as the          (30 m). The population estimates were based on recent cen-
first principal component of attributes related to common as-       sus data and high resolution satellite imagery (0.5 m) from
set ownership (e.g., roof material, television, housing mate-       DigitalGlobe. Using building footprints as a proxy for human
rial) on a per-household level. We get the mean wealth index        settlements, [Tiecke et al., 2017] developed a CNN model to
per cluster as it is reported in the DHS dataset and do no fur-     detect buildings from satellite images; population estimates
ther transformations.                                               were then assigned using proportional allocation over a wide
   Education completed. The DHS captures information on             coverage area, encompassing both urban and rural areas.
the number of years of education completed by household
members over 6 years old. We aggregated this by computing           2.5   OpenStreetMap Data
the mean years of education completed across all households         More and more researchers are turning to volunteer-curated
per cluster.                                                        geographic information and open geospatial datasets to study
   Access to Electricity. The DHS dataset contains infor-           socioeconomic development, social inequalities, and territo-
mation on the number of affirmative responses to the sur-           rial conflicts [Gervasoni et al., 2018; Mahabir et al., 2018;
vey question related to access to electricity. We aggregated        Grippa et al., 2018]. One of the more popular geospatial
this information by getting the proportion of households with       data crowd-sourcing platforms is OpenStreetMap (OSM), a
electricity access per cluster.                                     global geospatial database containing billions of entries of
   Access to Water. The DHS dataset contains information on         volunteered geographic information, maintained by a massive
the total travel time in minutes to get to a water source. If wa-   community of mappers from around the world all working to-
ter source is on-site, time is set to zero. We get the mean time    wards the goal of curating accurate and complete geospatial
to access a water source across all households per cluster.         data.
                                                                       The community of OSM contributors typically consists of
2.2   Nighttime Luminosity Data                                     individual mappers, university researchers, volunteer com-
The nighttime lights (NTL) data is taken from the Visible           munities, and non-profit organizations, such as the Humani-
Infrared Imaging Radiometer Suite Day/Night Band (VIIRS             tarian OpenStreetMap Team (HOT). Such organizations regu-
DNB) for the year 2016, produced in 15 arc-second geo-              larly organize field mapping activities, workshops, and events
graphic grids [NOAA National Centers for Environmental In-          that promote geospatial data mapping and contribution. In
formation, 2016]. The VIIRS DNB NTL data includes a con-            recent years, large corporations such as Facebook, Amazon,
tinuous luminosity level from 0 to 122 for the Philippines,         and Microsoft as well transportation network companies like
with 0 being the darkest pixel. By observing the histogram of       Grab and Uber have also been making major contributions to
the nighttime light intensities, we assigned the nighttime light    OSM [Anderson et al., 2019]. Given massive computational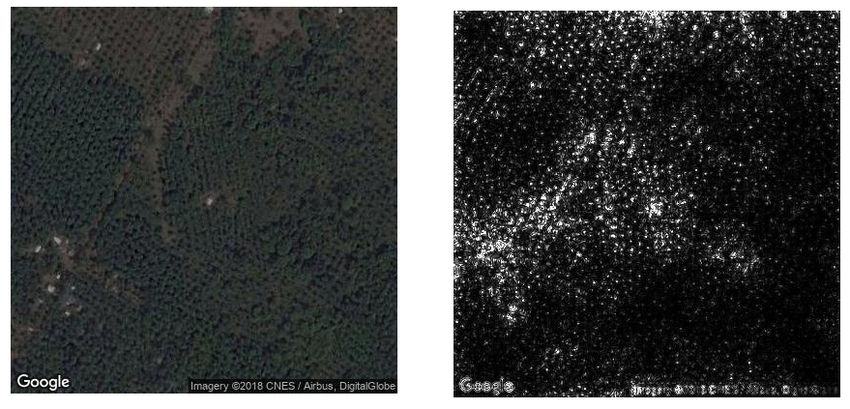
resources, private corporations are able to use computer vi-      to plateau. We froze most of the layers, tuning only the last
sion with satellite imagery to identify and map large-scale       block of fully convolutional layers. At the end of training,
road networks. In fact, a recent study has found that user-       we were able to achieve a 72% validation accuracy and 60%
generated road maps in OSM are approximately 83% com-             validation F1 score for the classification task.
plete as of 2016, with over 40% of countries having a fully          For each image, we extract a 4,096-dimensional vector
mapped street network [Barrington-Leigh and Millard-Ball,         of activations in the top layer of the CNN, which are opti-
2017]. Meanwhile, non-corporate mappers are more active           mized to distinguish between different levels of night light
contributors of building and point-of-interest data, which are    luminosity. Each cluster has up to 400 images that we
typically more difficult to distinguish using satellite imagery   convert to feature vectors of learned representations; these
and are thus more accurately mapped using local domain            feature vectors are then averaged into a single vector. Fi-
knowledge and on-the-ground field surveys.                        nally, we used these cluster-level feature vectors as input
   In this study, we obtained OpenStreetMap (OSM) data for        to a secondary regression model to predict the socioeco-
the Philippines from Geofabrik, an online repository for OSM      nomic indicators. As in previous studies [Jean et al., 2016;
data [Geofabrik GmbH, 2018]. From this, we were able to           Head et al., 2017], we used a ridge regression model to learn
extract information related to the number of roads, buildings,    the mapping from cluster-level feature vectors to socioeco-
and points of interests present within specified areas.           nomic indicators.

3     Methods
In this section, we describe the different methods used in pre-
                                                                  4   OpenStreetMap Model
dicting socioeconomic well-being. All models were evalu-
ated using a five-fold nested cross validation scheme.            For each cluster, we extracted three types of OSM features,
                                                                  namely roads, buildings, and points of interest (POIs). These
3.1    Satellite-based Transfer Learning Model                    OSM features were extracted within a 5 km radius for rural
                                                                  areas and 2 km radius for urban areas, with each area centered
We implemented the satellite-based deep learning approach         on the cluster locations. We identified five types of roads in
proposed by [Xie et al., 2015] and later improved upon by         the dataset: primary, trunk, paved, unpaved, and intersection.
[Jean et al., 2016], with the assumption that nighttime lights    For road feature engineering, we followed the pre-processing
act as a good proxy for economic activity [Mellander et al.,      technique described by Zhao and Kusumaputri, i.e., for each
2015]. As in [Head et al., 2017]., we began by fine-tuning        type of road, we calculated the distance to the closest road,
a convolutional neural network (CNN) with VGG16 archi-            total number of roads, and total road length per cluster [Zhao
tecture that has been pre-trained on the ImageNet dataset         and Kusumaputri, 2016].
to recognize 1000 different class labels [Krizhevsky et al.,
2012], with the goal of learning features that are useful for        We also identified six different types of buildings: residen-
poverty prediction. We treat the problem as a classification      tial, damaged, commercial, industrial, education, health. For
task with five (5) night time intensity classes: low, moder-      each type, we calculated the total number of buildings, the
ately low, medium, moderately high, and high. We set aside        total area of buildings, the mean area of buildings, and the
90% of the images for training and used the remaining 10%         proportion of the cluster area occupied by the buildings. Fi-
for the validation set. We dealt with the class imbalance by      nally, we identified over 100 different points of interests; for
upsampling the minority classes (high, moderately high, and       each cluster, we obtained the total number of each POI within
medium nighttime light intensities) and downsampling the          a proximity of the area, e.g., number of banks, bars, cinemas,
low and moderately low light intensity classes to 30,000 im-      colleges, hotels, parks, etc.
ages per class in order for all five classes to have the same        We compared the performances of random forest regres-
number of training examples.                                      sion models trained on the different types of OSM features,
   Like most models pretrained on ImageNet, the VGG16             both separately and combined, for predicting socioeconomic
model accepts 224×224 pixel images; meanwhile, our input          well-being. Furthermore, we also conducted a series of ex-
images are 400×400 pixels. We proceeded to implement a            periments to determine the predictive performance of models
fully convolutional architecture as described by [Xie et al.,     trained using multiple data sources, with the hypothesis that
2015], which involves replacing the fully-connected top lay-      using features from mixed data sources will bolster model
ers from the VGG16 model with randomly initialized fully          performance. Specifically, we trained random forest regres-
convolutional top layers. This allows the model to accept         sion models using a combination of OSM data and nighttime
input images of arbitrary sizes without losing information,       lights-derived features as input. Nighttime light features con-
unlike other techniques such as random cropping and scal-         sist of summary statistics and histogram-based features, in-
ing. Next, we augmented the training set using random hori-       cluding the mean, median, maximum, minimum, covariance,
zontal mirroring, and used 50% dropout on the convolutional       skewness, and kurtosis, of the nightlight luminosity pixels
layers replacing the fully connected layers. We then began        within each cluster.
fine-tuning the full network using an Adam optimizer with an         To our knowledge, this is the first paper to study multi-
initial learning rate of 10−6 and a batch size of 32. We set      dimensional poverty prediction using a combination of
the maximum number of epochs to 30, decreasing the learn-         crowd-sourced geospatial data and satellite data in the unique
ing rate by a factor of 10 whenever the validation loss began     context of a developing nation in Southeast Asia.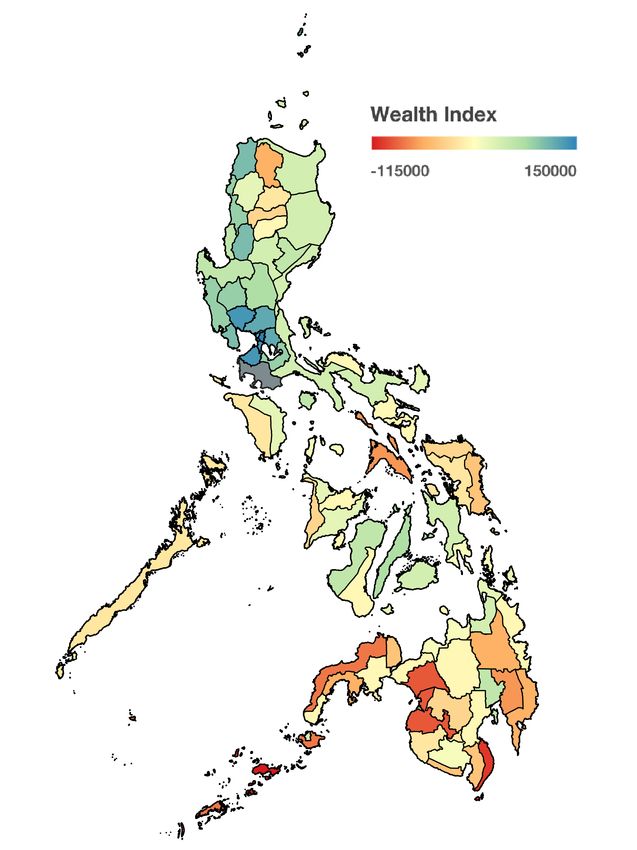
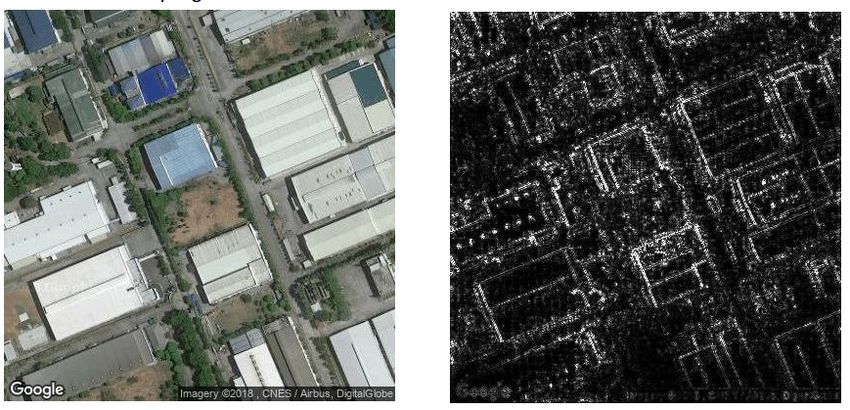
(a) Low Nighttime Light Intensity Class
(a) Ground Truth Wealth Index (b) Predicted Wealth Index
Figure 1: Ground-truth wealth indices and cross-validated Philip-
pine poverty predictions using the satellite-based transfer learning
(b) Medium Nighttime Light Intensity Class
model aggregated to the provincial level.
5 Results and Discussion
5.1 Poverty Prediction using Satellite Imagery and
Transfer Learning
Past studies have published results on using deep learning
methods for predicting wealth in sub-Saharan African coun-
tries [Jean et al., 2016] as well as non-African countries
[Head et al., 2017]. Predictive models achieved r-squared (c) Moderately High Nighttime Light Intensity
results ranging from 0.51 to 0.75 (Haiti: 0.51; Malawi: 0.55; Class
Tanzania: 0.57; Nepal: 0.64 Nigeria: 0.68; Uganda: 0.69;
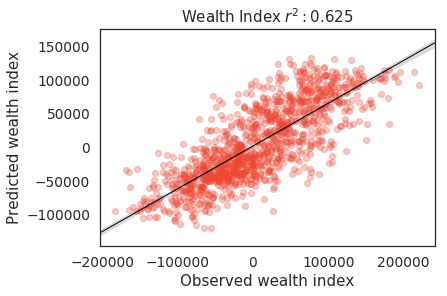
Rwanda: 0.75). In this study, we tested how well the satellite- Figure 2: Class saliency maps for test satellite images in the night-
based deep learning approach performs in the Philippine set- time light classification task. Maps were generated using a single
ting. back-propagation pass through the trained CNN.
Note that the Philippines, being an archipelago that con-
sists of over 7,000 islands, required additional pre-processing [Simonyan et al., 2013]. The image-specific saliency is com-
steps in order to reduce noise in the dataset. Specifically, we puted by getting the magnitude of the class score derivative,
removed satellite images with centroids located in bodies of which indicates the weight of each pixel in affecting the class
water as well as images containing no human settlements us- score. We see in Figure 2 that the model identifies pixels
ing the High Resolution Settlement Layer (HRSL) developed related to roads and buildings as important for classifying
by [Tiecke et al., 2017]; by doing so we were able to see a no- medium to high nighttime light intensity; whereas, pixels re-
table rise in the r-squared score from 0.56 to 0.59 for wealth lated to trees and crops are given more weight for low night-
prediction. By increasing the number of nighttime light bins time light intensity classes.
from the standard 3 to 5 and incorporating binary regional
indicators as predictors, we were able to further improve the 5.2 Poverty Prediction using Crowd-sourced
wealth index r-squared score to 0.63. As proof of concept, we Geospatial Information
show in Figure 1 a reconstruction of provincial-level poverty
maps by aggregating cluster-level wealth estimates. We trained separate random forest regression models for each
Our findings also indicate that the method does not gener- type of OSM feature (road, building, or POI). We found that
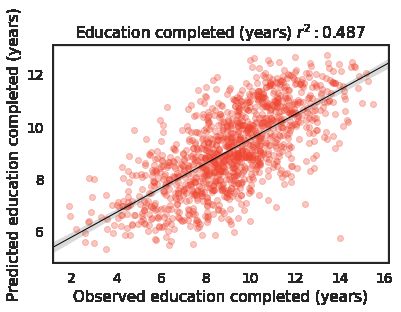
alize for other socioeconomic indicators with the same accu- using roads, buildings, or points of interests alone already
racy as wealth in terms of r-squared (education: 0.47, access explain 49-55% of the variance, with roads being the best
to electricity: 0.27, access to water: 0.10). We note that these predictor (R2 = 0.55). Training a model on all three types
results are consistent with the conclusions reached in [Head of OSM features results in a higher r-squared (0.59). Fur-
et al., 2017], which states that high model performance can- thermore, by combining OSM features with nighttime lights
not be expected when there is no clear relationship between data and binary regional indicators, we were able to obtain
the development indicator and nighttime lights. an r-squared of 0.63 for wealth prediction. The r-squared re-
sults for education, electricity access, water access are 0.49,
Visualizing Nighttime Light Classification Model 0.36, and 0.09, respectively. Since our poverty prediction
To visualize the nighttime light classification model, we gen- approach was optimized for predicting asset-based wealth, a
erate class saliency maps based on a given image and class more indicator-specific feature engineering and feature selec-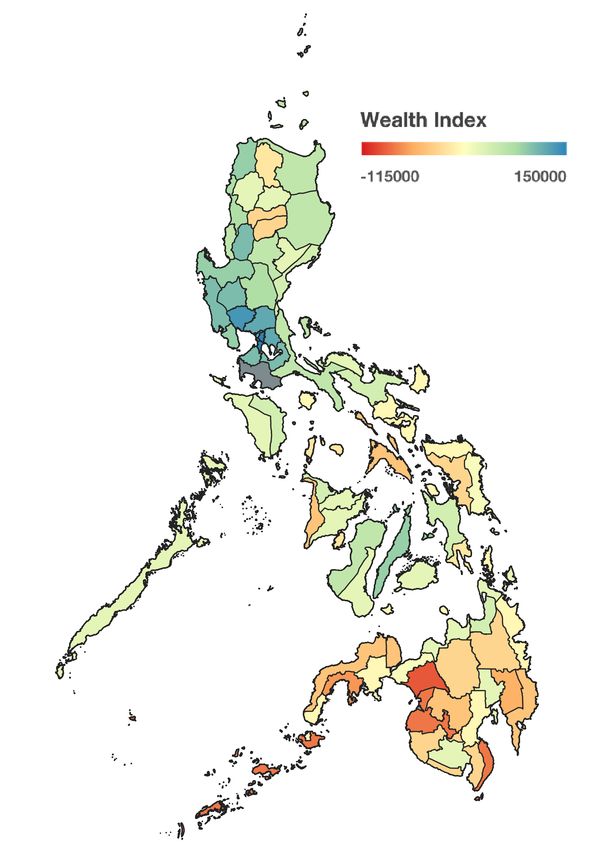
(a) Wealth Index                     (b) Education                 (c) Electricity Access               (d) Water Access

    Figure 3: Ground-truth wealth index and cross-validated Philippine poverty predictions using the satellite-based deep learning model.

          (a) Wealth Index                     (b) Education                 (c) Electricity Access               (d) Water Access

          Figure 4: Ground-truth wealth index and cross-validated Philippine poverty predictions using the OpenStreetMap model.

tion process may likely bolster performance.                            phy of the Philippine archipelago. We also proposed an alter-
   We find that the performance of the the OSM-nightlights              native cost-effective approach to poverty prediction that uses
hybrid model (R2 =0.63) achieves similar results as that                free and publicly available crowd-sourced geospatial infor-
of state-of-the-art satellite-based transfer learning model             mation. Our findings indicate that a model trained on a com-
(R2 =0.63). However, unlike satellite images from Google                bination of OSM and NTL-derived features also achieves an
Static Maps which are proprietary and limited by licensing              R2 of 0.63. We conclude that both satellite images and volun-
terms, both OSM and NTL data are publicly available and                 teered geographic information are valuable tools for high res-
freely redistributable, making them an inexpensive alternative          olution, real-time poverty mapping. Efforts in poverty map-
to daytime satellite images, which cost approximately 3,000             ping have great potential to help governments and humanitar-
USD to acquire in order to generate granular poverty maps               ian organizations better understand the spatial distribution of
for the entire Philippines.                                             poverty and implement more evidence-based targeted inter-
   We also draw attention to some of the drawbacks of using             ventions in developing countries.
OSM for poverty prediction. For one, it is difficult to as-
sess the accuracy and completeness of OSM data, especially              7    Acknowledgments
for hard-to-access regions in far-flung and war-stricken areas.
Moreover, we consider the OSM model as semi-automated,                  We would like to thank Neal Jean, Pia Faustino, Ram De Guz-
as it is still heavily dependent on human input for produc-             man, Lester James Miranda, Kevin Go, and Priscilla Moraes
ing up-to-date geospatial features. Finally, we note that the           for the insightful discussions and valuable guidance. This
OSM dataset contains a large number of different features,              work was supported by the UNICEF Innovation Fund.
with multiple attributes pertaining to the same building type
or POI, thus requiring extensive data cleaning and feature en-          References
gineering.                                                              [Anderson et al., 2019] Jennings Anderson, Dipto Sarkar,
                                                                          and Leysia Palen. Corporate editors in the evolving land-
6    Conclusions                                                          scape of openstreetmap. ISPRS International Journal of
In this study, we implemented the satellite-based deep learn-             Geo-Information, 8(5):232, 2019.
ing approach described by [Xie et al., 2015] and [Jean et al.,          [Babenko et al., 2017] Boris Babenko, Jonathan Hersh,
2016] in the Philippine setting. Our results confirm the ap-              David Newhouse, Anusha Ramakrishnan, and Tom
plicability of the methodology, with the best model achieving             Swartz. Poverty mapping using convolutional neural net-
an r-squared of 0.63 for estimating asset-based wealth. More-             works trained on high and medium resolution satellite
over, this study demonstrates that the method cannot be triv-             images, with an application in mexico. arXiv preprint
ially applied without taking into account the unique geogra-              arXiv:1711.06323, 2017.
[Barrington-Leigh and Millard-Ball, 2017] Christopher                 download dnb composites.html, 2016. Online; accessed
   Barrington-Leigh and Adam Millard-Ball. The world’s                18 December 2018.
   user-generated road map is more than 80% complete.              [Philippine Statistics Authority PSA, 2018] ICF Philippine
   PLoS one, 12(8):e0180698, 2017.                                    Statistics Authority PSA. Philippines national demo-
[Burgert et al., 2013] Clara R. Burgert, Josh Colston, Thea           graphic and health survey 2017, 2018.
   Roy, and Blake Zachary. DHS Spatial Analysis Reports            [Simonyan et al., 2013] Karen Simonyan, Andrea Vedaldi,
   No. 7. ICF International, Maryland, USA, 2013.                     and Andrew Zisserman.          Deep inside convolutional
[Engstrom et al., 2017] Ryan Engstrom, Jonathan Hersh,                networks: Visualising image classification models and
   and David Newhouse. Poverty from space: using high-                saliency maps. arXiv preprint arXiv:1312.6034, 2013.
   resolution satellite imagery for estimating economic well-      [Tiecke et al., 2017] Tobias G. Tiecke, Xianming Liu, Amy
   being, 2017.                                                       Zhang, Andreas Gros, Nan Li, Gregory Yetman, Talip
[Geofabrik GmbH, 2018] Geofabrik GmbH. Philippines -                  Kilic, Siobhan Murray, Brian Blankespoor, Espen B.
   Geofabrik Download Server. https://download.geofabrik.             Prydz, and Hai-Anh H. Dang. Mapping the world popula-
   de/asia/philippines.html, 2018.                                    tion one building at a time. CoRR, abs/1712.05839, 2017.
[Gervasoni et al., 2018] Luciano Gervasoni, Serge Fenet,           [Xie et al., 2015] Michael Xie, Neal Jean, Marshall Burke,
   Regis Perrier, and Peter Sturm. Convolutional neural net-          David Lobell, and Stefano Ermon. Transfer learning from
   works for disaggregated population mapping using open              deep features for remote sensing and poverty mapping.
   data. In DSAA 2018-5th IEEE International Conference on            arXiv preprint arXiv:1510.00098, 2015.
   Data Science and Advanced Analytics, pages 1–10, 2018.          [Zhao and Kusumaputri, 2016] Luda Zhao and Paula
[Grippa et al., 2018] Tais Grippa, Stefanos Georganos,                Kusumaputri. Openstreetmap road network analysis for
   Soukaina Zarougui, Pauline Bognounou, Eric Diboulo,                poverty mapping, 2016.
   Yann Forget, Moritz Lennert, Sabine Vanhuysse, Nicholus
   Mboga, and Eléonore Wolff. Mapping urban land use at
   street block level using openstreetmap, remote sensing
   data, and spatial metrics. ISPRS International Journal of
   Geo-Information, 7(7):246, 2018.
[Head et al., 2017] Andrew Head, Mélanie Manguin, Nhat
   Tran, and Joshua E Blumenstock. Can human develop-
   ment be measured with satellite imagery? In Proceedings
   of the Ninth International Conference on Information and
   Communication Technologies and Development, page 8.
   ACM, 2017.
[Jean et al., 2016] Neal Jean, Marshall Burke, Michael Xie,
   W Matthew Davis, David B Lobell, and Stefano Ermon.
   Combining satellite imagery and machine learning to pre-
   dict poverty. Science, 353(6301):790–794, 2016.
[Juan-Albacea, 2009] Zita Villa Juan-Albacea. Small area
   estimation of poverty statistics. Technical report, Citeseer,
   2009.
[Krizhevsky et al., 2012] Alex Krizhevsky, Ilya Sutskever,
   and Geoffrey E Hinton. Imagenet classification with deep
   convolutional neural networks. In Advances in neural in-
   formation processing systems, pages 1097–1105, 2012.
[Mahabir et al., 2018] Ron Mahabir, Arie Croitoru, Andrew
   Crooks, Peggy Agouris, and Anthony Stefanidis. News
   coverage, digital activism, and geographical saliency: A
   case study of refugee camps and volunteered geographical
   information. PloS one, 13(11):e0206825, 2018.
[Mellander et al., 2015] Charlotta Mellander, José Lobo,
   Kevin Stolarick, and Zara Matheson. Night-time light
   data: A good proxy measure for economic activity? PloS
   one, 10(10):e0139779, 2015.
[NOAA National Centers for Environmental Information, 2016]
   NOAA National Centers for Environmental Information.
   VIIRS DNB Dataset. https://ngdc.noaa.gov/eog/viirs/
You can also read


