Predicting State-Level Agricultural Sentiment with Tweets from Farming Communities
←
→
Page content transcription
If your browser does not render page correctly, please read the page content below
Predicting State-Level Agricultural Sentiment with
                                                     Tweets from Farming Communities

                                                Jared Dunnmon, Swetava Ganguli, Darren Hau, Brooke Husic
                                             {jdunnmon, swetava, dhau, bhusic} @ cs.stanford.edu
arXiv:1902.07087v2 [cs.CL] 25 Apr 2019

                                                                  Stanford University

                                                                                       Abstract

                                                  The ability to obtain accurate food security metrics in developing areas where
                                                  relevant data can be sparse is critically important for policy makers tasked with
                                                  implementing food aid programs. As a result, a great deal of work has been ded-
                                                  icated to predicting important food security metrics such as annual crop yields
                                                  using a variety of methods including simulation, remote sensing, weather models,
                                                  and human expert input. As a complement to existing techniques in crop yield
                                                  prediction, this work develops neural network models for predicting the the senti-
                                                  ment of Twitter feeds from farming communities. Specifically, we investigate the
                                                  potential of both direct learning on a small dataset of agriculturally-relevant tweets
                                                  and transfer learning from larger, well-labeled sentiment datasets from other do-
                                                  mains (e.g. politics) to accurately predict agricultural sentiment, which we hope
                                                  would ultimately serve as a useful crop yield predictor. We find that direct learn-
                                                  ing from small, relevant datasets outperforms transfer learning from large, fully-
                                                  labeled datasets, that convolutional neural networks broadly outperform recurrent
                                                  neural networks on Twitter sentiment classification, and that these models perform
                                                  substantially less well on ternary sentiment problems characteristic of practical
                                                  settings than on binary problems often found in the literature.

                                         1   Introduction
                                         Obtaining reliable data describing local food security metrics at a granularity that is informative to
                                         policy-makers requires expensive and logistically difficult surveys, particularly in the developing
                                         world. Predicting crop yield in developing countries, for instance, is a valuable tool for designing
                                         policies to address food security and poverty. However, current methods such as in-person expert
                                         evaluation, weather modeling, and traditional econometric techniques do not scale well in geograph-
                                         ically inaccessible or poorer areas. Inspired by work done by Jean et al. Jean et al. (2016) and You
                                         et al. You et al. (2017), our group has previously worked to predict food security predictions apply-
                                         ing Convolutional Neural Networks (CNNs) to satellite imagery, which demonstrated a promising
                                         ability to directly predict metrics such as stunting percentage Ganguli, Dunnmon, and Hau (2016).
                                         In addition, using convolutional neural networks and GANs on geospatial data in unsupervised or
                                         semi-supervised settings has also been of interest recently; especially in domains such as food se-
                                         curity, cybersecurity, satellite tasking, etc. (Ganguli, Dunnmon, and Hau (2019); Ganguli, Garzon,
                                         and Glaser (2019); Perez et al. (2019)). We believe that the predictive power of our model could
                                         be improved by incorporating additional information from text-based sources that incorporate high-
                                         granularity knowledge from on-the-ground observation. Such sources could be social media web-
                                         sites like Twitter, Tumblr and Facebook, or newsfeeds from various outlets. Regardless of source,
                                         the key challenge in utilizing such textual data is the fact that fully-labeled datasets related to sen-
                                         timent about crop yield or agricultural performance are effectively nonexistent. While substantial
                                         amounts of labeled sentiment data exist in other domains such as restaurant reviews (Yelp), hotel
                                         reviews (TripAdvisor), movie reviews (IMDB), the ability of sentiment models to transfer accu-

                                                                                            1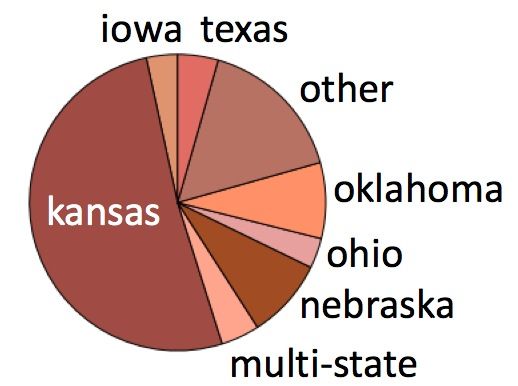
rately from these training distributions to a test distribution involving agriculturally-relevant data is
unclear. Thus, in this work, we investigate two parallel routes for predicting agricultural sentiment
from Twitter data. The first of these involves using a small, domain-relevant dataset to predict on
a held-out test set containing agriculturally-relevant tweets. The underlying hypothesis here is that
the ontology of Twitter is extremely domain-specific to the point that a small, but relevant training
set would enable the creation of a useful domain-specific sentiment classification model.
In the spirit of transfer learning models that have been successfully applied in such fields as computer
vision (Saenkoa et al. (2010), Lim, Salakhutdinov, and Torralba (2011)), our second hypothesis
states that we can overcome the challenge of sparse datasets by leveraging rich, fully-labeled datasets
curated for other purposes, such as sentiment prediction on political learnings, economic health,
and movie reviews. Sentiment analysis on these easily available datasets, although unrelated to the
domain of interest, may encode features and learnings that are transferable to smaller target datasets.
To test these hypotheses, we (1) located and obtained several rich, fully-labeled sentiment analy-
sis datasets for unrelated domains from websites such as CrowdFlower; (2) extracted and labeled
Twitter posts related to crops, location, and weather. Approximately 12 man-hours was spent by
each team-member in the process of manually labeling our dataset; (3) trained several different NLP
models (e.g. GRU variants, LSTM variants, CNN) on fully-labeled and augmented datasets and per-
formed thorough hyperparameter searches; and (4) evaluated model performance on a held-out test
dataset directly applicable to crop yield prediction.

2   Background and Related Work

Crop Yield—Traditional methods for predicting crop yield are described by Porter et al Porter et al.
(2014). Most established methods use models incorporating a subset of precipitation, temperature,
CO2 and O3 (ozone), and soil parameters, which are not always readily available, particularly in de-
veloping areas of the world where food security data is most important. To overcome this challenge,
You et al. leverage remote sensing imagery and state-of-the-art machine learning techniques to au-
tomatically extract features of interest You et al. (2017). They process a time series of multi-spectral
images into a time series of histograms of pixel intensities. These histograms can be stacked and
fed into a CNN with convolution over the “bin” and “time” dimensions, or they can be fed into an
LSTM. You et al. show that these models significantly outperform widely used crop yield prediction
models such as ridge regression, decision trees, and dense neural networks. In CS 221, our group
built a similar pipeline for predicting food security metrics. Instead of deriving histograms to be fed
into CNNs and LSTMs, we directly applied a CNN to satellite images to predict stunting percentage
metrics for different geographic clusters in Nigeria. With a hyperparameter search performed only
for learning rate, we achieved above 40% accuracy (substantially above the baseline) on classifying
images by food security metric levels. Our belief that incorporating additional information from
near real-time text sources could supplement this imagery-based approach has motivated the current
work.
Sentiment Analysis—Sentiment analysis is a popular topic in the natural language processing field,
although it is typically applied to areas such as political sentiment and movie reviews. Peter Nagi,
for instance, Nagy (2017) uses LSTMs for sentiment analysis of tweets from the first GOP primary
debate. After removing the neutral examples such that he predicts only positive and negative classes,
Nagi achieves a test accuracy of 84%, which decomposes into 93% accuracy for negative tweets and
57% accuracy for positive tweets. He hypothesizes that these unbalanced results occur because
the GOP debate tweets featured a substantially greater number of negatively labeled examples than
positively labeled examples.
Socher et al. Socher et al. (2013) use the Rotten Tomatoes dataset, originally compiled by Pang and
Lee Pang and Lee (2005), in their Stanford Sentiment Treebank, in which sentences are parsed into
a tree structure. They pioneer the use of a Recursive Neural Tensor Network (RNTN) and evaluate
its performance on sentiment classification on all nodes (words and phrases in sentence) and on the
root node (entire sentence), for both fine-grained sentiments of five classes (very negative, negative,
neutral, positive, and very positive) and coarse positive/negative classes. The RNTN achieves im-
proved accuracies across the board compared with existing models, and it works particularly well
with shorter text, given the increased importance of negation and composition. It is worth noting,

                                                   2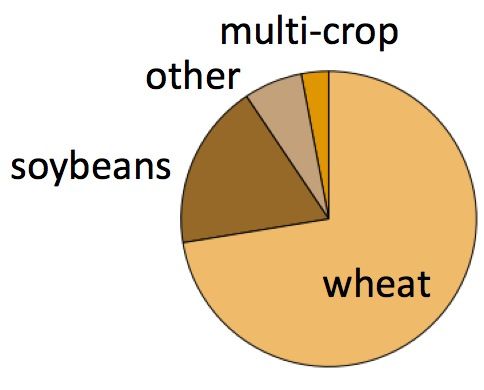
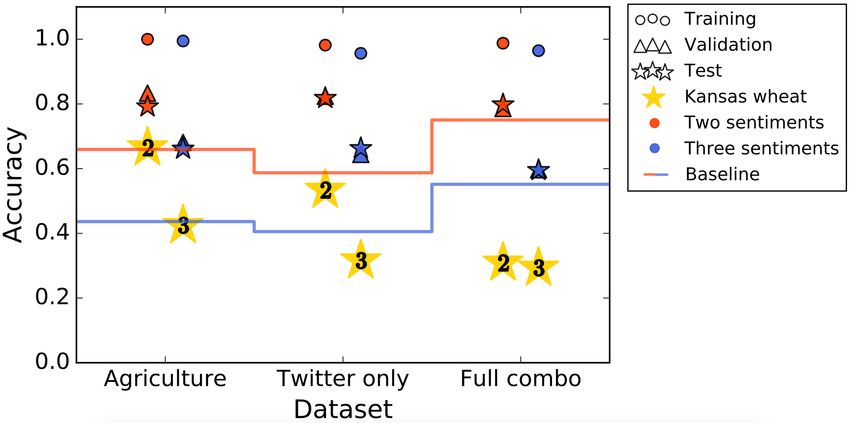
(a) By crop                        (b) By state

               Figure 1: Distribution of agriculture-related tweets by crop and by state

however, that predicting fine-grained sentiments of entire sentences is much more difficult than any
of the other tasks.
Yoon Kim Kim (2014) adapts CNNs for sentence classification on a variety of tasks (i.e. sentiment
analysis, question type). This work suggests that a single layer CNN is comparable to or performs
marginally better than state-of-the-art models for each of the tasks considered. Given the success
of the models described here, we propose using variants of GRU and LSTM (e.g. single cell, bi-
directional, multi-layer) models in addition to CNN-based architectures to assess the ability of both
direct learning and transfer learning to predict agricultural sentiment that would help to accurately
predict crop yield.
Transfer Learning—Previous work by Bartusiak et al. Bartusiak et al. (2015) demonstrates that
transfer learning can be effective, even for a simple SVM classifier. We hypothesize that by consis-
tently using GloVe word embeddings that capture the semantic similarities among words, we could
enable effective cross-domain transfer learning on sentiment prediction tasks.

3   Data

Fundamentally, we are interested in assessing whether models achieve better performance predicting
agricultural sentiment when those models are trained on (a) a smaller, domain-relevant dataset or (b)
a richer dataset from one or more unrelated domains. In other words, we want to know if a sentiment
model trained on non-agricultural inputs can generalize to our domain of interest. Descriptions of
our small, domain-relevant dataset and our richer, unrelated datasets are provided below.
Target Dataset on Agricultural Sentiment—To obtain the smaller target dataset, we designed a
Twitter query to extract tweets of interest, which we defined as containing (i) crop of interest,
e.g. “wheat”, “lettuce”, “soybeans” based on major U.S. agricultural products Wikipedia (2017);
(ii) state name, e.g. “Kansas”, “Nebraska”; and (iii) a word describing weather, e.g. “rain”, “hail”.
This query returned nearly 100,000 tweets from the year 2016. After filtering for relevance and
deleting identical tweets, we retained approximately 4000 tweets. We manually labeled this dataset
with five sentiment classes: 0 - very negative, 1 - negative, 2 - neutral, 3 - positive, 4 - very positive.
After a final manual filter that eliminated duplicates and irrelevant tweets, our dataset consisted of
about 2300 tweets suitable for analysis. This exercise itself (i.e., obtaining and manually labeling
a specialized dataset) demonstrates the potential value of our project, given the effort required to
obtain just 2300 relevant examples.
The breakdown of the tweets revealed that the most common location was Kansas, and the most
common crop was wheat (see Fig. 1). Therefore, we chose our target dataset for final agricultural
sentiment prediction to be all tweets about wheat in Kansas between July and December 2016. This
set consisted of 266 tweets and was isolated from all model training. For training, we used all
(suitable) tweets posted before July about any crop and any state, which amounted to 882 tweets.
This design ensures that we are not contaminating our final prediction with data about other states
and crops that occurred during the same time interval as our isolated Kansas wheat dataset.
In summary, this twitter query produced two datasets that we will refer to by the following abbrevi-
ations:

                                                    3
KWT Kansas Wheat Test: 266 tweets about wheat in Kansas from July 2016 – December 2016
AG Agricultural sentiment: 882 tweets about crops in the U.S. from March 2016 – June 2016.
Prelabeled Sentiment Datasets—We used three distinct prelabeled sentiment datasets in order to
train sentiment models on domains unrelated to agriculture. All three datasets contain only small
sentences (52 words are fewer) and two of them are from Twitter. These fully-labeled datasets are
as follows:
GD Tweets about the first 2016 GOP primary debate (13871 examples, 3 sentiment
classes).Crowdflower (2017)
SDC Tweets about self-driving cars (6943 examples, 5 sentiment classes)Crowdflower (2017)
RT Movie reviews from Rotten Tomatoes (11855 examples, 0-1 continuous sentiment classifi-
cation) Group (2017)
To improve cross-domain performance, we mapped each labeled dataset (KWT, AG, GD, SDC, and
RT) to three sentiments (negative, neutral, and positive). Then, we combined these datasets into
larger, fully-labeled datasets as follows:
TO Twitter Only: GD + SDC datasets
FC Full Combo: GD + SDC + RT datasets
TOA Twitter Only with Agriculture: GD + SDC + AG datasets
FCA Full Combo with Agriculture: GD + SDC + RT + AG datsets
All datasets were reasonably balanced with respect to distribution of negative, neutral, and positive
sentiment.
Dataset/Sentiment Negative Neutral Positive
Agriculture 38.8% 32% 29.3%
Twitter Only 44.6% 35.5% 19.9%
Full Combo 40.4% 33.9% 25.7%
4 Approach
Exploring the efficacy of a variety of models and datasets requires an efficient, modular pipeline
for standardizing data, specifying models, performing hyperparameter searches, and evaluating op-
timized models. The first stage of this pipeline is data pre-processing. At this step, the data and
sentiments are input in their raw forms and are output as lists of sentence vectors and class labels.
To achieve this, we built a “feature processor” for the fully-labeled data which reads in a file (usually
csv) and saves standardized input embeddings, sequence lengths, and output labels mapped to three
sentiment classes (see Fig. 2).
Next, a training script reads in a text file specifying hyperparameters and creates a corresponding
config object with those specifications. A model object is initiated with a config object, and builds
the appropriate NLP model. The model object contains the requisite functions to build the Tensor-
flow graph, train the model, and perform predictions. The training script also evaluates the model on
a test set and saves the results (see Fig. 2). The models we implemented for this codebase include
single-cell GRU, bi-directional GRU, multi-layer GRU, multi-layer bi-directional GRU, single-cell
LSTM, bi-directional LSTM, multi-layer LSTM, multi-layer bi-directional LSTM, and (text) CNN.
We also have implemented the attention mechanism for each of the RNN models, but did not include
it in our analysis due to time constraints.
For our baseline, we classified sentiment using SVM (kernel and regularized), logistic regression
(kernel and regularized), and dense neural networks (regularized). The best cross-validated models
across each hyperparameter search were saved.
Model/Dataset Agricultural GOP Rotten Tomatoes Self Driving Cars
SVM 36% 61% 36% 61%
Logistic Regression 33% 61% 33% 11%
Dense Neural Network 53% 65% 53% 65%
4Figure 2: Hyperparameter search pipeline. The data featurizer returns an object with attributes that
can be saved and loaded into a model. Cross-validation is performed via the config object, which
specifies the network architecture, relevant hyperparameters, train/test/prediction datasets, etc.
Altogether, we wrote more than 2500 lines of code (Tensorflow and Python) from scratch and
adapted more than 1500 lines of code from available resources. Note that the CNN code in par-
ticular is heavily indebted to the work of Britz (2015).
5 Experiments
Hyperparameter Search—The config object makes it straightforward to perform hyperparameter
searches. We used GPU resources to run 14 distinct hyperparameter search campaigns (see sup-
plementary materials). Optimized hyperparameters included neural network model, hidden size (for
RNNs), batch size, dropout probability, learning rate, L2 regularization lambda (for CNN), the num-
ber of filters (for CNN), and the number of training epochs. Config parameters that we kept fixed
were using dense rather than one-hot representations, always padding the inputs to a fixed length,
using the same convolutional filter sizes (for CNN), using a fixed number of RNN layers (for multi-
layer RNNs), and always clipping gradients with a maximum gradient norm of 5. Nearly all of our
models use 50-dimensional GloVe vectors. In total, we have over 720 distinct hyperparameter runs
(see the supplementary material). To evaluate the performance of a given hyperparameter run, we
perform three iterations of cross-validation with shuffle split for each hyperparameter set, and report
the median accuracy and IQR.
Insights—The main takeaway from the hyperparameter search was that CNNs performed better than
the RNN models (see Fig. 3a). It also turns out that on both CPUs and GPUs, CNN models train
much faster (5 min) than RNN models ( 1 hr). This is not necessarily unexpected, as the expected
advantages from RNN recurrence structure are smaller when sentences are smaller (as in tweets),
and CNN filters are able to directly cover a larger proportion of smaller input strings. Additionally,
it became apparent that the dropout keep probability could be set anywhere between 0.5 and 0.9,
depending on the model and number of hidden units or filters (see Fig. 3b). For RNNs, small
datasets (Agriculture) require a smaller hidden size while the large augmented datasets (Twitter
Only w/ Ag and Full Combo w/ Ag) require larger hidden size to achieve optimum performance
(see Fig. 3c). This increase in hidden layer size suggests that the wider range of topics contained
in the larger augmented datasets makes it more difficult to learn patterns generalizable to the target
dataset.
Given that single-layer CNNs broadly perform better than any of the RNN variants, we focused our
attention on this model and isolated the top three models from the hyperparameter search for further
analysis. Overall, there was very little difference in accuracy among the top three models - the
IQRs are extremely small, and all accuracies appear to fall nearly within each others’ IQR ranges,
which means our results are consistent (see Fig. 4). Due to time and computation constraints, we
therefore felt comfortable removing our three-fold cross validation and simply using a single model
to evaluate CNN performance moving forward.
The optimized set of hyperparameters used in our final CNN models were as follows: (1) dropout
keep probability = 0.5; (2) learning rate = 0.001; (3) number of filters per filter size = 64; (4) Filter
sizes = [1, 2, 3, 4, 5, 10]; (5) Batch size = 100. Our dropout of 0.5 seems consistent with the results
5(a) Accuracy comparison (b) Dropout comparison (c) Hidden size comparison
Figure 3: A sample comparison of model performance and correlated hyperparameters. Blue is a
single-cell GRU, green is a single-cell LSTM, brown is a bi-directional GRU, red is a bi-directional
LSTM, and gray is a single-layer CNN.
Figure 4: Accuracies of top three single-layer CNN models. AG, GD, RT, and SDC refer to previ-
ously described datasets. AS and OT were initial labels that correspond to to FC and TO, respec-
tively. EH and ENT correspond to prelabeled sentiment datasets from CrowdFlower concerning
economic health and economic news tone that were removed from further analysis due to low ac-
curacies during hyperparameter searches (above) as well as small dataset size and sentence length
5-10x longer than the retained datasets.
from Kim Kim (2014), which show that CNNs have a substantial tendency to overfit the training
data. We also noticed a slight improvement (1-2%) using 300-dimensional GloVe vectors compared
with 50-dimensional GloVe vectors.
Our final CNN models were then used to predict sentiment on the held out Kansas wheat Twitter
dataset. The first confusion matrix in Fig. 5 describes the train set at the end of the training process.
The model is clearly able to distinguish between positive and negative sentiments, although it has
a more difficult time with neutral ones. Even more noticeable is the performance on the held-out
Kansas wheat dataset, where the majority of positive tweets were predicted to be neutral.
(a) Confusion matrix on test set (b) Confusion matrix on Kansas
of Agriculture dataset, using the wheat, using the model yielding the
final trained model. best development accuracy.
Figure 5: Confusion matrices for Agriculture (AG) test set and Kansas wheat (KWT) dataset.
Reviewing the literature, we find that predicting on fine-grained sentiments which include a neutral
label is indeed a difficult task. For instance, Socher et al. achieve 85.4% accuracy when predicting
only positive and negative classes on an entire sentence, but achieve only 45.7% when predicting
6on very negative, negative, neutral, positive, and very positive Socher et al. (2013). While we are
interested in including neutral sentiments in practical settings where neutral sentiments cannot be
removed from a classification dataset in preprocessing, it is informative to see what the effect of
removing the neutral examples would have on model performance. Thus, as a final comparison,
we ran training and testing on the Agriculture, Twitter Only, and Full Combo datasets, as well as
prediction on the held out Kansas wheat Twitter dataset, for both binary (negative, positive) and
ternary (negative, neutral, positive) sentiments, as shown in Fig. 6.
Figure 6: Model training, validation, and test performance and performance on Kansas Wheat Test
(KWT) set for models trained on three different datasets for both 2- and 3-sentiment classes. The
red and blue shapes represent the training, validation, and test accuracies for training a model with
two and three sentiment classes, respectively. The gold stars represent predictions on KWT for two
and three sentiments. The red and blue lines represent the baseline accuracies for non-deep learning
models on KWT for two and three sentiment classes, respectively.
In each case, see that we can overfit our train set (over 95%), and do reasonably well on both the dev
and test sets drawn from the same distribution as the train set. However, we do less well on predicting
sentiment on the held out Kansas wheat Twitter dataset, which is to be expected. Interestingly, we
confirm the occasionally drastic difference in performance between predicting binary and ternary
sentiments, which can be as high as 20% in terms of accuracy.
Examples of Misclassification—Many of the model’s mistakes were due to incorrectly labeling ex-
amples as neutral. Below are some examples of such mistakes:
Label Predicted Tweet
Positive Neutral kansas is enjoying ’once in a lifetime’ wheat harvest
Positive Neutral wheat harvest big healthy crop in kansas
Positive Neutral clay kansas got of rain this morning wheat looks good
fall tillage was going well
Additional mistakes were likely due to the CNN focusing on the wrong keywords. This could
potentially be remedied by implementing attention.
Label Predicted Tweet
Positive Negative induced dust bowl update kansas farmers harvest
record winter wheat crop
Negative Positive thomas kansas wheat struggling with little recent
rain some light mist today
Negative Positive thomas kansas wheat getting excessively dry probably
done growing for the season
There were also some confusing tweets that contained one sentiment for an unrelated topic and the
opposing sentiment for wheat. These are difficult to label even for a human.
Label Predicted Tweet
Neutral Positive phillips kansas cattle still gaining well in the cold
with the lots dry wheat hasn’t changed much this week
Positive Negative clay kansas wheat still looks good warm temps today are starting
to dry things not enough mud to make feeding cattle a challenge
7Finally, we noticed that there was a non-negligible amount of human error, demonstrating the im-
portance of a rigorous labeling process. In the following cases, for instance, we believe the model’s
prediction is more appropriate than the human label.
Label Predicted Tweet
Positive Neutral wheat harvest wrapping up in southern kansas
Positive Neutral all aboard wheat harvest featured on ag am in kansas
Positive Negative rains keep kansas wheat harvest at a slow pace
Unfortunately, our time constraints compelled us to split up dataset labeling among four people, with
different people labeling different subsets of tweets separated in time. In the future, examples to be
labeled should be shuffled randomly before distribution, with appropriate steps taken to normalize
across bias in each labeler.
Validation Infusion—We briefly investigated a procedure we refer to as “validation infusion”, in
which we train a model on a dataset from a non-agriculture domain but instead of using a partition of
the same dataset for validation and testing, we substitute some percentage of the validation set with
the agricultural sentiment (AG) dataset and use a test set composed of only AG. In our formulation,
the entirety of AG is used. First, some percentage of AG is set aside as the test set. Second, an
appropriate partition of the unrelated (training) dataset is allocated to the validation dataset such that
the percentage of the validation dataset that comprises AG data is the percentage pre-specified by
the modeler. The idea is that even though the model is trained on data unrelated to agriculture, it is
evaluated (at least partially) on agricultural sentiment data. We found that this validation infusion
procedure did not change the accuracies of KWT prediction when compared to the same dataset
without validation infusion.
Salient Characteristics of RNN models—Our RNN models work best for our dataset with small
learning rates (best performance at 1 x 10⁻⁴ ). Improvement (≈ 2%) in accuracy is obtained
when the GRUs/LSTMs are bi-directional and a further gain in performance is obtained when the
GRUs/LSTMs are deeper (multi-layered). LSTM-based models seem to be slightly better than GRU.
For an aggregated dataset, a hidden size of 300 seems to work best.
6 Conclusions and Future Work
This project sought to investigate the potential of both direct learning and transfer learning to predict
sentiment about crop yield from tweets from farming communities. For unrelated domains, we
used publicly available, fully-labeled datasets on sentiment related to movie reviews, the first 2016
GOP debate, and self driving cars. For the target domain, we downloaded a sizable amount of
crop-related Twitter posts and manually filtered and labeled them for positive, negative, and neutral
sentiment. To determine the best neural network for this application, we built a robust pipeline
for extensive hyperparameter search across models, ultimately running over 720 distinct models.
Our analysis revealed that CNNs outperform and train faster than RNN variants across datasets.
We also found that training on smaller, relevant datasets outperformed training on larger, unrelated
datasets. Therefore, our initial hypothesis that NLP models could effectively transfer learning across
domains was incorrect. Furthermore, we demonstrated that predicting ternary sentiments is much
more difficult than predicting binary sentiments, which is backed up by the literature. However,
we believe that accurately predicting on at least negative, neutral, and positive classes is highly
relevant to many practical applications, including crop yield prediction, wherein forcing a two-
sentiment structure would add substantial (and unwarranted) noise to the data. Therefore, more
effort should be invested into building effective models for fine-grained sentiment analysis, not just
binary classification. Addressing these challenges in the future requires more labeled data in the
domain of interest – we hope that this project can effectively motivate the creation of agriculturally-
relevant social media datasets. Optimally performing these prediction tasks may also require more
sophisticated models, such as incorporating attention into both the GRU/LSTM variants and more
layers into a CNN.
8Acknowledgments
We would like to thank Chris Manning for teaching CS 224N and being our project mentor; Patrick
Baylis and Sabelle Smythe for helping us with our Twitter queries; and Marshall Burke, Stefano
Ermon, and David Lobell for their feedback on this project as part of the Stanford Sustainability and
AI Lab.
Contributions
JD, SG, DH, and BH envisioned the project, developed and tested hypotheses, ran experiments
on GPU resources, analyzed results, discussed conclusions, and wrote the report. JD adapted and
maintained the CNN code. SG wrote and maintained the baseline code. SG and DH adapted and
maintained the RNN code. DH analyzed model predictions on individual examples. BH processed
the Twitter query, wrote and maintained the feauturization code, and wrote and maintained model
processing and visualization code.
References
Bartusiak, R.; Augustyniak, L.; Kajdanowicz, T.; and Kazienko, P. 2015. Sentiment analysis for
polish using transfer learning approach. 2015 Second European Network Intelligence Conference
53–59.
Britz, D. 2015. Implementing a cnn for text classification in tensorflow.
http://www.wildml.com/2015/12/implementing-a-cnn-for-text-classification-in-tensorflow/.
Crowdflower. 2017. Data for everyone (crowdflower). https://www.crowdflower.com/data-for-
everyone/. Accessed: 2017-01-31.
Ganguli, S.; Dunnmon, J.; and Hau, D. 2016. Predicting food security outcomes using cnns for
satellite tasking. Stanford University CS 221 Artificial Intelligence Project Report.
Ganguli, S.; Dunnmon, J.; and Hau, D. 2019. Predicting food security outcomes using convolutional
neural networks (cnns) for satellite tasking. arXiv preprint arXiv:1902.05433.
Ganguli, S.; Garzon, P.; and Glaser, N. 2019. Geogan: A conditional gan with reconstruc-
tion and style loss to generate standard layer of maps from satellite images. arXiv preprint
arXiv:1902.05611.
Group, S. N. 2017. Stanford sentiment treebank. http://nlp.stanford.edu/sentiment/treebank.html.
Accessed: 2017-01-31.
Jean, N.; Burke, M.; Xie, M.; Davis, W. M.; Lobell, D. B.; and Ermon, S. 2016. Combining satellite
imagery and machine learning to predict poverty. Science 353(6301):790–794.
Kim, Y. 2014. Convolutional neural networks for sentence classification. arXiv:1408.5882.
Lim, J. J.; Salakhutdinov, R.; and Torralba, A. 2011. Transfer learning by borrowing examples for
multiclass object detection. NIPS.
Nagy, P. 2017. Lstm sentiment analysis — keras.
https://www.kaggle.com/ngyptr/d/crowdflower/first-gop-debate-twitter-sentiment/lstm-sentiment-
analysis-keras.
Pang, B., and Lee, L. 2005. Seeing stars: Exploiting class relationships for sentiment categorization
with respect to rating scales. Proceedings of ACL, pp. 115–124.
Perez, A.; Ganguli, S.; Ermon, S.; Azzari, G.; Burke, M.; and Lobell, D. 2019. Semi-supervised
multitask learning on multispectral satellite images using wasserstein generative adversarial net-
works (gans) for predicting poverty. arXiv preprint arXiv:1902.11110.
Porter, J. R.; Xie, L.; Challinor, A. J.; Cochrane, K.; Howden, S. M.; Iqbal, M. M.; Lobell, D. B.;
and Travasso, M. I. 2014. Food security and food production systems. Climate Change 2014:
Impacts, Adaptation, and Vulnerability 485–533.
Saenkoa, K.; Kulis, B.; Fritz, M.; and Darrell, T. 2010. Adapting visual category models to new
domains. Proc. ECCV, September 2010,Heraklion, Greece.
9Socher, R.; Perelygin, A.; Wu, J. Y.; Chuang, J.; Manning, C. D.; Ng, A. Y.; and Potts, C. 2013.
Recursive deep models for semantic compositionality over a sentiment treebank. Proceedings of
the conference on empirical methods in natural language processing (EMNLP) 1631:1642.
Wikipedia. 2017. Agriculture in the united states (wikipedia). Wikipedia Webpage.
You, J.; Li, X.; Low, M.; Lobell, D.; and Ermon, S. 2017. Deep gaussian process for crop yield pre-
diction based on remote sensing data. Association for the Advancement of Artificial Intelligence.
10You can also read