ESTIMATION OF THE TRANSMISSION RISK OF THE 2019 NCOV AND ITS IMPLICATION FOR PUBLIC HEALTH INTERVENTIONS - MDPI
←
→
Page content transcription
If your browser does not render page correctly, please read the page content below
Article
Estimation of the Transmission Risk
of the 2019‐nCoV and Its Implication for
Public Health Interventions
Biao Tang 1,2, Xia Wang 3, Qian Li 2,4, Nicola Luigi Bragazzi 2, Sanyi Tang 3, Yanni Xiao 1,4
and Jianhong Wu 1,2,5,*
 1 The Interdisciplinary Research Center for Mathematics and Life Sciences, Xiʹan Jiaotong University,
 Xi’an 710049, China; btang66@yorku.ca; yxiao@mail.xjtu.edu.cn (Y.X.)
 2 Laboratory for Industrial and Applied Mathematics, Department of Mathematics and Statistics,

 York University, Toronto, Ontario M3J 1P3, Canada; crystallee@stu.xjtu.edu.cn (Q.L.);
 robertobragazzi@gmail.com (N.L.B.)
 3 School of Mathematics and Information Science, Shaanxi Normal University,

 Xi’an 710119, China; xiawang@snnu.edu.cn; sanyitang219@hotmail.com (S.T.)
 4 School of Mathematics and Statistics, Xiʹan Jiaotong University, Xi’an 710049, China

 5 Fields‐CQAM Laboratory of Mathematics for Public Health, York University, Toronto,

 Ontario M3J 1P3, Canada
 * Correspondence: wujh@yorku.ca

 Received: 31 January 2020; Accepted: 6 February 2020; Published: 7 February 2020

 Abstract: Since the emergence of the first cases in Wuhan, China, the novel coronavirus
 (2019‐nCoV) infection has been quickly spreading out to other provinces and neighboring
 countries. Estimation of the basic reproduction number by means of mathematical modeling can be
 helpful for determining the potential and severity of an outbreak and providing critical
 information for identifying the type of disease interventions and intensity. A deterministic
 compartmental model was devised based on the clinical progression of the disease,
 epidemiological status of the individuals, and intervention measures. The estimations based on
 likelihood and model analysis show that the control reproduction number may be as high as 6.47
 (95% CI 5.71–7.23). Sensitivity analyses show that interventions, such as intensive contact tracing
 followed by quarantine and isolation, can effectively reduce the control reproduction number and
 transmission risk, with the effect of travel restriction adopted by Wuhan on 2019‐nCoV infection in
 Beijing being almost equivalent to increasing quarantine by a 100 thousand baseline value. It is
 essential to assess how the expensive, resource‐intensive measures implemented by the Chinese
 authorities can contribute to the prevention and control of the 2019‐nCoV infection, and how long
 they should be maintained. Under the most restrictive measures, the outbreak is expected to peak
 within two weeks (since 23 January 2020) with a significant low peak value. With travel restriction
 (no imported exposed individuals to Beijing), the number of infected individuals in seven days will
 decrease by 91.14% in Beijing, compared with the scenario of no travel restriction.

 Keywords: coronavirus; infection management and control; travel restriction; mathematical model;
 SEIR model

1. Introduction
 Coronaviruses are enveloped, single‐stranded, positive‐sense RNA viruses belonging to the
family of Coronaviridae [1]. They cause generally mild respiratory infections, even though they are
occasionally lethal. Since their discovery and first characterization in 1965 [2], three major,
large‐scale outbreaks have occurred, caused by emerging, highly pathogenic coronaviruses, namely,

J. Clin. Med. 2020, 9, 462; doi:10.3390/jcm9020462 www.mdpi.com/journal/jcm
J. Clin. Med. 2020, 9, 462 2 of 13

the “Severe Acute Respiratory Syndrome” (SARS) outbreak in 2003 in mainland China [3], the
“Middle East Respiratory Syndrome” (MERS) outbreak in 2012 in Saudi Arabia [4,5] and the MERS
outbreak in 2015 in South Korea [6,7]. These outbreaks have resulted in more than 8000 and 2200
confirmed SARS and MERS cases, respectively [8].
 Recently, a fourth coronavirus outbreak has occurred in Wuhan, the capital city of the Hubei
province and the seventh largest city of People’s Republic of China [9–11].
 Since 31 December 2019, when the Wuhan Municipal Health Commission reported 27 cases of
viral pneumonia, including 7 critically ill cases, the pneumonia outbreak has received considerable
global attention. A novel coronavirus was identified as the causative agent by the Chinese
authorities on 7 January 2020, and on 10 January 2020, the World Health Organization (WHO)
designated the novel coronavirus as 2019‐nCoV. On the same day, the WHO released a wide range
of interim guidance for all countries on how they can get prepared for coping with this emergency,
including how to monitor for potentially infected people, collect and test samples, manage patients,
control and mitigate the burden generated by the infection in health centers, maintain the right drug
supplies and effectively communicate with the lay public regarding the new virus [12].
 By the morning of 23 January 2020, more than 571 confirmed cases with 17 deaths had been
reported in other parts of mainland China, and in various countries including South Korea, Japan,
Thailand, Singapore, the Philippines, Mexico and the United States of America. As of 6 February
2020 (02:45 GMT), 28,276 cases, of which 3863 are in critical condition, and 565 deaths had been
reported.
 The transmission potential, often measured in terms of the basic reproduction number, the
outbreak peak time and value and duration under current and evolving intervention measures,
remain unclear, and warrant further investigation.
 On 20 January 2020, the Chinese government revised the law provisions concerning infectious
diseases to add the 2019‐nCoV as a class B agent (a pathogen that can cause an epidemic outbreak).
On the same day, public health officials announced a further revision to classify the novel virus as a
class A agent (a pathogen that can cause an epidemic in a short time). Some non‐pharmaceutical
interventions (NPIs), including intensive contact tracing followed by quarantine of individuals
potentially exposed to the disease, and isolation of infected, symptomatic individuals, were
implemented, but their effectiveness during the early stage is questionable.
 Quantifying the effectiveness of these interventions is of crucial importance for Wuhan as well
as for other cities in their preparedness and rapid response to the importation of infected cases. With
the arrival of the Spring Festival, massive traveling is expected to mobilize a large segment of the
population, by which the novel coronavirus may be broadly reseeded.
 Extreme, unprecedented measures have been taken. For example, on 23 January 2020, the
Chinese authorities introduced travel restrictions affecting five cities (Wuhan, Huanggang, Ezhou,
Chibi and Zhijiang), effectively shutting down the movement of more than 40 million people.
 However, how these expensive and resource‐intensive measures can contribute to the
prevention and control of the infection in these cities and other parts of the country, and how long
these travel restrictions should be maintained, remain to be determined. In the context of a novel
coronavirus affecting a naïve population, estimation of the basic reproduction number is important
for determining the potential and severity of an outbreak, and providing critical information for
designing and implementing disease outbreak responses in terms of the identification of the most
appropriate, evidence‐based interventions, mitigation measures and the determination of the
intensity of such programs in order to achieve the maximal protection of the population with the
minimal interruption of social‐economic activities [8].
 As recognized by the WHO [13], mathematical models, especially those which are timely, play a
key role in informing evidence‐based decisions by health decision‐ and policy‐makers. To the best of
our knowledge, only a few mathematical models have so far been publicly released, including a
Bats‐Hosts‐Reservoir‐People transmission network model and a returning traveler study aimed to
compute underestimated coronavirus cases [14,15].
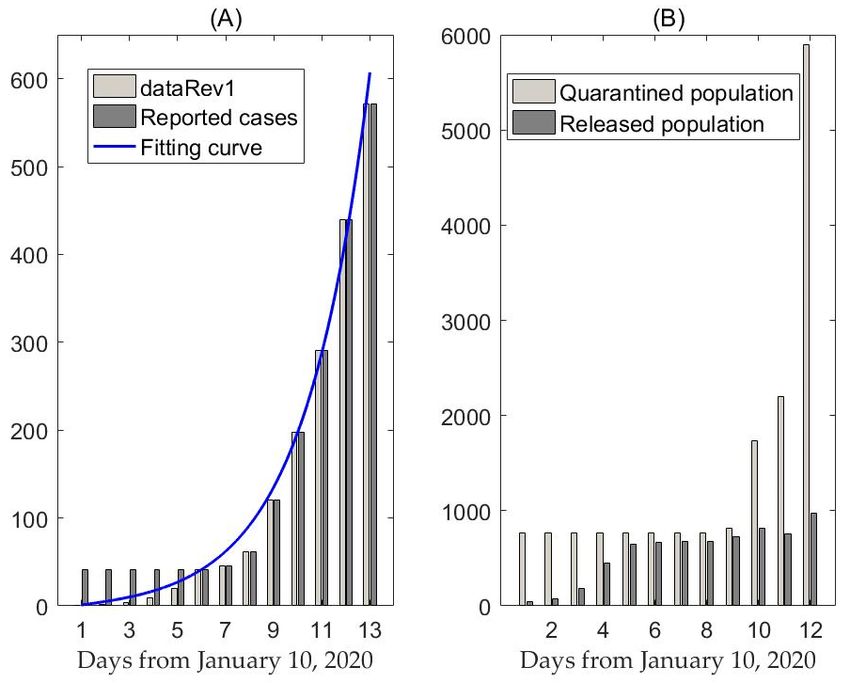
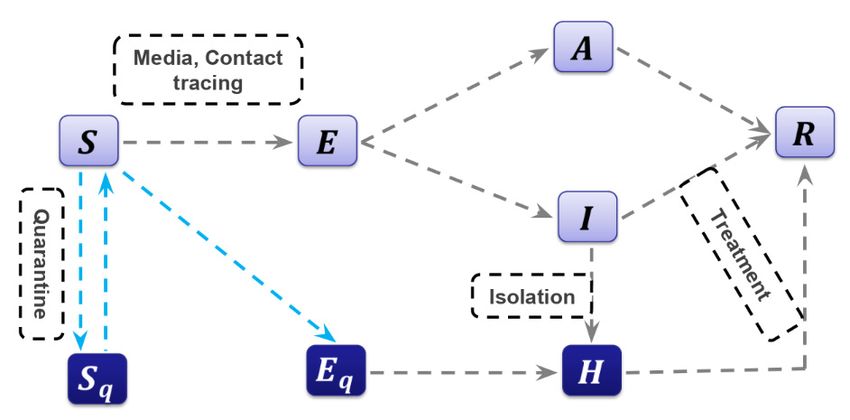
J. Clin. Med. 2020, 9, 462 3 of 13

 No study has focused on the practical implications of public health interventions and measures.
Therefore, the present study was undertaken to fill in this gap of knowledge.

2. Experimental Section

2.1. Data
 We obtained data of laboratory‐confirmed 2019‐nCoV cases which occurred in mainland China
from the WHO situation report, the National Health Commission of the People’s Republic of China
and the Health Commission of Wuhan City and Hubei Province [16–19]. Data information includes
the cumulative number of reported cases, as shown in Figure 1A, and the quarantined and released
population, as shown in Figure 1B. The data were released and analyzed anonymously. Since the
identification of the 2019‐nCoV on 10 January 2020, some cases were ruled out and the cumulative
number of reported cases per day was 41, from 10 to 15 January 2020. To obtain the relatively
reliable data, we used the exponential growth law to deduce the number of reported cases per day
from 31 December 2019 to 10 January 2020 (called dataRev2) or from 10 to 15 January 2020 (called
dataRev1) based on the 41 cases on that date, as shown in Figure 1A.
 By inferring the effectiveness of intervention measures, including quarantine and isolation
(Figure 1B), we estimated the required effectiveness of these interventions in order to prevent the
outbreak.

 Figure 1. (A) Cumulative diagnoses and revised case data (dataRev1) in mainland China, the blue
 curve is the best fitting curve of model (1) to dataRev1. (B) Data information of cumulative
 quarantined/released population.

2.2. The Model
 Here, we propose a deterministic “Susceptible‐Exposed‐Infectious‐Recovered” (SEIR)
compartmental model based on the clinical progression of the disease, epidemiological status of the
individuals and intervention measures (Figure 2). We parameterized the model using data obtained
for the confirmed cases of 2019‐nCoV in mainland China and estimated the basic reproduction
number of the disease transmission.
J. Clin. Med. 2020, 9, 462 4 of 13

 Figure 2. Diagram of the model adopted in the study for simulating the novel coronavirus
 (2019‐nCoV) infection. Interventions including intensive contact tracing followed by quarantine and
 isolation are indicated.

 In more detail, we investigated a general SEIR‐type epidemiological model, which incorporates
appropriate compartments relevant to interventions such as quarantine, isolation and treatment. We
stratified the populations as susceptible (S), exposed (E), infectious but not yet symptomatic
(pre‐symptomatic) (A), infectious with symptoms (I), hospitalized (H) and recovered (R)
compartments, and further stratified the population to include quarantined susceptible (Sq), isolated
exposed (Eq) and isolated infected (Iq) compartments.
 With contact tracing, a proportion, q, of individuals exposed to the virus is quarantined. The
quarantined individuals can either move to the compartment Eq or Sq, depending on whether they
are effectively infected or not [20], while the other proportion, 1 – q, consists of individuals exposed
to the virus who are missed from the contact tracing and move to the exposed compartment, E, once
effectively infected or stay in compartment S otherwise. Let the transmission probability be β and
the contact rate be constant c. Then, the quarantined individuals, if infected (or uninfected), move to
the compartment Eq (or Sq) at a rate of βcq (or (1 – β)cq). Those who are not quarantined, if infected,
will move to the compartment E at a rate of βc 1 . The infected individuals can be detected and
then isolated at a rate and can also move to the compartment R due to recovery.
 The transmission dynamics are governed by the following system of equations:
 1 ,
 1 ,
 ,
 1 ,
 (1)
 1 ,
 ,
 ,
 ,
where ′ is the derivative with respect to time, and the other parameters are summarized in Table 1.
J. Clin. Med. 2020, 9, 462 5 of 13

 Table 1. Parameter estimates for 2019‐nCoV in Wuhan, China.
Parameter Definitions Estimated Mean Standard Data
 Value Deviation Source
 Contact rate 14.781 0.904 MCMC
 Probability of transmission per contact 2.1011 10 1.1886 10 MCMC
 Quarantined rate of exposed individuals 1.8887 10 6.3654 10 MCMC
 Transition rate of exposed individuals to the infected 1/7 – WHO
 class
 Rate at which the quarantined uninfected contacts were 1/14 – [18,19]
 released into the wider community
 Probability of having symptoms among infected 0.86834 0.049227 MCMC
 individuals
 Transition rate of symptomatic infected individuals to 0.13266 0.021315 MCMC
 the quarantined infected class
 Transition rate of quarantined exposed individuals to the 0.1259 0.052032 MCMC
 quarantined infected class
 Recovery rate of symptomatic infected individuals 0.33029 0.052135 MCMC
 Recovery rate of asymptomatic infected individuals 0.13978 0.034821 MCMC
 Recovery rate of quarantined infected individuals 0.11624 0.038725 MCMC
 Disease‐induced death rate 1.7826 10 6.8331 10 MCMC
Initial Definitions Estimated Mean Standard Data
Values Value Deviation Source
 0 Initial susceptible population 11,081,000 – [18]
 0 Initial exposed population 105.1 35.465 MCMC
 0 Initial symptomatic infected population 27.679 11.551 MCMC
 0 Initial asymptomatic infected population 53.839 25.25 MCMC
 0 Initial quarantined susceptible population 739 – [18]
 0 Initial quarantined exposed population 1.1642 0.20778 MCMC
 0 Initial quarantined infected population 1 – [18]
 0 Initial recovered population 2 – [18]
 Markov Chain Monte Carlo (MCMC); World Health Organization (WHO).

2.3. Model‐Based Method for Estimation
 Given the model structure with quarantine and isolation (Figure 2), we used the next generation
matrix [21,22] to derive a formula for the control reproduction number when control measures are in
force, as follows:

 1 1 1
 (2)

 We used the Markov Chain Monte Carlo (MCMC) method to fit the model and adopted an
adaptive Metropolis–Hastings (M‐H) algorithm to carry out the MCMC procedure. The algorithm is
run for 100,000 iterations with a burn‐in of the first 70,000 iterations, and the Geweke convergence
diagnostic method is employed to assess convergence of chains.

2.3. Likelihood‐Based Method for Estimation
 We employed the likelihood‐based method or generation interval‐informed method of White
and Pagano [23], using the following formula:

 exp
 , | (3)
 Γ 1

where ∑ , k is the maximum value of the serial interval (chosen as 6 here)
and x is the gamma function. , , … , , where denotes the total number of
cases on day j and T is the last day of observations. p is the probability function for the
generation interval on day j. We assume that the generation interval follows a gamma
distribution with mean and variance . Since the generation interval of the 2019‐nCoV is
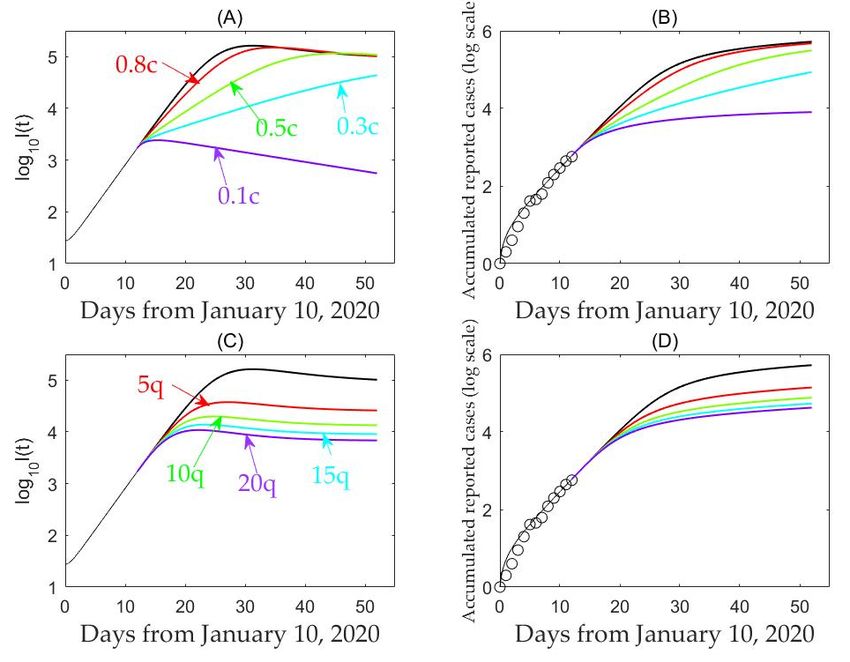
J. Clin. Med. 2020, 9, 462 6 of 13

undetermined, we investigated the sensitivity of to different values ranging from 2 to 8
days (given in Table 2).

 Table 2. Estimation of the basic reproduction number for 2019‐nCoV in Wuhan, China.

 R0 V = 2(dataRev1) V = 3(dataRev1) V = 2(dataRev2) V = 3(dataRev2)
 E=2 1.4546 1.6560 1.4545 1.6554
 E=3 1.7459 1.7155 1.7456 1.7145
 E=4 2.5828 2.4462 2.5815 2.4427
 E=5 3.9893 3.7134 3.9802 3.6956
 E=6 6.3901 5.8303 6.3164 5.7304
 E=7 10 9.2564 9.6409 8.7299
 E=8 10 10 10 10
 E: mean value of Gamma distribution, V: Deviation of Gamma distribution dataRev1: [1 2 3 4 6 9 12
 20 28 41 45 62 121 198 291 440 571]; dataRev2: [1 2 3 4 6 9 12 20 28 41 41 41 41 41 41 45 62 121 198 291
 440 571].

2.4. Simulation
 The population of Wuhan is around 11,081,000 inhabitants [18], hence, we set 0
11,081,000. As of 10 January 2020, two patients had been recovered and were subsequently
discharged from the hospital leading to 0 2, and 739 individuals were quarantined leading to
 0 739. We set 0 1, corresponding to the reported confirmed case on 10 January 2020.
The quarantined individuals were isolated for 14 days, thus 1/14. According to the WHO [24],
the incubation period of 2019‐nCoV is about 7 days, hence 1/7.

3. Results

3.1. Likelihood‐Based Estimates
 Likelihood‐based estimation of during the outbreak in Wuhan gives a mean value of 6.39
with mean and variance of generation time of 6 and 2 days on the basis of a revised data series
(dataRev1). The reproduction number based on likelihood‐based estimation ranges from 1.66 to 10
and it follows from Table 2 that is sensitive to changes in mean generation intervals. Fitting to
the other revised data series (dataRev2) gives a mean value of 6.32 with mean and variance of
generation time of 6 and 2 days. Note that the estimates of based on the two time series agree
well, and consequently, both revised data series can be used to fit the proposed dynamics
transmission model. In this study, we chose the estimations based on dataRev1 as the comparison
reference to verify and validate our model‐based estimation. Thus, in the following sections of the
manuscript, we will use the revised dataset (dataRev1) to fit the proposed model.

3.2. Model‐Based Estimates
 By fitting the model without considering asymptomatic infections to the data of hospital
notification for the confirmed 2019‐nCoV cases (dataRev1), we estimated the mean control
reproductive number to be 6.47 (95% CI 5.71–7.23), whereas other parameter estimations are
reported in Table 1. Note that the mean estimations of based on the likelihood method are within
the 95% confidence interval of the model‐based estimates (Table 2).
 Using the estimated parameter values, we predicted the trend of the 2019‐nCoV infection.
Under the current intervention (before 22 January 2020), the number of infected individuals (I(t)) is
expected to peak on around 10 March 2020, with a peak size of 1.63 10 infectious individuals.
 To examine the possible impact of enhanced interventions on disease infections, we plotted the
number of infected individuals (I(t)) and the predicted cumulative number of reported cases with
varying quarantine rate and contact rate . This analysis shows that reducing the contact rate
persistently decreases the peak value but may either delay or bring forward the peak, as shown in
Figure 3 and Table 3.
J. Clin. Med. 2020, 9, 462 7 of 13

 Table 3. The effects of travel restrictions on the peak time and peak value.

 Parameter . . . .
 Peak Time 19.3 days 22.6 days 33.8 days 61.3 days 3.4 days
 Value of at peak time 1.63 10 1.5 10 1.15 10 6.68 10 2.42 10
 Parameter 5 10 15 20
 Peak time 19.3 days 15.1 days 12.8 days 11.4 days 10.3 days
 Value of at peak time 1.63 10 3.76 10 1.98 10 1.38 10 1.08 10
 Note that the baseline values are (c, q) = (14.78, 1.88 × 10⁻⁷).

 Figure 3. Sensitivity analyses with respect to contact rate, c (A, B), and quarantine rate, q (C,D), on
 the log number of infected individuals and cumulative reported cases.

 In more detail, our analysis shows that increasing quarantine rate, q, by 10 or 20 times will bring
forward the peak by 6.5 or 9 days, and lead to a reduction of the peak value in terms of the number
of infected individuals by 87% or 93%. This indicates that enhancing quarantine and isolation
following contact tracing and reducing the contact rate can significantly lower the peak and reduce
the cumulative number of predicted reported cases (Figure 4).
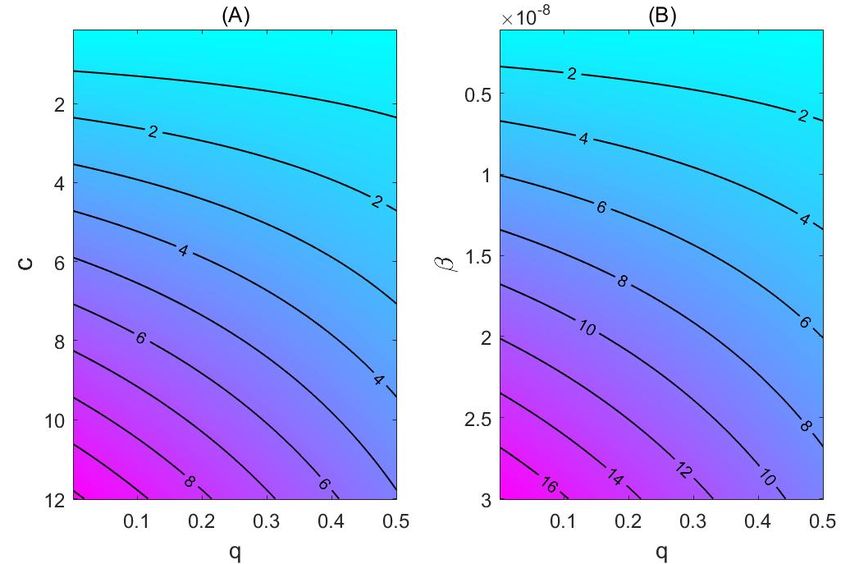
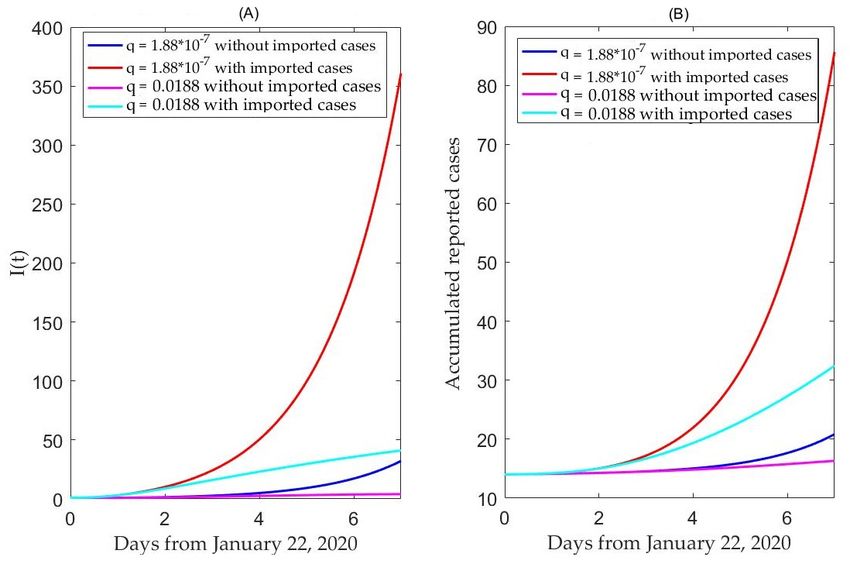
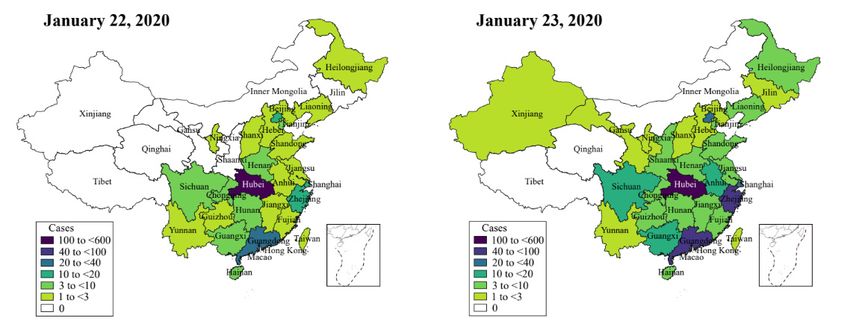
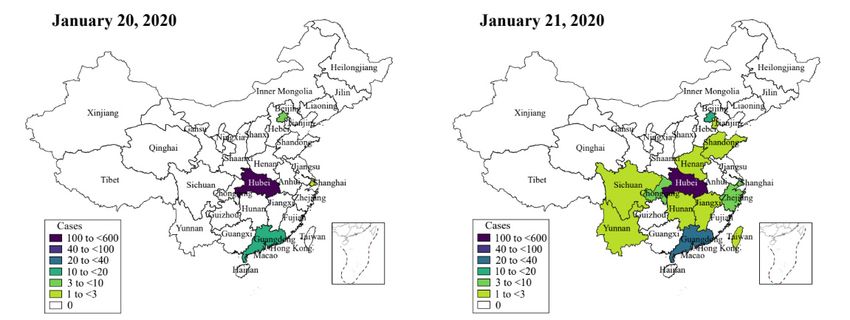
J. Clin. Med. 2020, 9, 462 8 of 13

 Figure 4. Contour plot of R_c, with the parameter of baseline transmission probability and the
 contact rate, c (A), or the quarantine rate, q (B). (B) shows that a higher transmission probability of
 the virus will significantly increase the basic reproduction number.

 Considering the spreading of the virus (Figure 5), and in order to examine the impact of the
travel restriction on the infection in other cities such as Beijing, we initially calculated the daily
number of exposed individuals imported from Wuhan to Beijing, denoted by Ime(t).

 Figure 5. Heat‐map showing the spreading of the Coronavirus infection.
J. Clin. Med. 2020, 9, 462 9 of 13

 According to our model, we get the exposed fraction as of 22 January 2020: approximately
40,000 persons from Wuhan to Beijing via trains (around 37,000) and flights (around 3000) [25], then,
we have:

 Ime(t) = 40,000 ∙ E(t)/N (4)

with 40 individuals being imported exposed individuals as of 22 January 2020. However, there
could potentially exist an ascertainment bias in reported case data, since cases may have been larger
than 40 individuals but have not been reported or reported with a delay in time.
 We find that with travel restriction (no imported exposed individuals to Beijing), the number of
infected individuals in seven days will decrease by 91.14% in Beijing, compared with the scenario of
no travel restriction, while, given no travel restriction, the number of infected individuals in seven
days will decrease by 88.84% only if we increase the quarantine rate by 100 thousand times, as
shown in Figure 6A. This means that the effect of a travel restriction in Wuhan on the 2019‐nCoV
infection in Beijing is almost equivalent to increasing quarantine by a 100 thousand baseline value,
which is a rate that can hardly be achieved in any public health setting. It follows from Figure 6B that
with travel restriction, the number of cumulative individuals in seven days will significantly
decrease (by 75.70%) in Beijing, compared with the scenario of no travel restriction.

 Figure 6. The effects of no travel restrictions (A) versus travel restriction (B) in the Hubei Province on
 the Coronavirus disease in Beijing city.

4. Discussion
 Based on the 2019‐nCoV cases’ data until 22 January 2020, we have estimated the basic
reproduction numbers using different methods (likelihood‐based and model‐based approaches).
The mean control reproduction number was estimated to be as high as 6.47 (95% CI 5.71–7.23), in
comparison with the values of the SARS epidemics (R0 = 4.91) in Beijing, China, in 2003 [26], and
MERS in Jeddah (R0 = 3.5–6.7) and Riyadh (R0 = 2.0–2.8), Kingdom of Saudi Arabia, in 2014 [27].
 Our value is higher than other published estimates (for instance, Reference [28]). Such a high
reproduction number is consistent with the opinion that the virus has gone through at least
three–four generations of transmission in the period covered by this study [24]. Note that our
J. Clin. Med. 2020, 9, 462 10 of 13

estimation is based on a dataset collected during a period of intensive social contacts. Before the
Chinese New Year (25 January 2020), there were lots of annual summing‐up meetings and/or
parties, with higher than usual close contacts, leading to a higher likelihood of infection transmission
than that of the earlier periods covered by other studies. Furthermore, we noted that more recently
published studies based on datasets during periods comparable with ours reported similar findings
in terms of a high basic reproduction number (for instance, Reference [29], where authors, using an
exponential growth method, computed a basic reproduction number of 6.11 (95% CI 4.51–8.16),
assuming no changes in reporting rate and with a serial interval of 8.4 ± 3.8 days). Variability in the
estimation of the basic reproduction number is also a well‐known methodological issue, and
standardized methods both for calculating and reporting it are still lacking [30]. During the initial
phases of an epidemics outbreak, only small datasets/time‐points can be used. Some crucial
information may be missing, and the quality, accuracy and reliability of data improves over time. In
these situations, estimations are highly dependent on the specific datasets utilized and
revising/updating such datasets could influence the results. We note that several key clinical
parameters could be inferred from relevant clinical data based on sero‐epidemiological surveys, and
the possibility of spreading the infection from asymptomatic cases was only reported recently [31].
 Our finding of a high reproduction number implies the potential of a very serious epidemic
unless rather swift public health interventions are implemented [32,33], during the season when the
social contacts is the highest.
 Note that the serial interval is an essential factor affecting the accuracy of the likelihood
function estimation. According to the current report, the incubation period of Wuhan patients with
coronavirus pneumonia is about 2 to 15 days. We then assume that the serial interval follows the
gamma distribution with varying mean and variance, which allows us to examine the influence on
the reproduction number. With the distribution of serial interval with mean 6 days and variance 2
days, the likelihood‐based estimation of the reproduction number is consistent with the
model‐based estimation. It shows that longer serial intervals induce greater reproduction numbers,
and hence, more new infections, which further confirms that the epidemic may be more serious than
what has been reported until now [15].
 Based on the reported data, we have estimated that the number of people who were identified
through contact tracing and quarantined was 5897, as of 22 January 2020. In comparison with the
total population size of Wuhan, the effort of close contact tracing and quarantine was insufficient
and appears to have a limited impact in terms of reducing the number of infected cases and/or
slowing down the epidemic. The contour plot of R_c = 1 gives the threshold values of contact rate
and quarantine rate for a city to avoid an outbreak. This high threshold rate of quarantine puts an
extremely high requirement for the city’s public health infrastructure and its citizens’ adherence to
personal protective and public health interventions, including a reduction of transmission‐effective
contacts, separation and restriction during the quarantine.
 Such a high level of quarantine rate and reduction of contact is possible only when the number
of imported cases from the epicenter is minimal, speaking in terms of the value of the travel
restriction. A strict travel restriction to the city of Wuhan is expensive and resource‐consuming,
imposing a substantial challenge to the decision‐ and policy‐makers and the city’s resilience.
Moreover, such a measure could only delay the transmission of the infectious disorder.
 In conclusion, our simulations show that the appropriate duration of this travel restriction
depends on a combination of effective quarantine and reduction of contact within the city.
 Considering the latest events (the lock‐down of Wuhan on 23 January 2020, the adoption of the
travel restriction strategy by other regions and provinces, the introduction of new detection
technologies, etc.), the present model needs to be revised in that the basic reproduction number
estimated here is no longer suitable for predicting future epidemic trends (Table 4). This will be the
aim of a forthcoming article.
J. Clin. Med. 2020, 9, 462 11 of 13

 Table 4. Predictions of the confirmed cases.

 Date 01/23 01/24 01/25 01/26 01/27 01/28 01/29
 Predicted confirmed cases 876 1266 1828 2634 3784 5419 7723
 Predicted confirmed cases (reduced contact by 50%) 868 1207 1624 2128 2736 3464 4335
 Predicted confirmed cases (reduced contacts by 90%) 862 1163 1480 1802 2120 2430 2731
 Real data of confirmed cases 830 1287 1975 2744 4515 5974 7711

5. Conclusions
 Coronaviruses occasionally lead to major outbreaks, with documented reproduction numbers
ranging from 2.0 to 4.9. Currently, a fourth large‐scale outbreak is occurring and spreading out from
Wuhan, Hubei province, China, to neighboring provinces and other countries. There is a dearth of
epidemiological data about the emerging coronavirus, which would be of crucial importance to
design and implement timely, ad hoc effective public health interventions, such as contact tracing,
quarantine and travel restrictions. In this study, we adopted a deterministic model to shed light on
the transmission dynamics of the novel coronavirus and assess the impact of public health
interventions on infection. We found that the basic reproduction number could be as high as 6.47
(95% CI 5.71–7.23), which seems consistent with the special period prior to the Spring Festival when
contacts were higher than usual, and with the opinion that the virus has gone through at least
three–four generations. It is worth mentioning that our model made a very good prediction of the
confirmed cases from 23 to 29 January 2020, as shown in Table 4. Particularly, the predicted
confirmed cases should be 7723 as of 29 January 2020, which is very close to the real number of cases
of 7711. Furthermore, according to our model, the outbreak, under the most restrictive measures, is
expected to peak within two weeks (since 23 January 2020), with a significant low peak value. Our
investigation has major practical implications for public health decision‐ and policy‐makers. The
rather high reproduction number suggests that the outbreak may be more serious than what has
been reported so far, given the particular season of increasing social contacts, warranting effective,
strict public health measures aimed to mitigate the burden generated by the spreading of the new
virus.
Author Contributions: Conceptualization, S.T., Y.X. and J.W.; methodology, S.T., Y.X. and J.W.; software, B.T.,
X.W., Q.L. and S.T.; validation, S.T., Y.X. and J.W.; formal analysis, B.T., X.W., Q.L. and S.T.; investigation, S.T.,
Y.X. and J.W.; resources, B.T., X.W., Q.L. and S.T.; data curation, B.T., X.W., Q.L. and S.T.; writing—original
draft preparation, B.T., X.W., Q.L., N.L.B. and S.T.; writing—review and editing, N.L.B., S.T., Y.X. and J.W.;
visualization, J.W.; supervision, J.W.; project administration, J.W.; funding acquisition, J.W. All authors have
read and agreed to the published version of the manuscript.

Funding: This research was funded by the National Natural Science Foundation of China (grant numbers:
11631012 (YX, ST), 61772017 (ST)), and by the Canada Research Chair Program (grant number: 230720 (JW) and
the Natural Sciences and Engineering Research Council of Canada (Grant number: 105588‐2011 (JW).

Conflicts of Interest: The authors declare no conflict of interest.

References
1. Chen, Y.; Liu, Q.; Guo, D. Coronaviruses: Genome structure, replication, and pathogenesis. J. Med. Virol.
 2020, doi:10.1002/jmv.25681.
2. Kahn, J.S.; McIntosh, K. History and recent advances in coronavirus discovery. Pediatr. Infect. Dis. J. 2005,
 24, S223–227.
3. Hui, D.S.C.; Zumla, A. Severe acute respiratory syndrome: Historical, epidemiologic, and clinical features.
 Infect. Dis. Clin. North Am. 2019, 33, 869–889.
4. de Wit, E.; van Doremalen, N.; Falzarano, D.; Munster, V.J. SARS and MERS: Recent insights into
 emerging coronaviruses. Nat. Rev. Microbiol. 2016, 14, 523–534.
5. Killerby, M.E.; Biggs, H.M.; Midgley, C.M.; Gerber, S.I.; Watson, J.T. Middle East respiratory syndrome
 coronavirus transmission. Emerg. Infect. Dis. 2020, 26, 191–198.
J. Clin. Med. 2020, 9, 462 12 of 13

6. Kim, K.H.; Tandi, T.E.; Choi, J.W.; Moon, J.M.; Kim, M.S. Middle East respiratory syndrome coronavirus
 (MERS‐CoV) outbreak in South Korea, 2015: Epidemiology, characteristics and public health implications.
 J. Hosp. Infect. 2017, 95, 207–213.
7. Willman, M.; Kobasa, D.; Kindrachuk, J. A Comparative analysis of factors influencing two outbreaks of
 middle eastern respiratory syndrome (MERS) in Saudi Arabia and South Korea. Viruses 2019, 11, E1119.
8. Kwok, K.O.; Tang, A.; Wei, V.W.I.; Park, W.H.; Yeoh, E.K.; Riley, S. Epidemic models of contact tracing:
 Systematic review of transmission studies of severe acute respiratory syndrome and Middle East
 respiratory syndrome. Comput. Struct. Biotechnol. J. 2019, 17, 186–194.
9. Cohen, J.; Normile, D. New SARS‐like virus in China triggers alarm. Science 2020, 367, 234–235.
10. Lu, H.; Stratton, C.W.; Tang, Y.W. Outbreak of pneumonia of unknown etiology in Wuhan China: The
 mystery and the miracle. J. Med. Virol. 2020, doi:10.1002/jmv.25678.
11. Parry J. China coronavirus: Cases surge as official admits human to human transmission. BMJ 2020, 368,
 m236.
12. World Health Organization (WHO). Coronavirus. Available online: https://www.who.int/health‐topics
 /coronavirus (accessed on 23 January 2020).
13. Egger, M.; Johnson, L.; Althaus, C.; Schöni, A.; Salanti, G.; Low, N.; Norris, S.L. Developing WHO
 guidelines: Time to formally include evidence from mathematical modelling studies. F1000Res. 2017, 6,
 1584.
14. Chen, T.; Rui, J.; Wang, Q.; Zhao, Z.; Cui, J‐A.; Yin, L. A mathematical model for simulating the
 transmission of Wuhan novel coronavirus. bioRxiv 2020, doi: 10.1101/2020.01.19.911669v1.
15. Imai, N.; Dorigatti, I.; Cori, A.; Donnelly, C.; Riley, S.; Ferguson, N.M. Report 2: Estimating the Potential
 Total Number of Novel Coronavirus Cases in Wuhan City, China. Available online:
 https://www.imperial.ac.uk/media/imperial‐college/medicine/sph/ide/gida‐fellowships/2019‐nCoV‐outbr
 eak‐report‐22‐01‐2020.pdf (accessed on 23 January 2020).
16. World Health Organization (WHO). Novel Coronavirus—China, Disease Outbreak News: Update.
 Available online: https://www.who.int/csr/don/12‐january‐2020‐novel‐coronavirus‐china/en/ (accessed on
 23 January 2020).
17. World Health Organization (WHO). Situation Report. Available online:
 https://www.who.int/docs/default‐source/coronaviruse/situation‐reports/20200123‐sitrep‐3‐2019‐ncov.pdf
 (accessed on 23 January 2020).
18. Health Commission of Hubei Province. Available online: http://wjw.hubei.gov.cn/bmdt/ztzl/
 fkxxgzbdgrfyyq/ (accessed on 23 January 2020).
19. National Health Commission of the People’s Republic of China. Available online:
 http://www.nhc.gov.cn/xcs/xxgzbd/gzbd_index.shtml (accessed on 23 January 2020).
20. Castillo‐Chavez, C.; Castillo‐Garsow, C.W.; Yakubu, A. Mathematical models of isolation and quarantine.
 JAMA 2003, 290, 2876–2877.
21. Tang, S.; Xiao, Y.; Yang, Y.; Zhou, Y.; Wu, J.; Ma, Z. Community‐based measures for mitigating the 2009
 H1N1 pandemic in China. PLoS ONE 2010, 5, e10911.
22. Xiao, Y.; Tang, S.; Wu, J. Media impact switching surface during an infectious disease outbreak. Sci. Rep.
 2015, 5, 7838.
23. White, L.F.; Pagano, M. A likelihood‐based method for real‐time estimation of the serial interval and
 reproductive number of an epidemic. Stat. Med. 2008, 27, 2999–3016.
24. World Health Organization (WHO). Available online:
 https://www.who.int/news‐room/detail/23‐01‐2020‐statement‐on‐the‐meeting‐of‐the‐international‐health‐
 regulations‐(2005)‐emergency‐committee‐regarding‐the‐outbreak‐of‐novel‐coronavirus‐(2019‐ncov)
 (accessed on 23 January 2020).
25. Bogoch, I.I.; Watts, A.; Thomas‐Bachli, A.; Huber, C.; Kraemer, M.U.G.; Khan, K. Pneumonia of unknown
 etiology in Wuhan, China: Potential for international spread via commercial air travel. J. Travel Med. 2020,
 doi:10.1093/jtm/taaa008.
26. Gumel, A.B.; Ruan, S.G.; Day, T.; Watmough, J.; Brauer, F.; van den Driessche, P.; Gabrielson, D.; Bowman,
 C.; Alexander, M.E.; Ardal, S.; et al. Modelling strategies for controlling SARS outbreaks, Proc. R. Soc. Lond.
 B. 2004, 271, 2223–2232.
J. Clin. Med. 2020, 9, 462 13 of 13

27. Majumder, M.S.; Rivers, C.; Lofgren, E.; Fisman, D. Estimation of MERS‐Coronavirus reproductive
 number and case fatality rate for the Spring 2014 Saudi Arabia outbreak: Insights from publicly available
 data. PLoS Curr. 2014, 18, 6.
28. Li, Q.; Guan, X.; Wu, P.; Wang, X.; Zhou, L.; Tong, Y.; Ren, R.; Leung, K.S.M.; Lau, E.H.Y.; Wong, J.Y.; et al.
 Early transmission dynamics in Wuhan, China, of novel coronavirus‐infected pneumonia. N. Engl. J. Med.
 2020, doi:10.1056/NEJMoa2001316.
29. Zhao, S.; Lin, Q.; Ran, J.; Musa, S.S.; Yang, G.; Wang, W.; Lou, Y.; Gao, D.; Yang, L.; He, D.; et al.
 Preliminary estimation of the basic reproduction number of novel coronavirus (2019‐nCoV) in China, from
 2019 to 2020: A data‐driven analysis in the early phase of the outbreak. Int. J. Infect. Dis. 2020,
 doi:10.1016/j.ijid.2020.01.050.
30. Guerra, F.M.; Bolotin, S.; Lim, G.; Heffernan, J.; Deeks, S.L.; Li, Y.; Crowcroft, N.S. The basic reproduction
 number (R0) of measles: A systematic review. Lancet Infect. Dis. 2017, 17, e420–e428.
31. Rothe, C.; Schunk, M.; Sothmann, P.; Bretzel, G.; Froeschl, G.; Wallrauch, C.; Zimmer, T.; Thiel, V.; Janke,
 C.; Guggemos, W.; et al. Transmission of 2019‐nCoV infection from an asymptomatic contact in Germany.
 N. Engl. J. Med. 2020, doi:10.1056/NEJMc2001468.
32. Hui, D.S.; Azhar, E.E.I.; Madani, T.A.; Ntoumi, F.; Kock, R.; Dar, O.; Ippolito, G.; Mchugh, T.D.; Memish,
 Z.A.; Drosten, C.; et al. The continuing 2019‐nCoV epidemic threat of novel coronaviruses to global
 health‐The latest 2019 novel coronavirus outbreak in Wuhan, China. Int. J. Infect. Dis. 2020, 91, 264–266.
33. Cheng, V.C.C.; Wong, S.C.; To, K.K.W.; Ho, P.L.; Yuen, K.Y. Preparedness and proactive infection control
 measures against the emerging Wuhan coronavirus pneumonia in China. J. Hosp. Infect. 2020,
 doi:10.1016/j.jhin.2020.01.010.

 © 2020 by the authors. Licensee MDPI, Basel, Switzerland. This article is an open access
 article distributed under the terms and conditions of the Creative Commons Attribution
 (CC BY) license (http://creativecommons.org/licenses/by/4.0/).
You can also read