NICOTINAMIDE DEFICIENCY IN PRIMARY OPEN-ANGLE GLAUCOMA - bioRxiv
←
→
Page content transcription
If your browser does not render page correctly, please read the page content below
bioRxiv preprint first posted online Mar. 9, 2019; doi: http://dx.doi.org/10.1101/571638. The copyright holder for this preprint
     (which was not peer-reviewed) is the author/funder, who has granted bioRxiv a license to display the preprint in perpetuity.
                                  It is made available under a CC-BY-NC-ND 4.0 International license.

 1          NICOTINAMIDE DEFICIENCY IN PRIMARY OPEN-ANGLE
 2                            GLAUCOMA
 3     Judith Kouassi Nzoughet1, Juan Manuel Chao de la Barca1,2, Khadidja Guehlouz3, Stéphanie
 4     Leruez3, Laurent Coulbault4, Stéphane Allouche4, Cinzia Bocca1, Jeanne Muller3, Patrizia
 5     Amati-Bonneau1,2, Philippe Gohier3, Dominique Bonneau1,2, Gilles Simard2, Dan Milea5, Guy
 6     Lenaers1, Vincent Procaccio1,2, Pascal Reynier1,2

       1
 7         Equipe Mitolab, Unité Mixte de Recherche MITOVASC, CNRS 6015, INSERM U1083,
 8     Université d'Angers, Angers, France
       2
 9         Département de Biochimie et Génétique, Centre Hospitalier Universitaire, Angers, France
       3
10         Département d’Ophtalmologie, Centre Hospitalier Universitaire, Angers, France
       4
11         Service de Biochimie, EA4650, Centre Hospitalier Universitaire, Caen, France
       5
12         Singapore Eye Research Institute, Singapore National Eye Centre, Duke-NUS, Singapore
13
14     Correspondence to: Judith Kouassi Nzoughet, PhD, Equipe Mitolab, Institut MITOVASC,
15     UMR CNRS 6015, INSERM U1083, 4 rue Larrey, 49933 Angers cedex 9, Angers, France; Tel:
16     +33 (0) 244688412; Email: judith.kouassinzoughet@univ-angers.fr

17     Keywords: Primary open-angle glaucoma; Metabolomics; Mitochondrial dysfunction;
18     Nicotinamide; Vitamin B3; Nicotinamide adenine dinucleotide; NAD; Optic nerve; Optic
19     neuropathy.
20
21     Abbreviations and acronyms: BMI: body mass index; CCT: central corneal thickness; CPP:
22     comité de protection des personnes; HESI: heated electrospray ionization; HRMS: high
23     resolution mass spectrometry; IOP: intraocular pressure; IS: internal standard; LC: liquid
24     chromatography; MRM: Multiple Reaction Monitoring; NAD: Nicotinamide adenine
25     dinucleotide; NM: Nicotinamide;         NM-d4 : nicotinamide-d4; OCT: optical coherence
26     tomography; PFP: pentafluorophenyl; POAG: primary open-angle glaucoma; RGC: retinal
27     ganglion cell; RNFL: retinal nerve fibre layer; VF-MD: visual field mean defect.
28
29     Word count: Title: 54 characters including spaces; Short title: 36 characters including spaces;
30     Abstract: 241 words; Total word count excluding title page, figure legends and references:
31     3289 words; Figure: 1; Tables: 2; Supplementary file: 1.
32
33     Short title: Nicotinamide deficiency in glaucoma
34

                                                                                                                                        1
bioRxiv preprint first posted online Mar. 9, 2019; doi: http://dx.doi.org/10.1101/571638. The copyright holder for this preprint
(which was not peer-reviewed) is the author/funder, who has granted bioRxiv a license to display the preprint in perpetuity.
It is made available under a CC-BY-NC-ND 4.0 International license.
35 ABSTRACT
36 Purpose: To investigate the plasma concentration of nicotinamide in primary open-angle
37 glaucoma (POAG).
38
39 Methods: Plasma of 34 POAG individuals were compared to that of 30 age- and sex-matched
40 controls using a semi-quantitative method based on liquid chromatography coupled to high-
41 resolution mass spectrometry. Subsequently, an independent quantitative method, based on
42 liquid chromatography coupled to mass spectrometry, was used to assess nicotinamide
43 concentration in the plasma from the same initial cohort and from a replicative cohort of 20
44 POAG individuals and 15 controls.
45
46 Results: Using the semi-quantitative method, the plasma nicotinamide concentration was
47 significantly lower in the initial cohort of POAG individuals compared to and further confirmed
48 in the same cohort, using the targeted quantitative method, with mean concentrations of 0.14 µM
49 (median: 0.12 µM; range: 0.06-0.28 µM) in the POAG group (-30 %; p = 0.022), and 0.19 µM
50 (median: 0.18 µM; range: 0.08-0.47 µM) in the control group. The quantitative dosage also
51 disclosed a significantly lower plasma nicotinamide concentration (-33 %; p = 0.011) in the
52 replicative cohort with mean concentrations of 0.14 µM (median: 0.14 µM; range: 0.09-0.25
53 µM) in the POAG group, and 0.19 µM (median: 0.21 µM; range: 0.09-0.26 µM) in the control
54 group.
55
56 Conclusions: Glaucoma is associated with lower plasmatic nicotinamide levels, compared to
57 controls, suggesting that nicotinamide supplementation might become a future therapeutic
58 strategy. Further studies are needed, in larger cohorts, to confirm these preliminary findings.
2bioRxiv preprint first posted online Mar. 9, 2019; doi: http://dx.doi.org/10.1101/571638. The copyright holder for this preprint
(which was not peer-reviewed) is the author/funder, who has granted bioRxiv a license to display the preprint in perpetuity.
It is made available under a CC-BY-NC-ND 4.0 International license.
59 INTRODUCTION
60 Glaucoma, the leading cause of irreversible blindness worldwide, is due to a progressive optic
61 neuropathy involving the loss of retinal ganglion cells (RGCs) 1. Although age and increased
62 intraocular pressure (IOP) are the main risk factors of the disease, other factors may contribute
63 to the occurrence and progression of glaucoma, such as genetic variants, which account for
64 approximately 5 % of the cases, together with vascular impairment, and metabolic disturbances
2
65 .
66 Since the local absence of myelinated axons in the intraocular portion of the optic nerve leads to
67 high energy requirements, the question of mitochondrial dysfunction has been raised in
68 glaucoma similarly to what is observed in hereditary optic neuropathies 3. Indeed, several studies
4,5
69 have revealed a true respiratory chain deficiency in glaucoma . The central role of
70 mitochondrial dysfunction was recently demonstrated in a DBA/2J mouse model of glaucoma
6,7
71 with high IOP . These authors highlighted decreased retinal levels of nicotinamide adenine
72 dinucleotide (NAD), an essential oxidation-reduction cofactor, and showed that the oral
73 administration of high doses of nicotinamide, a precursor of NAD, structurally and functionally
74 prevented the loss of RGCs, posing the rationale for a translational application in humans 8.
75
76 Nicotinamide, also known as vitamin B3 or PP (pellagra-preventive) vitamin, is a water-soluble
77 vitamin, the deficiency of which causes pellagra, a systemic condition associating diarrhoea,
78 dermatitis and dementia, and ultimately leading to death. Despite its potential role in the
79 pathogenesis of glaucoma, no study to our knowledge has yet established the involvement of
80 nicotinamide in individuals with primary open-angle glaucoma (POAG) 9.
81
3bioRxiv preprint first posted online Mar. 9, 2019; doi: http://dx.doi.org/10.1101/571638. The copyright holder for this preprint
(which was not peer-reviewed) is the author/funder, who has granted bioRxiv a license to display the preprint in perpetuity.
It is made available under a CC-BY-NC-ND 4.0 International license.
82 To gain insight into the pathophysiology of POAG, we applied a non-targeted metabolomics
83 approach, based on liquid chromatography coupled to high resolution mass spectrometry (LC-
84 HRMS) 10, to compare the plasma of individuals with POAG and controls. This study, showing
85 that nicotinamide was the most discriminating metabolite of the signature, led us to investigate
86 the plasma concentration of nicotinamide in individuals with POAG, as reported here.
87
88 METHODS
89 Ethics Statement
90 Participants were included in the study after having given their informed written consent for the
91 research. The study was conducted according to the ethical standards of the Helsinki Declaration
92 and its later amendments, and with the approval of the University of Angers ethical committee
93 (Comité de Protection des Personnes (CPP) OUEST 2), agreement number: CB 2013-04.
94
95 Study participants
96 Individuals were recruited from the Department of Ophthalmology of Angers University
97 Hospital, France. The initial diagnosis of POAG was based on consensual criteria, i.e.
98 glaucomatous optic nerve damage with progressive optic disc cupping, associated with an IOP
99 >21 mmHg 11. All the patients with POAG had an elevated IOP at the time of initial diagnosis,
100 as well as open irido-corneal angles, as determined by gonioscopic examination. Individuals
101 with isolated ocular hypertension, normal tension glaucoma, or any secondary form of
102 glaucoma, were excluded from the study. Standard automated perimetry (Humphrey field
103 analyser, Carl Zeiss, Dublin, CA, USA) with the 24-2 SITA-Fast algorithm was performed on
104 all individuals with POAG, and values of the visual field mean defect (VF-MD) were used to
105 grade the severity of POAG as “mild” with values lower than -6 dB, “moderate” with values
4bioRxiv preprint first posted online Mar. 9, 2019; doi: http://dx.doi.org/10.1101/571638. The copyright holder for this preprint
(which was not peer-reviewed) is the author/funder, who has granted bioRxiv a license to display the preprint in perpetuity.
It is made available under a CC-BY-NC-ND 4.0 International license.
106 between -6 dB and -12 dB, and “severe” with values higher than -12 dB (perimetric Hoddap-
107 Parrish-Anderson criteria). The reliability indices retained were false positive or false negative
108 rates under 15 %, and fixation losses under 20 %. The other tests performed on patients with
109 POAG included evaluation of the thickness of the retinal nerve fibre layer (RNFL), using
110 spectral domain optical coherence tomography (OCT), and measurement of the central corneal
111 thickness (CCT) (Cirrus OCT, Carl Zeiss Meditec, Dublin, CA, USA). The best-corrected visual
112 acuity was measured using the Monoyer decimal charts, with the results converted into logMAR
113 units for statistical analysis. The IOP was measured using the Goldmann applanation tonometer.
114 The history of glaucoma treatment was documented.
115
116 Control subjects were selected among healthy individuals undergoing cataract surgery at the
117 same Department of Ophthalmology. Their inclusion criteria were: visual acuity ≥ 20/50 and the
118 absence of any other associated ocular condition, excepting cataract. The exclusion criteria
119 were: a family history of glaucoma, ocular hypertension or any other intraocular pathology,
120 including retinal disorders.
121
122 Our study was carried out on two distinct cohorts recruited from the Department of
123 Ophthalmology of Angers University Hospital. The first cohort, referred as the “initial cohort”,
124 was composed of 34 individuals with POAG and 30 controls, and the second cohort, referred as
125 the “replicative cohort”, was composed of 20 individuals with POAG and 15 controls. The
126 initial cohort was subjected to a non-targeted metabolomics study, which led to the discovery of
127 nicotinamide deficiency. This was followed by a quantitative analysis as developed in the
128 Department of Biochemistry of Caen University Hospital, France. The replicative cohort was
129 used only for the specific quantitative analysis of nicotinamide.
5bioRxiv preprint first posted online Mar. 9, 2019; doi: http://dx.doi.org/10.1101/571638. The copyright holder for this preprint
(which was not peer-reviewed) is the author/funder, who has granted bioRxiv a license to display the preprint in perpetuity.
It is made available under a CC-BY-NC-ND 4.0 International license.
130
131 Blood samples from each participant were collected in heparin tubes at least three hours after the
132 last meal. The transfer of the blood tubes was carried out according to a very strict protocol,
133 securing the fastest possible storage at -80 degrees C. Thus, after blood sampling, the tubes were
134 immediately transported on ice to the certified Biological Resource Center (Hospital of Angers),
135 where they were immediately processed for centrifugation (10 minutes at 3000 g at +4 °C) to
136 recover the supernatant (plasma), which was aliquoted in 500 microliter aliquots, and
137 immediately stored at -80°C until further analysis. The delay between sampling and storage was
138 less than one hour for every included subject.
139
140 Non-targeted semi-quantitative LC-HRMS nicotinamide analysis of plasma samples from
141 the initial cohort
142 The non-targeted LC-HRMS analysis was performed according to a method designed for the
10
143 semi-quantitative measurement of 501 metabolites . Briefly, metabolites were extracted from
144 plasma samples using ice-cold methanol. The extracts were analysed by reverse phase (RP)
145 ultra-high-performance liquid chromatography (UHPLC, Dionex™ UltiMate 3000) coupled to a
146 high-resolution mass spectrometer (HRMS, Thermo Scientific™ Q Exactive™ platform).
147 Acquisitions were performed in heated electrospray positive ionization (HESI+) mode. The
148 semi-quantitative measurement of nicotinamide was based on an in-house library composed of
149 501 endogenous metabolites, created using the Mass Spectrometry Metabolite Library of
150 Standards (IROA Technology, Bolton, MA, USA). The method was validated over three days,
151 and the extraction efficiency as well as the accuracy, precision, repeatability, and linearity of the
152 method were assessed to ensure the quality of the results 10.
6bioRxiv preprint first posted online Mar. 9, 2019; doi: http://dx.doi.org/10.1101/571638. The copyright holder for this preprint
(which was not peer-reviewed) is the author/funder, who has granted bioRxiv a license to display the preprint in perpetuity.
It is made available under a CC-BY-NC-ND 4.0 International license.
153
154 The parameters of nicotinamide in the non-targeted method were the following: ionization:
155 positive mode; RT: 1.66 min; Formula: C6H6N2O; M+H: 123.0553; Fragment ions: 80.0501 and
156 96.0449. The repeatability (CV% performed on 6 duplicates) of the method for nicotinamide
157 was as follow: 5.5% for peak area, 7.6% for peak intensity, 0.7% for retention time (RT) and 0%
158 for m/z ratio. Mass spectrometry and chromatography accuracies were also satisfactory, with
159 respectively 1 Δppm and 0.05 ΔRT; R2 for dilutions linearity (1, 1/2, 1/4 dilutions) was equal to
160 0.9.
161
162 Quantitative LC-MS/MS nicotinamide analysis of plasma samples from the initial and
163 replicative cohorts
164 A blind independent external validation of nicotinamide dosage was performed on plasma
165 samples from both the initial and replicative cohorts using a targeted LC-MS/MS method
166 specifically designed for the quantification of nicotinamide. Nicotinamide (NM) and its isotope-
167 labelled analogue, nicotinamide-d4 (NM-d4), were purchased from LGC Standards GmbH
168 (Wesel, Germany). Fifty microliters of plasma were mixed with 20 µL Internal Standard (IS)
169 solution (NM-d4), and 130 µL of a cold methanol/acetonitrile solution (50/50; V/V) to
170 precipitate proteins. Samples were incubated on ice for 5 min, and then centrifuged at 10 000 g
171 for 5 min. Fifty µL of supernatant were mixed with 550 µL of water and filtered (0.45 μm)
172 before injection into the chromatography and mass spectrometry system.
173
174 Liquid chromatography was conducted on a UFLC Prominence chromatographic system
175 (Shimadzu, Kyoto, Japan) connected to a SCIEX QTRAP® 5500 mass spectrometer, equipped
176 with a turbo V ion spray source (SCIEX, Toronto, Canada). Six µL of supernatant were injected,
7bioRxiv preprint first posted online Mar. 9, 2019; doi: http://dx.doi.org/10.1101/571638. The copyright holder for this preprint
(which was not peer-reviewed) is the author/funder, who has granted bioRxiv a license to display the preprint in perpetuity.
It is made available under a CC-BY-NC-ND 4.0 International license.
177 and chromatographic separation was performed at +40 °C using a Pursuit pentafluorophenyl
178 (PFP) column (150 x 2.1 mm, 3.5 µm; Agilent technologies, Santa Clara, CA, USA) connected
179 to a guard column (Pursuit PFP). The flow rate was 0.4 ml.min-1. A gradient mobile phase was
180 performed and started with 98 % mobile phase A (0.1% formic acid in water) and 2 % mobile
181 phase B (methanol). After 1.5 min post-injection, the percentage of mobile phase B increased
182 linearly from 2 % to 80 % in 1 min, and stayed at 80 % mobile phase B during 0.5 min. The
183 return to baseline conditions (2 % B) was operated after 4 min and the system was allowed to
184 stabilize for 2.3 min before the next injection. The total chromatographic run time was 6.3 min.
185
186 Mass spectrometry analysis was conducted using the electrospray ion (ESI) source in the
187 positive mode. The parameters of the ion source were as follows: temperature 450 °C, ESI
188 voltage 5500 V, Gas GS1 70 psi, Gas GS2 60 psi, CAD gas 8 psi, and Curtain gas 40 psi. For
189 nicotinamide quantification, Multiple Reaction Monitoring (MRM) transitions were respectively
190 m/z 123→80 and m/z 127→84 for nicotinamide and nicotinamide-d4 respectively. For
191 nicotinamide transition, the instrument parameters were 91 V, 27 V, and 12 V for DP, CE, and
192 CXP, respectively. For nicotinamide-d4 transition, the instrument parameters were 81 V, 27 V,
193 and 38 V for DP, CE, and CXP, respectively.
194
195 Five standard calibration points were made in water at final concentrations of 0.082, 0.205,
196 0.410, 0.819, and 1.639 µM for nicotinamide. A solution of nicotinamide-d4 was prepared by
197 dilution in water at a final concentration of 3.966 µM (IS solution).
198
199 Evaluation of the sensitivity and specificity of the protocol showed that the targeted LC-MS/MS
200 method gave good results. The calibration curve was linear up to 200 µg/L (r>0.999), the limit
8bioRxiv preprint first posted online Mar. 9, 2019; doi: http://dx.doi.org/10.1101/571638. The copyright holder for this preprint
(which was not peer-reviewed) is the author/funder, who has granted bioRxiv a license to display the preprint in perpetuity.
It is made available under a CC-BY-NC-ND 4.0 International license.
201 of quantification was 5 µg/L, and the recovery rate was 101±3 % in plasma samples spiked with
202 nicotinamide. During the reproducibility assay, the coefficients of variation (CV) were lower
203 than 5 % at three levels of concentration (CV = 4.8%, 20.4±1.0 µg/L for the low-level control).
204 The retention times were 1.73 min and 1.71 min for nicotinamide and nicotinamide-d4,
205 respectively. Typical chromatograms for nicotinamide and nicotinamide-d4 in plasma samples
206 are shown in the supplementary Figure.
207
208 Statistical analyses
209 The data matrix from non-targeted metabolomics contained one hundred and sixty metabolites;
210 univariate analysis was performed using the non-parametric Wilcoxon rank sum test with
211 Benjamini-Hochberg correction and keeping the False Discovery Rate (FDR) below 5%. These
212 analyses were conducted using Metaboanalyst v4.0 12.
213
214 Univariate analyses of clinical data were carried out using two-tailed Student’s t-test, with
215 differences being considered significant at p < 0.05. A median test was used to compare the
216 median concentrations of nicotinamide found in individuals with POAG versus controls, in both
217 the initial and replicative cohorts. The level of significance for the two-tailed test was set at α =
218 0.05. This analysis was performed using SPSS Statistics v22 (IBM, Bois-Colombes, France).
219
220 The Chi-squared test was performed to assess the independence between POAG and control, in
221 relation to the distribution of the blood collection hour (morning vs. afternoon).
222
223 RESULTS
9bioRxiv preprint first posted online Mar. 9, 2019; doi: http://dx.doi.org/10.1101/571638. The copyright holder for this preprint
(which was not peer-reviewed) is the author/funder, who has granted bioRxiv a license to display the preprint in perpetuity.
It is made available under a CC-BY-NC-ND 4.0 International license.
224 This investigation was exclusively designed for a dedicated cohort of glaucoma patients and
225 controls, and POAG was the only outcome under consideration.
226 As the literature does not report diurnal variations in vitamin B3 levels, we included patients
227 who were selected in our ophthalmic clinics within the daily operating hours (from 8am to 4pm).
228 In addition, subjects were included only if they had been fasting for at least 3 hours, before
229 reaching the hospital. However, to exclude an eventual bias due to the collection time, we
230 statistically compared the collection times of the patients and control cohorts, without finding
231 significant heterogeneity (supplementary Table).
232
233 Clinical characteristics of individuals with POAG and controls
234 Comparisons between individuals with POAG (n=34) and controls (n=30) from the initial
235 cohort, in terms of demographic and comorbidity data, medical conditions and general
236 ophthalmological features, are presented in Table 1. There were no significant differences
237 between the two groups in terms of mean age, sex ratio, systemic medications, or mean IOP.
238
239 Comparisons between individuals with POAG (n=20) and controls (n=15) from the replicative
240 cohort, in terms of demographic and comorbidity data, medical conditions and general
241 ophthalmological features are presented in Table 2. There was no significant differences
242 between the two groups in terms of mean age, sex ratio, or systemic medications, except for
243 anti-hypertensives (pbioRxiv preprint first posted online Mar. 9, 2019; doi: http://dx.doi.org/10.1101/571638. The copyright holder for this preprint
(which was not peer-reviewed) is the author/funder, who has granted bioRxiv a license to display the preprint in perpetuity.
It is made available under a CC-BY-NC-ND 4.0 International license.
247 cohort being related to the presence in the replicative cohort of patients with an insufficiently
248 efficacious treatment for IOP.
249
250 Plasma nicotinamide concentrations
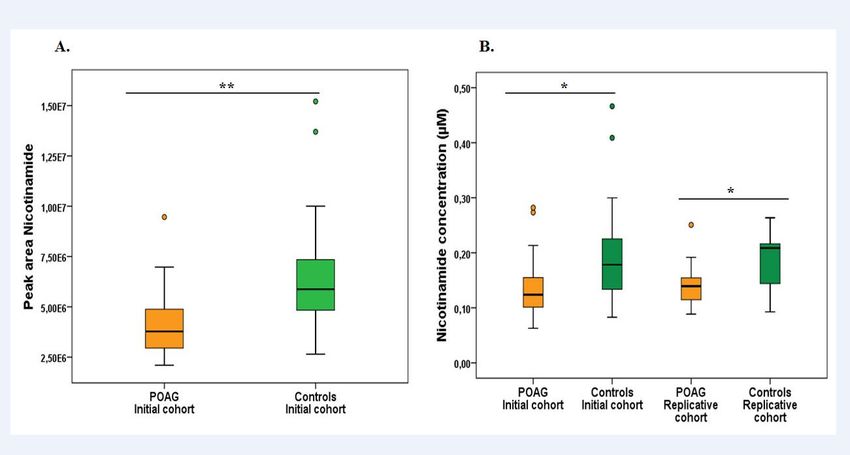
251 The univariate analysis of the results obtained using the semi-quantitative LC-HRMS method on
252 plasma samples from the initial cohort revealed significant differences between individuals with
253 POAG and controls, with nicotinamide being the most discriminant metabolite (False Discovery
254 Rate corrected p = 0.0027), showing an average nicotinamide decrease of 36 % in individuals
255 with POAG compared to controls (Figure A).
256
257 This observation, subsequently tested in both the initial and replicative cohorts, using an
258 independent quantitative measurement of nicotinamide designed for a clinical laboratory setting,
259 supported the results obtained with the metabolomics analysis (Figure B). The median
260 concentrations of nicotinamide found in individuals with POAG and controls were 0.12 µM
261 (0.06-0.28 µM) vs. 0.18 µM (0.08-0.47 µM), and 0.14 µM (0.09-0.25 µM) vs. 0.21 µM (0.09-
262 0.26 µM), respectively, in the initial and replicative cohorts, corresponding to a reduction of 30
263 % (p = 0.022) and of 33 % (p = 0.011) of the nicotinamide concentration in the initial and
264 replicative POAG vs. control cohorts, respectively. The mean concentrations of nicotinamide
265 found in individuals with POAG and controls were 0.14 µM vs. 0.19 µM, and 0.14 µM vs. 0.19
266 µM, respectively, in the initial and replicative cohorts.
267 During the semi-quantitative LC-HRMS several metabolites related to nicotinamide were
268 assessed: 1-Methylnicotinamide, 6-hydroxy-nicotinic acid, nicotinic acid, nicotinamide
269 mononucleotide, and NAD. Only 1-methylnicotinamide was accurately detected, but this
270 metabolite was not discriminant between POAG and controls.
11bioRxiv preprint first posted online Mar. 9, 2019; doi: http://dx.doi.org/10.1101/571638. The copyright holder for this preprint
(which was not peer-reviewed) is the author/funder, who has granted bioRxiv a license to display the preprint in perpetuity.
It is made available under a CC-BY-NC-ND 4.0 International license.
271
272 DISCUSSION
273 Mitochondrial dysfunctions and decreased NAD content are hallmarks of aging in most organs
13,14
274 and many experimental studies, essentially performed on mouse models, have revealed that
275 strategies based on NAD repletion effectively reverse age-related phenotypes and disorders 15,16,
17 18 19
276 such as those affecting the skeletal muscles , the brain , and the endothelium . Recent
277 studies on the DBA/2J mouse model of glaucoma, have further confirmed a dose-dependent
278 protective effect of NAD repletion on the optic nerve, reaching a protection level of 93% at the
6,7,20
279 highest nicotinamide dose tested (2000 mg/kg/day), despite a continuously elevated IOP .
280 More importantly, the age-dependent vulnerability of the RGCs in these mice was correlated
281 with the decreased concentration of NAD in the retina. Thus, the nicotinamide deficiency we
282 observed in the blood of POAG individuals parallels the NAD depletion observed in the DBA/2J
283 mouse model. Interestingly, our study of plasma samples from individuals affected by dominant
284 optic atrophy due to OPA1 mutations, another form of an age-dependent progressive optic
285 neuropathy due to mitochondrial impairment, also revealed a 50 % reduction of nicotinamide
286 whose chemical formula is C6H6N2O 21.
287
288 The main function of NAD as a redox cofactor consists in providing electrons from oxidized
289 nutrients to the mitochondrial respiratory chain complex I, thus sustaining ATP production. In
290 parallel, NAD-consuming enzymes, such as those involved in DNA repair, e.g. poly (ADP-
291 ribose) polymerase (PARP), may consume NAD stocks excessively during aging, in particular
13
292 to prevent the accumulation of DNA mutations . This excessive NAD consumption may
293 compromise NAD-dependent complex I activity, the deficiency of which is frequently
294 associated with inherited optic neuropathies, because of the particularly high energy required by
12bioRxiv preprint first posted online Mar. 9, 2019; doi: http://dx.doi.org/10.1101/571638. The copyright holder for this preprint
(which was not peer-reviewed) is the author/funder, who has granted bioRxiv a license to display the preprint in perpetuity.
It is made available under a CC-BY-NC-ND 4.0 International license.
295 RGCs to transduce visual information from the retina to the brain. In this respect, lymphoblasts
296 of patients with POAG showed a mitochondrial complex I deficiency reflecting a systemic
297 mitochondrial impairment 4,5. In addition, using targeted metabolomics on the plasma of POAG
298 patients compared to controls, we have recently shown a metabolic profile combining the
299 impaired utilization of energetic substrates and decreased levels of polyamines, attesting a
22
300 mitochondrial dysfunction, and premature ageing . Since nicotinamide is one of the main
301 contributors to the regeneration of NAD through a salvage metabolic pathway, nicotinamide
302 deficiency could reflect excessive age-related NAD consumption, which subsequently leads to
303 complex I deficiency, and the energetic failure responsible for the degeneration of RGCs.
304 Despite extensive research in the literature, we were unable to find normative values for plasma
305 nicotinamide levels in normal subjects. We believe that this can be explained by a technological
306 gap, since the plasmatic nicotinamide levels are very low in humans. We assume that the recent
307 technological advances in mass spectrometry have allowed us to perform these measures and we
308 can only hope that further independent studies will explore this area.
309
310 The main limitation of this study consists in the relatively small number of individuals in both
311 the initial and replicative cohorts. However, we found a significant decrease in vitamin B3 levels
312 in patients with POAG compared to controls using two different techniques, with highly similar
313 results in the two independent cohorts. Further studies with larger cohorts are also required, as
314 well as investigations in populations with various cultural dietary habits, to find out whether this
315 deficiency is consistently associated with POAG and eventually with other forms of glaucoma.
316 Finally, the convergence between recent studies showing that oral administration of
6,7,20
317 nicotinamide prevents glaucoma in the DBA/2J mouse model and our study on patients
318 with POAG, opens promising therapeutic perspectives based on nicotinamide supplementation.
13bioRxiv preprint first posted online Mar. 9, 2019; doi: http://dx.doi.org/10.1101/571638. The copyright holder for this preprint
(which was not peer-reviewed) is the author/funder, who has granted bioRxiv a license to display the preprint in perpetuity.
It is made available under a CC-BY-NC-ND 4.0 International license.
319
320 ACKNOWLEDGMENTS
321 We acknowledge support from the Institut National de la Santé et de la Recherche Médicale
322 (INSERM), the Centre National de la Recherche Scientifique (CNRS), the University of Angers,
323 the University Hospital of Angers. We also thank the following patients’ foundations for their
324 support: “Fondation VISIO”, “Ouvrir les Yeux”, “Union Nationale des Aveugles et Déficients
325 Visuels” “Association contre les Maladies Mitochondriales”, “Retina France”, “Kjer France”,
326 “Fondation Berthe Fouassier”, “Fondation pour la Recherche Médicale” and “Association
327 Point de Mire”.
328 We are grateful to Kanaya Malkani for critical reading and comments on the manuscript and to
329 Dr. Odile Blanchet and the team of the Centre de Ressources Biologiques of the University
330 Hospital of Angers for processing the biobank samplings.
331
332
333 REFERENCES
334
335 1. Jonas JB, Aung T, Bourne RR, et al. Glaucoma. Lancet Lond Engl. 2017;390(10108):2183-
336 2193.
337 2. Burgess LG, Uppal K, Walker DI, et al. Metabolome-Wide Association Study of Primary
338 Open Angle Glaucoma. Invest Ophthalmol Vis Sci. 2015;56(8):5020-5028.
339 3. Osborne NN, Núñez-Álvarez C, Joglar B, et al. Glaucoma: Focus on mitochondria in
340 relation to pathogenesis and neuroprotection. Eur J Pharmacol. 2016;787:127-133.
341 4. Lee S, Sheck L, Crowston JG, et al. Impaired complex-I-linked respiration and ATP
342 synthesis in primary open-angle glaucoma patient lymphoblasts. Invest Ophthalmol Vis Sci.
343 2012;53(4):2431-2437.
344 5. Van Bergen NJ, Crowston JG, Craig JE, et al. Measurement of Systemic Mitochondrial
345 Function in Advanced Primary Open-Angle Glaucoma and Leber Hereditary Optic
346 Neuropathy. PloS One. 2015;10(10):e0140919.
347 6. Williams PA, Harder JM, Foxworth NE, et al. Vitamin B3 modulates mitochondrial
348 vulnerability and prevents glaucoma in aged mice. Science. 2017;355(6326):756-760.
14bioRxiv preprint first posted online Mar. 9, 2019; doi: http://dx.doi.org/10.1101/571638. The copyright holder for this preprint
(which was not peer-reviewed) is the author/funder, who has granted bioRxiv a license to display the preprint in perpetuity.
It is made available under a CC-BY-NC-ND 4.0 International license.
349 7. Williams PA, Harder JM, John SWM. Glaucoma as a Metabolic Optic Neuropathy:
350 Making the Case for Nicotinamide Treatment in Glaucoma. J Glaucoma.
351 2017;26(12):1161-1168.
352 8. Liebmann JM, Cioffi GA. Nicking Glaucoma with Nicotinamide? Phimister EG, ed. N
353 Engl J Med. 2017;376(21):2079-2081.
354 9. Ramdas W, Schouten J, Webers C. The Effect of Vitamins on Glaucoma: A Systematic
355 Review and Meta-Analysis. Nutrients. 2018;10(3):359.
356 10. Kouassi Nzoughet J, Bocca C, Simard G, et al. A Nontargeted UHPLC-HRMS
357 Metabolomics Pipeline for Metabolite Identification: Application to Cardiac Remote
358 Ischemic Preconditioning. Anal Chem. 2017;89(3):2138-2146.
359 doi:10.1021/acs.analchem.6b04912
360 11. Weinreb RN, Khaw PT. Primary open-angle glaucoma. Lancet Lond Engl.
361 2004;363(9422):1711-1720.
362 12. Xia J, Wishart DS. Using MetaboAnalyst 3.0 for Comprehensive Metabolomics Data
363 Analysis. Curr Protoc Bioinforma. 2016;55:14.10.1-14.10.91.
364 13. Verdin E. NAD+ in aging, metabolism, and neurodegeneration. Science.
365 2015;350(6265):1208-1213.
366 14. Zhang M, Ying W. NAD+ Deficiency Is a Common Central Pathological Factor of a
367 Number of Diseases and Aging: Mechanisms and Therapeutic Implications. Antioxid
368 Redox Signal. February 2018.
369 15. Mills KF, Yoshida S, Stein LR, et al. Long-Term Administration of Nicotinamide
370 Mononucleotide Mitigates Age-Associated Physiological Decline in Mice. Cell Metab.
371 2016;24(6):795-806.
372 16. Yoshino J, Baur JA, Imai S-I. NAD+ Intermediates: The Biology and Therapeutic Potential
373 of NMN and NR. Cell Metab. 2018;27(3):513-528.
374 17. Zhang H, Ryu D, Wu Y, et al. NAD+ repletion improves mitochondrial and stem cell
375 function and enhances life span in mice. Science. 2016;352(6292):1436-1443.
376 18. Park JH, Long A, Owens K, et al. Nicotinamide mononucleotide inhibits post-ischemic
377 NAD(+) degradation and dramatically ameliorates brain damage following global cerebral
378 ischemia. Neurobiol Dis. 2016;95:102-110.
379 19. Das A, Huang GX, Bonkowski MS, et al. Impairment of an Endothelial NAD + -H 2 S
380 Signaling Network Is a Reversible Cause of Vascular Aging. Cell. 2018;173(1):74-89.e20.
381 20. Williams PA, Harder JM, Cardozo BH, et al. Nicotinamide treatment robustly protects
382 from inherited mouse glaucoma. Commun Integr Biol. 2018;11(1):e1356956.
15bioRxiv preprint first posted online Mar. 9, 2019; doi: http://dx.doi.org/10.1101/571638. The copyright holder for this preprint
(which was not peer-reviewed) is the author/funder, who has granted bioRxiv a license to display the preprint in perpetuity.
It is made available under a CC-BY-NC-ND 4.0 International license.
383 21. Bocca C, Kouassi Nzoughet J, Leruez S, et al. A Plasma Metabolomic Signature Involving
384 Purine Metabolism in Human Optic Atrophy 1 ( OPA1 )-Related Disorders. Investig
385 Opthalmology Vis Sci. 2018;59(1):185.
386 22. Leruez S, Marill A, Bresson T, et al. A Metabolomics Profiling of Glaucoma Points to
387 Mitochondrial Dysfunction, Senescence, and Polyamines Deficiency. Investig
388 Opthalmology Vis Sci. 2018;59(11):4355.
389
16bioRxiv preprint first posted online Mar. 9, 2019; doi: http://dx.doi.org/10.1101/571638. The copyright holder for this preprint
(which was not peer-reviewed) is the author/funder, who has granted bioRxiv a license to display the preprint in perpetuity.
It is made available under a CC-BY-NC-ND 4.0 International license.
390 TABLE AND FIGURE LEGENDS
391 Table 1: Characteristics of individuals from the initial cohort. Demographic data and
392 comorbidity status, systemic medications, ophthalmological features and glaucoma medication
393 of individuals with POAG compared to controls. BMI: body mass index (weight/height2). IOP:
394 intraocular pressure; CCT: central corneal thickness; RNFL: retinal nerve fibre layer; VF-MD:
395 visual field mean defect.
396
397 Table 2: Characteristics of individuals from the replicative cohort. Demographic data and
398 comorbidity status, systemic medications, ophthalmological features and glaucoma medication
399 of individuals with POAG compared to controls. BMI: Body mass index (weight/height2). IOP:
400 intraocular pressure; CCT: central corneal thickness; RNFL: retinal nerve fibre layer; VF-MD:
401 visual field mean defect.
402
403 Figure: Boxplots showing nicotinamide levels in the initial (34 POAG and 30 control
404 individuals) and replicative (20 POAG and 15 control individuals) cohorts. Error bars
405 represent ± SEM, and the black bars within the boxplots represent the median concentration for
406 each group. (A) Peak area of nicotinamide found in the initial cohort following LC-HRMS
407 analysis discloses a glaucoma/controls fold change of 0.65. (B) Concentrations of nicotinamide
408 found in the initial and replicative cohorts following LC-MS/MS analysis. The
409 glaucoma/controls fold changes were 0.70 and 0.67 for the initial and replicative cohorts,
410 respectively. The p-values between groups for all conditions were *: pbioRxiv preprint first posted online Mar. 9, 2019; doi: http://dx.doi.org/10.1101/571638. The copyright holder for this preprint
(which was not peer-reviewed) is the author/funder, who has granted bioRxiv a license to display the preprint in perpetuity.
It is made available under a CC-BY-NC-ND 4.0 International license.
414 Table 1: Characteristics of individuals from the initial cohort. Demographic data and
415 comorbidity status, systemic medications, ophthalmological features and glaucoma medication
416 of individuals with POAG compared to controls. BMI: body mass index (weight/height2). IOP:
417 intraocular pressure; CCT: central corneal thickness; RNFL: retinal nerve fibre layer; VF-MD:
418 visual field mean defect.
419
POAG Controls p-
(N=34) (N=30) value
Demographic data and
comorbidity
Average age (y) 73.06 73.77 0.65
Females (%) 50 50 1
2
Mean BMI (kg/m ) 26.22 26.99 0.59
Diabetes (%) 17.65 3.33 0.10
Hypertension (%) 50 63.33 0.29
Hyperlipidaemia (%) 26.47 43.33 0.165
Thyroid disease (%) 11.76 13.33 0.29
Systemic medications
Anti-hypertensives (%) 47.06 63.33 0.19
Lipid-lowering medications (%) 23.53 43.33 0.09
Antiplatelet therapy (%) 26.47 36.67 0.39
Oral diabetes medications (%) 14.71 13.33 0.88
Insulin (%) 2.94 0 0.32
Corticosteroids (%) 2.94 3.33 0.93
Thyroid hormone (%) 17.65 13.33 0.64
Oestrogen (%) 0 0 1
Vitamin D (%) 11.76 20 0.38
Ophthalmological features and
glaucoma medication
Mean visual acuity (LogMar) +0.12 +0.13 0.91
Mean IOP (mmHg) 13.42 14.10 0.27
18bioRxiv preprint first posted online Mar. 9, 2019; doi: http://dx.doi.org/10.1101/571638. The copyright holder for this preprint
(which was not peer-reviewed) is the author/funder, who has granted bioRxiv a license to display the preprint in perpetuity.
It is made available under a CC-BY-NC-ND 4.0 International license.
Mean CCT (µm) 529.95 - -
Average RNFL thickness (µm) 66.91 - -
Mean VF-MD (dB),
(eye with worse MD) -6.83 - -
Glaucoma severity (%)
Mild 82.35 - -
Moderate 5.88 - -
Severe 11.77 - -
Glaucoma medications (%)
Beta-blockers 55.88 - -
Prostaglandin analogue 67.65 - -
Alpha-2-agonists 11.76 - -
Carbonic anhydrase inhibitor 26.47 - -
420
421
422
19bioRxiv preprint first posted online Mar. 9, 2019; doi: http://dx.doi.org/10.1101/571638. The copyright holder for this preprint
(which was not peer-reviewed) is the author/funder, who has granted bioRxiv a license to display the preprint in perpetuity.
It is made available under a CC-BY-NC-ND 4.0 International license.
423 Table 2: Characteristics of individuals from the replicative cohort. Demographic data and
424 comorbidity status, systemic medications, ophthalmological features and glaucoma medication
425 of individuals with POAG compared to controls. BMI: Body mass index (weight/height2). IOP:
426 intraocular pressure; CCT: central corneal thickness; RNFL: retinal nerve fibre layer; VF-MD:
427 visual field mean defect.
POAG Controls p-value
(N=20) (N=15)
Demographic data and
comorbidity
Average age (y) 64.85 70.27 0.11
Females (%) 25 53.33 0.09
Mean BMI (kg/m2) 25.75 28.27 0.30
Diabetes (%) 25 13.33 0.39
Hypertension (%) 35 73.33 0.02
Hyperlipidaemia (%) 25 60 0.04
Thyroid disease (%) 5 0 0.33
Systemic medications
Anti-hypertensives (%) 35 73.33 0.02
Lipid-lowering medications (%) 25 60 0.04
Antiplatelet therapy (%) 25 13.33 0.39
Oral diabetes medications (%) 25 13.33 0.39
Insulin (%) 0 0 -
Corticosteroids (%) 5 0 0.33
Thyroid hormone (%) 5 0 0.33
Oestrogen (%) 0 0 -
Vitamin D (%) 10 6.67 0.73
Others (%) 40 33.33 0.69
Ophthalmological features and
glaucoma medication
Mean visual acuity (LogMar) +0.05 +0.03 0.37
Mean IOP (mmHg) 15.82 13.84bioRxiv preprint first posted online Mar. 9, 2019; doi: http://dx.doi.org/10.1101/571638. The copyright holder for this preprint
(which was not peer-reviewed) is the author/funder, who has granted bioRxiv a license to display the preprint in perpetuity.
It is made available under a CC-BY-NC-ND 4.0 International license.
Mean CCT (µm) 544.44 - -
Average RNFL thickness (µm) 68.7 - -
Mean VF-MD (dB),
(eye with worse MD) -3.99 - -
Glaucoma severity (%)
Mild 80 - -
Moderate 10 - -
Severe 10 - -
Glaucoma medications (%)
Beta-blockers 60 - -
Prostaglandin analogue 85 - -
Alpha-2-agonists 0 - -
Carbonic anhydrase inhibitor 15 - -
428
429
430
21Figure: Boxplots showing nicotinamide levels in the initial (34 POAG and 30 control individuals) and replicative (20 POAG and 15 control individuals) cohorts. Error bars represent ± SEM, and the black bars within the boxplots represent the median concentration for each group. (A) Peak area of nicotinamide found in the initial cohort following LC-HRMS analysis discloses a glaucoma/controls fold change of 0.65. (B) Concentrations of nicotinamide found in the initial and replicative cohorts following LC- MS/MS analysis. The glaucoma/controls fold changes were 0.70 and 0.67 for the initial and replicative cohorts, respectively. The p- values between groups for all conditions were *: p
bioRxiv preprint first posted online Mar. 9, 2019; doi: http://dx.doi.org/10.1101/571638. The copyright holder for this preprint
(which was not peer-reviewed) is the author/funder, who has granted bioRxiv a license to display the preprint in perpetuity.
                             It is made available under a CC-BY-NC-ND 4.0 International license.

                                                                                                                                   23
You can also read