Ventilation Characteristics and Performance Evaluation of Different Window-Opening Forms in a Typical Office Room
←
→
Page content transcription
If your browser does not render page correctly, please read the page content below
Article

Ventilation Characteristics and Performance Evaluation of
Different Window-Opening Forms in a Typical Office Room
Yuanyuan Wang 1, Yanzhe Yu 1, Tianzhen Ye 1,2,* and Quan Bo 1

 1 School of Environmental Science and Engineering, Tianjin University, Tianjin 300350, China;
 yuanyuan16336@tju.edu.cn (Y.W.); yuyanzhe@tju.edu.cn (Y.Y.); tjboq@cohl.com (Q.B.)
 2 National Engineering Laboratory for Digital Construction and Evaluation Technology of Urban Rail Transit,

 Tianjin 300350, China
 * Correspondence: tzhye@tju.edu.cn

 Abstract: As most existing office buildings in China lack fresh air systems for ventilation, natural
 ventilation with windows remains the main means of improving indoor air quality and adjusting
 indoor thermal comfort. However, knowledge of the ventilation characteristics of various window-
 opening forms in actual buildings is limited and current methods for evaluating ventilation perfor-
 mance lack a comprehensive consideration of ventilation rate and thermal comfort. In this study,
 the ventilation characteristics of different window-opening forms were systematically compared by
 conducting computational fluid dynamics (CFD) simulations. A full-scale experiment was con-
 ducted in a typical office room in a university in Tianjin to validate the CFD simulation. Two venti-
 lation modes (wind-driven cross-ventilation and temperature-driven single-sided ventilation), three
 window-opening angles, and seven window types were investigated. Additionally, the ratio of the
 ventilation rate to the absolute value of thermal sensation was used to quantify the indoor natural-
 ventilation performance. The results showed that a sliding window with a full opening has the high-
 est discharge coefficients of 0.68 and 0.52 under wind-driven cross-ventilation and temperature-
Citation: Wang, Y.; Yu, Y.; Ye, T.; driven single-sided ventilation, respectively, and top-hung windows opening both inwards and
Bo, Q. Ventilation Characteristics
 outwards have better ventilation performance than other window types under the two ventilation
and Performance Evaluation of
 modes. This study is applicable to the design and practice of natural ventilation.
Different Window-Opening Forms
in a Typical Office Room. Appl. Sci.
 Keywords: natural ventilation; window-opening forms; ventilation performance; CFD
2021, 11, 8966. https://doi.org/
10.3390/app11198966

Academic Editor: Cesare Biserni
 1. Introduction
Received: 11 September 2021 Natural ventilation can help adjust indoor thermal comfort [1–3], improve indoor air
Accepted: 21 September 2021 quality [4,5], and reduce the energy consumption of mechanical ventilation systems [6–
Published: 26 September 2021 8]. Due to the pulsating characteristics of natural ventilation, natural ventilation can pro-
 vide a comfortable indoor environment [9], which is conducive to people’s physical and
Publisher’s Note: MDPI stays neu-
 mental health. Thus, it is important to promote the adoption of natural ventilation in
tral with regard to jurisdictional
 buildings.
claims in published maps and institu-
 One of the important methods of realising natural ventilation is window ventilation.
tional affiliations.
 The design [10–12], practice, and assessment of window ventilation [13–15] have received
 increasing research attention. In the design and practice of window ventilation, the win-
 dow configuration, window-opening form, and opening angle are three important influ-
Copyright: © 2021 by the authors. Li-
 encing factors [16]. Window configurations are usually categorised as cross-ventilation,
censee MDPI, Basel, Switzerland. where openings are on opposite sides of a building; and single-sided ventilation, where
This article is an open access article the openings are on only one side of a building [17]. There are three common window-
distributed under the terms and con- opening forms—casement, hung, and sliding windows [18]—which can be subdivided
ditions of the Creative Commons At- according to the axis position and type of opening (inner and outer). Thus, various specific
tribution (CC BY) license (http://crea- application forms can be obtained. The occupants usually control the window-opening
tivecommons.org/licenses/by/4.0/). angle to adjust the ventilation rate [19].

Appl. Sci. 2021, 11, 8966. https://doi.org/10.3390/app11198966 www.mdpi.com/journal/applsci
Appl. Sci. 2021, 11, 8966 2 of 20

 The influence of these three factors on the discharge coefficient and ventilation per-
 formance has been studied by the research community. Favarolo et al. [20] analysed the
 effects of the position of a large rectangular opening on the discharge coefficient under
 single-sided ventilation and concluded that the vertical position of the opening is the most
 important influencing factor. Heiselberg et al. [21] investigated the ventilation perfor-
 mance of side-hung windows and bottom-hung windows under single-sided ventilation
 and cross-ventilation and confirmed that the discharge coefficient varies with both the
 opening area and window type. Yang et al. [22] conducted computational fluid dynamics
 (CFD) simulations to identify a positive correlation between the discharge coefficient and
 the opening angles. However, the aforementioned studies are limited in terms of certain
 window-opening forms or window configurations. In addition, there have been few stud-
 ies on the window-opening angle [23].
 To evaluate the performance of natural ventilation, indices such as air change per
 hour [24,25] and age of air [26] are commonly used. The air change per hour is the ratio of
 ventilation rate per hour to room volume. The age of air refers to the time required for air
 from entering the room to reaching a certain point in the room, which reflects the fresh-
 ness of indoor air. However, under unsteady conditions, the advantages and disad-
 vantages of natural ventilation cannot be determined based on only the ventilation rate;
 the indoor thermal comfort should also be considered. For the evaluation of thermal com-
 fort under natural ventilation, the commonly used indices are the predicted mean vote–
 predicted percentage dissatisfied (PMV-PPD) [27,28] and the thermal comfort adaptabil-
 ity model [29]. PMV represents the average cold and heat felt by most people in the same
 environment. PPD represents the percentage of people dissatisfied with the thermal envi-
 ronment. Yu et al. [30] discussed the advantages and disadvantages of the PMV and adap-
 tive comfort models in evaluating the thermal comfort of natural ventilation and proposed
 that attention should be paid to their combination. In general, occupants open windows
 for ventilation for two main purposes: one is to meet the needs of indoor ventilation, and
 the other is to adjust the indoor thermal comfort. However, the current evaluation index
 considers only one aspect, that is, either the ventilation rate or indoor thermal comfort,
 and lacks a comprehensive consideration of both.
 Although many studies have been conducted on the design, practice, and assessment
 of window ventilation, the ventilation characteristics of various window-opening forms
 and opening angles in actual buildings are rarely systematically and quantitatively com-
 pared. Moreover, there is a lack of comprehensive consideration of the ventilation rate
 and thermal comfort in the evaluation of ventilation performance. To address this research
 gap, in this study, natural ventilation characteristics and performance were quantified and
 assessed under different window-opening forms and ventilation modes. A natural venti-
 lation experiment was conducted in an office room in a university in Tianjin to validate
 the CFD simulation. The natural ventilation flow under seven window types, three open-
 ing angles, and two ventilation modes was simulated by using the CFD method. The win-
 dow ventilation performance was comprehensively evaluated by combining the ventila-
 tion rate and thermal comfort.

 2. Evaluation Model of Ventilation Performance
 There are two main purposes for which occupants open windows for ventilation: one
 is to meet the needs of indoor ventilation, and for this purpose, the greater the ventilation
 rate is, the better. The other purpose is to adjust the indoor thermal comfort, and for this
 purpose, the closer the thermal sensation of the human body to the neutral temperature
 is, the better. To determine thermal comfort, the modified adaptive comfort model pro-
 posed by Su [31] was used in this study to calculate the human thermal sensation neutral
 temperature, tc , and the expression is given as
Appl. Sci. 2021, 11, 8966 3 of 20

 0.55vin
 tc = 19.7 + 0.30t0 + (1)
 0.15
 where t0 is the outdoor monthly average temperature (°C), and vin is the indoor air ve-
 locity (m/s).
 The difference between the thermal neutral temperature and the actual temperature
 is defined as the thermal sensation (the thermal sensation here is different from the pre-
 dicted average thermal sensation of the PMV-PPD method owing to the different calcula-
 tion methods). To comprehensively consider the indoor ventilation rate and the thermal
 comfort, the ratio of the ventilation rate to the absolute value of thermal sensation can be
 used as an index to evaluate the natural ventilation performance: the larger the ratio is,
 the better the ventilation performance.

 3. Full-Scale Experiments
 3.1. Experimental Site and Test Instruments
 The experiment was conducted in an office building in a university in Tianjin. The
 university is located in the suburbs, with flat and open surrounding terrain, and there are
 no other buildings around the experimental building. The experimental building has five
 floors, and the maximum number of building floors in the school is five, which reduces
 the influence of the complex building layout on the natural wind field. The experimental
 room is on the fourth floor of the office building, and the internal size of the room is 8.1 m
 × 4.8 m × 2.7 m (L × W × H). The orientation of the north wall is 13° north by east. The
 north wall of the office is an exterior wall having a window with two sheets, which is the
 casement window opening outwards. There are offices in both the east and west sides and
 in the floors above and below the experimental room. The south side, which has an inner
 door, is adjacent to the inner corridor, and the elevator hall is connected to the corridor.
 There is a glass window on the south side of the waiting hall, which is open and is equal
 to the window in the room. There are four sets of desks and chairs, and two sets of lockers
 in the experimental room. The dimensions of the experimental room and exterior window
 are shown in Figure 1, and the area and volume parameters are listed in Tables 1 and 2,
 respectively.
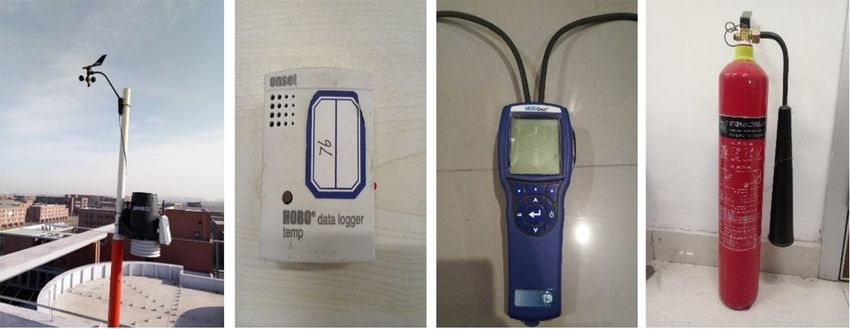
Appl. Sci. 2021, 11, 8966 4 of 20

 (a) (b)
 Figure 1. Dimensions of (a) experimental room and (b) exterior window.

 Table 1. Building area parameters of experimental room.

Exterior Wall Area Exterior Window Sheet Area of the Exterior Interior Wall Room Area
 Door Area (m2)
 (m2) Area (m2) Window (m2) Area (m )
 2 (m2)
 5.67 2.43 1.08 52.48 2.11 38.88

 Table 2. Building volume parameters of experimental room.

 Total Volume (m3) Furniture Volume (m3) Net Volume (m3)
 104.98 16.64 88.34

 The indoor ventilation rate was measured using a tracer gas concentration attenua-
 tion method. CO2 was selected as the tracer gas in this experiment, and a dry ice fire ex-
 tinguisher was selected to release CO2 gas. The instruments used in the test included a
 small weather station, temperature and humidity recorder, miniature wind pressure
 gauge, infrared thermometer, warm air blower, CO2 detection recorder, and carbon diox-
 ide fire extinguisher. The instruments used are shown in Figure 2. The measuring range,
 resolution, accuracy, model, and supplier of the instruments are listed in Table 3.
Appl. Sci. 2021, 11, 8966 5 of 20

 Figure 2. Experimental instruments: (a) small weather station; (b) temperature and humidity re-
 corder; (c) miniature wind pressure gauge; (d) dry ice fire extinguisher; (e) CO2 detection recorder;
 (f) warm air blower; and (g) infrared thermometer.

 Table 3. Test parameters of instruments.

 Parameter Cate- Measuring
 Instrument Resolution Precision Model Supplier
 gory Range
 Wind speed 1–68 m/s 0.1 m/s ±5% (1.5 m/s)
 Small weather Wind direction 0°–360° 1° ±3°
 Vantage pro2 DAVIS
 station Air temperature −40–65 °C 0.1 °C ±0.5 °C
 Relative humidity 0–100% 1% ±3%
Temperature and Air temperature 20–70 °C 0.1 °C ±0.5 °C
 humidity re- U10-003 Onset HOBO
 Relative humidity 25–95% 1% ±3.5–5%
 corder
 Miniature wind −3735–+3735
 Wind pressure 0.1 Pa ±1.5% DP-CALC5815 TSI
 pressure gauge Pa
CO2 detection re- CO2 concentra-
 0–5000 ppm 1 ppm ±50 ppm MH-Z14A WINSEN
 corder tion
 Infrared ther-
 Wall temperature −40–800 °C 0.1 °C ±1% or ±1.0 °C FLUKE568 FLUKE
 mometer

 Prior to the experiment, each instrument was calibrated to ensure test accuracy. For
 the small weather station installed on the experimental building roof, the installation
 height of the wind speed and direction sensor from the roof was at least 1.2 m according
 to the instructions. The wind vane of the wind speed and direction sensor was pointed
 north. The CO2 concentration sensors were placed in a well-ventilated outdoor environ-
 ment without crowd interference, and the data acquisition host was connected. The sen-
 sors operated stably for more than 20 min at an outdoor concentration of 400 ppm, and a
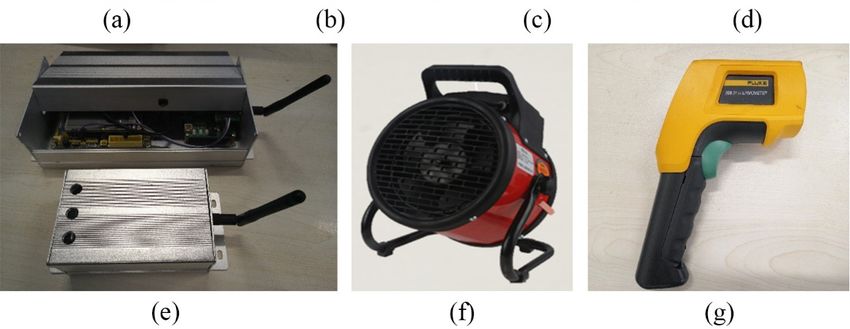
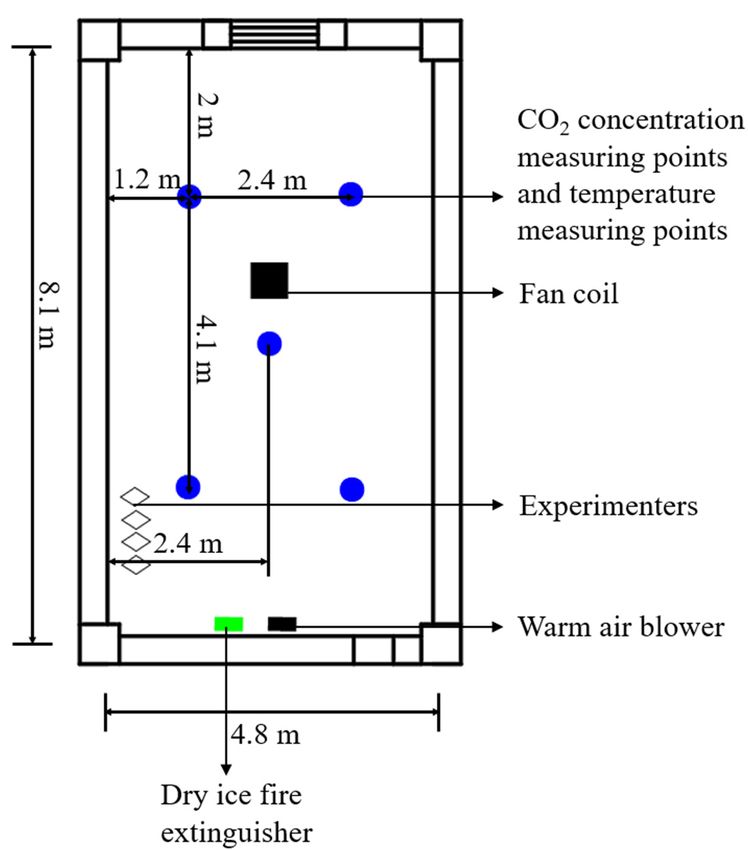
Appl. Sci. 2021, 11, 8966 6 of 20

 manual calibration operation was performed. The indoor temperature and humidity re-
 corder was calibrated before leaving the factory. The miniature wind pressure gauge was
 placed in a windless room, and it was ensured that no person directly breathed to the
 instrument. The manual zero-point calibration was conducted after the wind pressure dif-
 ference was stable.

 3.2. Data Acquisition
 The sampling interval of the small weather station was set as the shortest sampling
 interval, i.e., 5 min. The sampling interval of the CO2 detection recorder and the tempera-
 ture and humidity recorder were set to 1 min. The sampling interval of the miniature wind
 pressure gauge was set to 10 s.
 The arrangement of measurement points and instruments was as follows: the height
 of the outdoor temperature, wind speed, wind direction, and CO2 concentration measure-
 ment points from the ground was approximately 20 m, and the horizontal distance to the
 test room was within 5 m. For the indoor CO2 concentration measurement points, accord-
 ing to the provisions of the Indoor Air Quality Standard [32], 1–3 points should be set for
 rooms less than 50 m2. To prevent the calculation error of the ventilation rate caused by
 the uneven distribution of indoor CO2, the five CO2 concentration measurement points
 were arranged in a quincunx shape. The arrangement of the temperature and humidity
 measurement points was the same as that of the CO2 concentration measurement points.
 Based on relevant research [33], the wind pressure measurement points were symmetri-
 cally arranged, indoors and outdoors, at a distance of 30 mm from the window. All indoor
 measurement points were arranged at a height of 1.2 m above the ground, which is con-
 sistent with the breathing height of humans. As the warm air blower can affect the uni-
 formity of the indoor temperature and CO2 distribution, it was placed on the south side
 of the room, near the interior wall. The warm air blower blows along the surface of the
 interior wall, thus reducing interference with the indoor air flow. Figure 3 shows the lay-
 out of the measurement points of wind-driven cross-ventilation (CV) and temperature-
 driven single-sided ventilation (SV).

 (a) (b)
 Figure 3. Layout of the measurement points of (a) CV and (b) SV.
Appl. Sci. 2021, 11, 8966 7 of 20

 3.3. Experimental Conditions and Procedures
 The experiment involved two ventilation modes: CV and SV. For CV, the windows
 in the room and on the south side and the door in the room were open. For SV, only the
 window in the room was open. Each mode was divided into four window states according
 to the number of open sheets of the window and the angle of the window opening—to-
 talling eight conditions, as listed in Table 4.

 Table 4. Experimental conditions.

 Ventilation Condition Door Sta- Number of Open Sheets Window
 Mode Number tus of the Window Opening
 1–1 1 30°
 1–2 2 30°
 CV Open
 1–3 1 45°
 1–4 2 45°
 2–1 1 30°
 2–2 2 30°
 SV Closed
 2–3 1 45°
 2–4 2 45°

 Before each experiment, to eliminate the influence of CO2 produced by the experi-
 menters’ respiration on the measurement of tracer gas concentration, the rate of the CO2
 production of the experimenters was measured. There were four experimenters in the
 room. The experimental procedures were as follows: all gaps except the door and window
 were well sealed. A dry ice fire extinguisher was used to spray CO2 into the test room. The
 initial concentration was not significantly high or low; an excessively high concentration
 can harm the health of the experimenters, whereas if it is too low, it can affect test accu-
 racy. According to the literature [34], 1800 ppm was set as the lower limit of the initial
 concentration of CO2. For the upper limit, when the CO2 concentration in the air is 2000–
 4000 ppm, people will breathe faster. Therefore, the upper limit of the initial concentration
 was set to 2000 ppm. In the test, the initial concentration of CO2 was controlled at 1800–
 2000 ppm by multiple releases. The fan coil was turned on for the indoor circulation mode
 to accelerate air mixing in the room. When the indoor CO2 concentration reached 1800–
 2000 ppm, the release of CO2 was stopped, and the fan coil continued to operate to accel-
 erate mixing. When the difference between the measurement points was less than 10%
 [35], the indoor CO2 concentrations were considered uniform, and the fan coil was closed.
 For the SV condition, the warm air blower was turned on to heat the indoor air at this
 time. When the required air temperature was reached and the difference between the in-
 door measurement points was within ±0.5 °C [9], the warm air blower was turned off.
 Then, the door and window were opened for ventilation according to the required condi-
 tions.

 4. CFD Simulation
 4.1. Geometrical Models and Numerical Methods
 Seven typical window types that are widely used in buildings were selected in this
 study: casement window opening inwards (CWI), casement window opening outwards
 (CWO), top-hung window opening inwards (THWI), top-hung window opening out-
 wards (THWO), bottom-hung window opening inwards (BHWI), bottom-hung window
 opening outwards (BHWO), and sliding window (SW). Figure 4 presents diagrams of the
 seven windows.
Appl. Sci. 2021, 11, 8966 8 of 20

 (a) (b) (c) (d)

 (e) (f) (g)
 Figure 4. Diagrams of the seven windows: (a) CWI; (b) CWO; (c) THWI; (d) THWO; (e) BHWI; (f) BHWO; and (g) SW.

 At present, room models established by researchers in CFD simulations of natural
 ventilation are mostly classified into two types: the single-opening model and the double-
 opening model with windows on opposite walls. The first model is suitable for SV in this
 study, whereas the latter model is relatively rare in actual buildings. When the influence
 of wind direction on natural ventilation is considered, the windward and leeward sides
 cannot be distinguished because of the geometric symmetry. Therefore, a room model
 with a corridor was proposed for CV in this study. The layout of the model room was the
 same as that of the experimental room. As the wall thickness had a minor effect on the
 discharge coefficient of windows [20], and when the upper, lower, left, and right adjacent
 rooms open the windows, it has little impact on the indoor ventilation [36]. Therefore,
 according to the above similar studies, the wall thickness and adjacent rooms were not
 considered in the CFD models. The model conforms to a common office structure. It can
 distinguish the windward and leeward sides, and it avoids setting a complex model,
 which simplifies the simulation process. Figure 5 shows the models of the two ventilation
 modes. The size of the model room is 8.1 m × 4.8 m × 2.7 m (L × W × H). The window-
 opening size of the room is 0.45 m × 1.18 m (W × H). In the CV model, the corridor size is
 4.8 m × 1.6 m (L × W), the window-opening size of the corridor is the same as that of the
 room, and the door size is 0.9 m × 2.34 m (W × H). The outfield area was set outside the
 room. Referring to the relevant research [37], the distances from the left, right, front, rear,
 and top sides of the outfield to the corresponding surfaces of the room model were set as
 6H, 6H, 3H, 3H, and 3H, respectively (H is the height of the model room).

 (a)
Appl. Sci. 2021, 11, 8966 9 of 20

 (b)
 Figure 5. Geometric models: (a) CV and (b) SV.

 In this study, an industry-leading fluid simulation software, ANSYS Fluent [38], was
 used, which can accurately solve the widest range of CFD problems. Three-dimensional
 steady-state Reynolds-averaged Navier–Stokes models [39] were used because of their
 low requirements for computer memory space and computing speed. As the natural ven-
 tilation problem in this study belonged to a flow with a high Reynolds number and high
 shear rate, it was suitable to adopt the realisable k–ε turbulence model [40,41]. A pressure-
 based solver, which is applicable to the low-speed incompressible flow problem in this
 study and has a fast convergence speed, was adopted, and the SIMPLE algorithm was
 employed for the coupling of the pressure and velocity fields.

 4.2. Numerical Grids and Boundary Conditions
 A hybrid grid was established, including a tetrahedral unstructured mesh between
 the model room and outfield boundary and a hexahedral structured grid inside the model
 room. To ensure the accuracy of the numerical simulation and simplify the complexity of
 the simulation calculation, the grid spacing in the model room was 0.1 m, and the grid
 spacing from the model room to the outfield changed from 0.1 m to 1 m at a rate of 1.1. As
 the high Reynolds number k-ε model and standard wall function method were used in
 this study, the grid near the wall was not encrypted, but the first node was arranged in
 the region where turbulence was fully developed [38]. The total numbers of cells in the
 CV and SV grids were approximately 1,910,000 and 1,610,000, respectively. A grid inde-
 pendence analysis was carried out by increasing the numbers of cells to 4.77 million and
 4.01 million for the CV and SV grids when the window is the CWO, respectively. Simula-
 tion results based on the two numbers of cells in the grids showed that there were negli-
 gible differences in the ventilation rate, confirming that the grid independence test was
 satisfactory.
 The boundary conditions are shown in Figure 6. For the CV model, the velocity-inlet
 boundary condition was applied to the inlet surface of the outfield. The velocity of the
 outfield was fixed at 2.2 m/s according to the average wind speed in the transition season
 in Tianjin. The outflow boundary condition was applied to the outlet surface of the out-
 field. A symmetrical boundary condition was applied to the sides and top of the outfield.
 The bottom of the outfield and the wall of the room were set as the wall boundary condi-
 tion. For the SV model, the boundary conditions of the outlet surface, sides, and top of the
 outfield were the same as those of the CV model. The bottom of the outfield and the wall
 and floor of the room were assigned a wall boundary condition with a fixed temperature.
 The velocity of the outfield was set to be 0.1 m/s to form a flow and realise the ventilation
 process. In the simulation validation, the measured value of the average outdoor air tem-
 perature was taken as the outfield inflow temperature boundary condition, and the meas-
 ured values of the wall temperature of the room under different conditions were taken as
 the wall temperature boundary condition. According to the relevant research, when the
Appl. Sci. 2021, 11, 8966 10 of 20

 outdoor air temperature was higher than 10 °C and the indoor temperature was higher
 than 22 °C, the window opening probability of occupants began to increase significantly
 [42]. Therefore, in further simulations, the temperature of the outfield inflow and the bot-
 tom of outfield was set to 10 °C, and the wall and floor temperatures of the room were set
 to 22 °C. For the velocity-inlet boundary condition, the method of turbulent intensity and
 viscosity ratio was specified. The turbulent intensity was 5%, and the turbulent viscosity
 ratio was 10.

 (a) (b)
 Figure 6. Boundary conditions: (a) CV and (b) SV.

 4.3. CFD Validation
 4.3.1. Validation of Wind Pressure Difference and Discharge Coefficient for CV Model
 Owing to the limitation of the indoor CO2 release concentration, the duration of the
 CO2 attenuation process needed to calculate the ventilation rate in the experiment is short;
 therefore, for the validation of the discharge coefficient, the simulated values can be di-
 rectly compared with the measured value. However, the validation of the wind pressure
 coefficient ( ) was different. First, the measurement of the wind pressure difference does
 not depend on the tracer gas method, and it can be carried out independently. Second, the
 instrument measurement interval of the wind pressure difference can be smaller than that
 of the outdoor wind speed and direction. Therefore, the method of the combination of
 mean comparison and sequence correlation comparison was used to validate the wind
 pressure difference.
 In the process of the wind pressure difference test, 50 min was taken as the length of
 each sequence, and 10 sequences were compared. The time interval of the simulated val-
 ues in each sequence was 5 min, with a total of 10 values, and the time interval of the
 measured values was 10 s, with a total of 300 values. The mean values and Pearson corre-
 lation coefficients between the simulated value sequence and the measured value se-
 quence are listed in Table 5, in which the minimum correlation coefficient is 0.746.

 Table 5. Comparison of mean values and Pearson correlation coefficients of wind pressure difference.

 Mean Value
 Serial Mean Wind Speed Dominant Wind Di- Pearson Correlation
 Simulated Value Measured Value
 Number (m/s) rection Coefficient
 (Pa) (Pa)
 1 4.0 67.5° 2.53 2.19 0.868
 2 2.2 315° 1.20 1.55 0.746
 3 2.5 112.5° 0.51 0.40 0.774
 4 2.1 112.5° 0.38 0.33 0.769
 5 3.3 67.5° 0.58 0.46 0.832
 6 1.2 45° 1.12 1.40 0.809
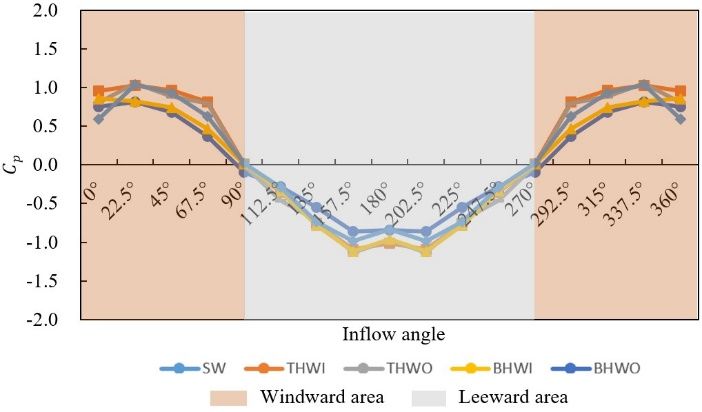
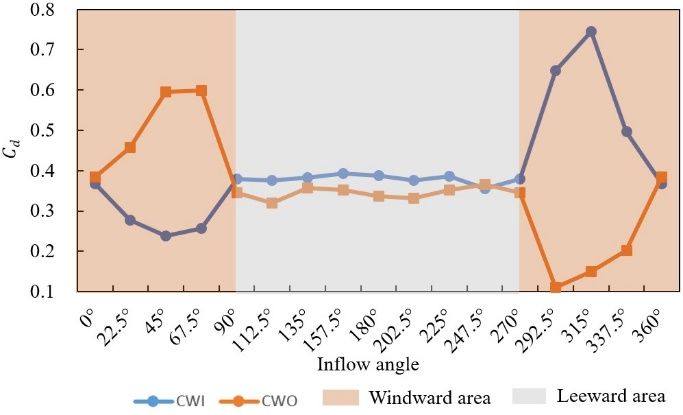
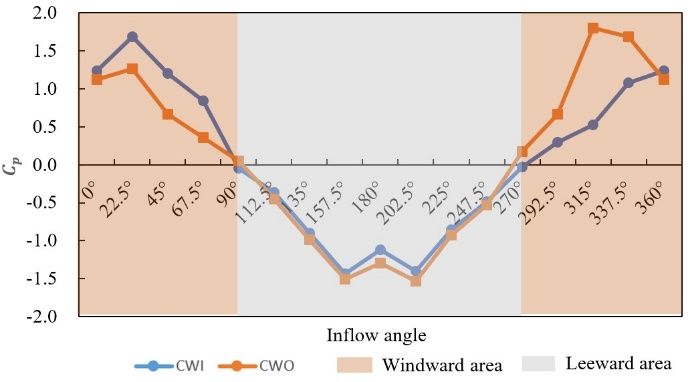
Appl. Sci. 2021, 11, 8966 11 of 20

 7 1.7 247.5° 0.47 0.31 0.798
 8 2.4 270° 0.32 0.41 0.755
 9 3.8 225° 1.91 2.26 0.817
 10 2.1 112.5° 0.38 0.33 0.769

 A comparison between the CFD simulation values and experimental values of the
 discharge coefficient for CV ( ) is presented in Table 6.

 Table 6. Comparison between simulated and experimental values of the discharge coefficient under CV.

 Outdoor Mean Dominant Average Temperature Dif-
 Condition
 Wind Speed Wind Direc- ference between Indoor and Simulated Experimental Relative Er-
 Number
 (m/s) tion Outdoor (°C) Value Value ror
 1–1 0.2 112.5° 3.9 0.319 0.335 4.8%
 1–2 3.0 22.5° 3.3 0.457 0.474 3.6%
 1–3 3.0 202.5° 1.1 0.413 0.404 −2.2%
 1–4 2.6 337.5° 1.4 0.270 0.261 −3.4%

 4.3.2. Validation of the Discharge Coefficient for SV Model
 A comparison between the CFD simulation values and the experimental values of
 the discharge coefficient for SV ( ′) is presented in Table 7.

 Table 7. Comparison between simulated and experimental values of the discharge coefficient under SV.

 Indoor and Outdoor Average Tempera-
 Outdoor Mean ′
 Condition ture Difference
 Wind Speed
 Number Simulated Experimental Relative Er- Simulated Experimental Relative Er-
 (m/s)
 Value Value ror Value Value ror
 2–1 2.0 15.5 16.6 6.6% 0.360 0.371 3.0%
 2–2 1.2 17.5 18.7 6.4% 0.363 0.356 −2.0%
 2–3 1.0 18.3 19.8 7.6% 0.408 0.395 −3.3%
 2–4 1.2 8.3 9.0 7.8% 0.426 0.430 0.9%

 From Tables 6 and 7, it can be observed that the agreement between the CFD results
 and the experimental data is acceptable, and the CFD model can be used for subsequent
 simulations.

 5. Results and Discussion
 5.1. Comparison of Ventilation Characteristics of Seven Window Types with Different Wind Di-
 rections under CV
 In CV, the window-opening angle was 30°, and the window-opening area was equal.
 The simulated conditions of CV were divided according to the angle between the incom-
 ing wind direction and the plane of the window based on the 16-wind direction interval
 method, where 0° (360°) was condition 1, each increase of 22.5° was a condition, and 337.5°
 was condition 16. According to the left and right symmetry, the seven window types were
 divided into two types: symmetrical windows, namely THWI, THWO, BHWI, BHWO,
 and SW, and asymmetric windows, namely CWI and CWO. Figure 7 depicts the simulated
 wind pressure and discharge coefficients for different window types in different wind
 directions.
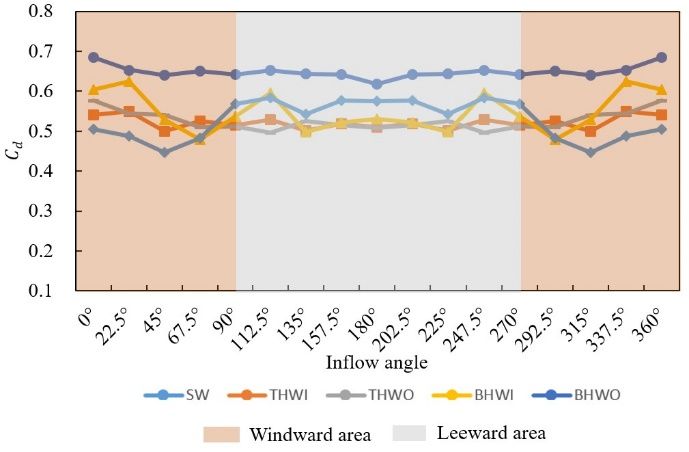
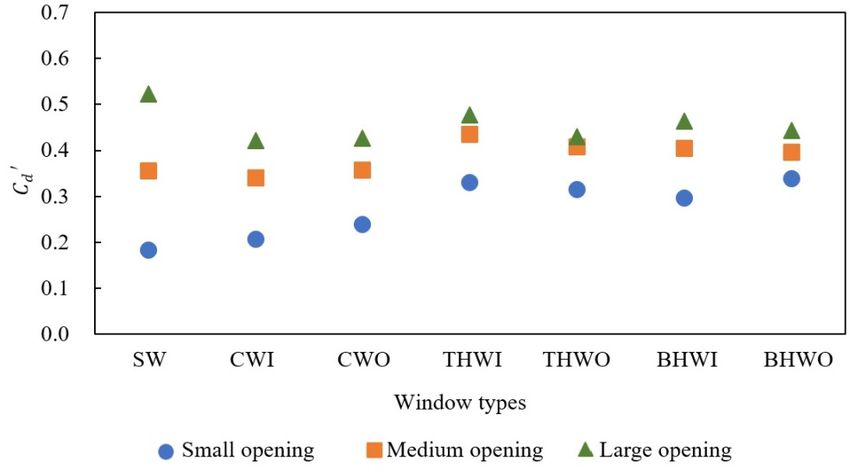
Appl. Sci. 2021, 11, 8966 12 of 20

 (a) (b)
 Figure 7. and of the (a) symmetrical window and (b) asymmetrical window.

 As shown in Figure 7, the overall changing trend of the wind pressure coefficient of
 the symmetrical windows is similar. It is worth noting that on the windward side, the
 maximum value of the wind pressure coefficient does not appear at 0° (360°), but under
 the symmetrical condition of 22.5° (337.5°); there is a similar situation on the leeward side,
 where the minimum value of the coefficient appears in the symmetrical conditions of
 157.5° (202.5°). For the asymmetrical window, the wind pressure coefficient is higher on
 one side for the left and right directions of the windward window, and the high and low
 directions of the CWI and CWO are opposite, and the trend is similar on the leeward side.
 The maximum and minimum values of the wind pressure coefficient still deviate from 0°
 (360°) and 180°. The discharge coefficient of symmetrical windows fluctuates in a small
 range under different wind directions, and there is no obvious distinction between the
 windward and leeward sides. The discharge coefficient of the asymmetric window fluc-
 tuates considerably on the windward side and gently on the leeward side.

 5.2. Comparison of Ventilation Characteristics of Seven Window Types with Three Opening An-
 gles under CV and SV
 In CV, the wind direction was fixed to the plane of the window. Three opening angles
 of each window type were simulated, in which the window opening state of the sliding
 window was set as one-third, two-thirds, and fully open, and the window-opening states
 of other window types were set as 15°, 30°, and 45°, respectively. The three types of open-
 ings were defined as small, medium, and large openings, respectively.
 The discharge coefficients of the three opening angles for the seven window types
 under the two ventilation modes were simulated, as shown in Figure 8. The discharge
 coefficient for each window type under CV is generally larger than that under SV, and the
 difference in discharge coefficient of each window type of the three openings under SV is
 less obvious than that under CV, which is due to the different mechanisms of wind pres-
Appl. Sci. 2021, 11, 8966 13 of 20

 sure ventilation and thermal pressure ventilation, resulting in different airflow character-
 istics at the openings. In addition, for CV and SV, the discharge coefficient increases with
 the increase in window opening, and the SW has the highest discharge coefficient under
 a large opening, which is 0.68, and 0.52, respectively. For medium and small openings, the
 discharge coefficient of BHWI is the highest under CV, and the discharge coefficient of
 THWI is the highest under SV.

 (a)

 (b)
 Figure 8. of three openings for seven window types: (a) CV and (b) SV.

 5.3. Comprehensive Evaluation of Ventilation Performance of Different Window Types
 According to the description of the temperature and wind sensitive area of
 ANSI/ASHRAE Standard 55-2013, a 1.1 m height plane (head height of a human when
 sitting) in the room was selected for ventilation comfort analysis [43]. Figure 9 shows the
 velocity field and velocity vector of each window under the two ventilation modes. In the
 plan of the room, the exterior window of the room is located on the left. For CV, the influ-
 ence range of the airflow is small under the three opening angles for CWO and BHWI,
 whereas the influence range for SW, THWI, and BHWO is large. The airflow influence
 range for CWI and THWO is small only under a small opening.
Appl. Sci. 2021, 11, 8966 14 of 20

 (a)

 (b)
 Figure 9. Velocity field and velocity vector diagram of seven window types under (a) CV and (b) SV.

 Furthermore, the neutral temperature, average thermal sensation, and the proportion
 of thermal sensation interval of different window-opening forms of the z = 1.1 m plane of
 the room were calculated according to the method described in Section 3.3. For CV, the
 outdoor temperature was set to 25 °C according to the outdoor monthly average temper-
 ature during the experiment. For SV, the outdoor temperature was 10 °C, the same as that
 set in the simulation process. The average thermal sensation and proportion of thermal
 sensation intervals under the three opening angles of the two ventilation modes are shown
 in Figure 10.
 It can be observed that, for CV, the average thermal sensation of the seven window
 types is within the comfort zone under the three opening degrees. The comfort of the
Appl. Sci. 2021, 11, 8966 15 of 20

 THWO is the best under a small opening, and the comfort of the seven window types is
 similar under the medium opening. The comfort of the SW is the best under a large open-
 ing. For SV, the average thermal sensation of the seven window types is beyond the range
 of the thermal comfort zone under medium opening and large opening. The comfort of
 the SW is best under a small opening.

 100 2.5 100 0.0

 -0.5
 Proportion of thermal sensation interval (%)

 Proportion of thermal sensation interval (%)
 80 2.0 80 -1.0

 Thermal sensation (℃)

 Thermal sensation (℃)
 -1.5
 60 1.5 60
 -2.0

 -2.5
 40 1.0 40
 -3.0

 20 -3.5
 20 0.5
 -4.0

 0 0.0 0 -4.5
 SW CWI CWO THWI THWO BHWI BHWO SW CWI CWO THWI THWO BHWI BHWO
 Window types Window types
 ≤1 1~1.5 1.5~2 >2 Average thermal sensation ≥-2 -2~-2.5 -2.5~-3 <-3 Average thermal sensation

 (a) (d)
 100 2.5 100 0.0

 -0.5
 Proportion of thermal sensation interval (%)
 Proportion of thermal sensation interval (%)

 80 2.0 80 -1.0

 Thermal sensation (℃)
 Thermal sensation (℃)

 -1.5
 60 1.5 60
 -2.0

 -2.5
 40 1.0 40
 -3.0

 20 0.5 20 -3.5

 -4.0

 0 0.0 0 -4.5
 SW CWI CWO THWI THWO BHWI BHWO SW CWI CWO THWI THWO BHWI BHWO
 Window types Window types
 ≤1 1~1.5 1.5~2 >2 Average thermal sensation ≥-2.5 -2.5~-3 -3~-3.5 <-3.5 Average thermal sensation

 (b) (e)
 100 2.5 100 0.0
 Proportion of thermal sensation interval (%)

 -0.5
 Proportion of thermal sensation interval (%)

 80 2.0 80 -1.0
 Thermal sensation (℃)

 Thermal sensation (℃)

 -1.5
 60 1.5 60
 -2.0

 -2.5
 40 1.0 40
 -3.0

 20 -3.5
 20 0.5
 -4.0

 0 0.0 0 -4.5
 SW CWI CWO THWI THWO BHWI BHWO SW CWI CWO THWI THWO BHWI BHWO
 Window types Window types
 ≤1 1~1.5 1.5~2 >2 Average thermal sensation ≥-3 -3~-3.5 -3.5~-4 <-4 Average thermal sensation

 (c) (f)
Appl. Sci. 2021, 11, 8966 16 of 20

 Figure 10. Average thermal sensation and proportion of thermal sensation interval: (a) small opening for CV; (b) medium
 opening for CV; (c) large opening for CV; (d) small opening for SV; (e) medium opening for SV; and (f) large opening for
 SV.

 To evaluate the ventilation performance of the different window-opening forms com-
 prehensively, the ventilation rate for CV (Q) and SV (Q’) of each window type was ob-
 tained by CFD simulation. Figure 11 presents a comprehensive comparison of the venti-
 lation rate and thermal comfort of the z = 1.1 m plane under different conditions. As can
 be observed from Figure 11, SW-1 (the full opening of the sliding window) has the maxi-
 mum ventilation rate under the two ventilation modes. The thermal sensations of the two
 ventilation modes are not close to 0 or equal to 0. The thermal sensations of the seven
 window types are similar under CV, and the thermal sensations of windows with large
 openings are worse than those with small openings under SV.

 2500 2.5

 2000 2.0

 Thermal sensation (℃)
 1500 1.5
 Q (m3/h)

 1000 1.0

 500 0.5

 0 0.0
 O °
 W °
 W 5°

 W 5°

 O °
 W °
 W 0°

 W 0°

 O °
 W °
 W 5°

 W 5°
 CW -1/3

 CW -2/3

 CW -1
 W 5°

 S W 5°

 W 0°
 0°

 W 5°
 5°
 CW -15
 T H -15

 CW -30

 CW -45
 T H -45
 TH -30

 SW
 BH -1
 TH I-1

 BH I-1

 -1

 TH I-3

 BH -3
 BH I-3

 -3

 T H I -4

 BH -4
 BH I-4

 -4
 SW

 O

 O

 O

 O
 I

 I

 I

 O

 O

 Window types
 Ventilation rate Thermal sensation

 (a)
 250 0.0

 -0.5

 200
 -1.0
 Thermal sensation (℃)

 -1.5
 150
 Q' (m3/h)

 -2.0

 -2.5
 100
 -3.0

 -3.5
 50

 -4.0

 0 -4.5
 CW 1/3

 °

 W °

 CW 2/3

 °

 °

 C W -1

 °

 W °
 W 5°

 W °
 W 5°

 SW 5°

 W 0°

 W °
 W 0°
 0°

 W 5°

 W °
 W 5°
 5°
 CW 5
 TH -15

 BH -15

 CW 0
 TH -30

 BH -30

 CW -45
 TH -45

 BH -45
 SW
 I-1

 T H I-1

 I-3

 T H I-3

 T H I-4
 BH I-1

 -1

 BH I-3

 -3

 B H I-4

 -4
 -

 -
 SW

 O

 O

 O
 I
 O

 O

 O

 O

 O

 O
 W

 Window types
 Ventilation rate Thermal sensation

 (b)
 Figure 11. Comprehensive comparison of ventilation rate and comfort: (a) CV and (b) SV.
Appl. Sci. 2021, 11, 8966 17 of 20

 The ratios of the ventilation rate to the absolute value of the thermal sensation for
 different window types are listed in Table 8. It can be seen that SW-1 has the best ventila-
 tion performance under CV, with a ratio of 1293.26, and THWI-45° has the best ventilation
 performance under SV, with a ratio of 51.97. In summary, THWI and THWO have better
 ventilation performance under the two ventilation modes.

 Table 8. Ratios of the ventilation rate to the absolute value of the thermal sensation for different window-opening forms.

 CV SV
Window Types Ventilation Rate Thermal Sensation Ventilation Rate Thermal Sensation
 Ratio Ratio
 (m3/h) (°C) (m3/h) (°C)
 SW-1/3 858.12 1.85 464.40 71.52 −1.64 43.69
 CWI-15° 952.16 1.90 501.14 86.31 −2.03 42.52
 CWO-15° 814.04 2.01 405.00 98.56 −2.45 40.23
 THWI-15° 1428.25 1.93 740.03 133.86 −2.78 48.15
 THWO-15° 1451.76 1.70 853.98 127.24 −2.77 45.94
 BHWI-15° 1572.25 2.00 786.13 119.14 −3.00 39.71
 BHWO-15° 1069.71 1.79 597.60 135.54 −3.09 43.86
 SW-2/3 1472.33 1.71 861.87 138.90 −3.31 41.98
 CWI-30° 1384.16 1.77 782.01 138.12 −2.88 47.96
 CWO-30° 1378.29 1.79 769.99 143.16 −3.28 43.65
 THWI-30° 1789.71 1.72 1040.53 172.01 −3.56 48.32
 THWO-30° 1751.51 1.73 1012.43 162.48 −3.32 48.94
 BHWI-30° 1901.39 1.84 1033.36 158.60 −3.72 42.63
 BHWO-30° 1316.57 1.80 731.43 155.81 −3.60 43.28
 SW-1 2004.25 1.55 1293.26 203.94 −4.17 48.93
 CWI-45° 1613.39 1.80 896.33 167.76 −3.47 48.35
 CWO-45° 1625.14 1.76 923.38 168.51 −3.80 44.34
 THWI-45° 1822.04 1.76 1035.25 188.14 −3.62 51.97
 THWO-45° 1895.51 1.63 1162.89 170.79 −3.32 51.44
 BHWI-45° 1892.57 1.66 1140.10 179.72 −4.14 43.41
 BHWO-45° 1498.78 1.76 851.58 173.79 −3.76 46.22

 6. Conclusions
 In this study, the ventilation characteristics of a typical office room with different
 window-opening forms under CV and SV were studied. The ratio of the ventilation rate
 to the absolute value of thermal sensation was used to evaluate the natural ventilation
 performance. The main conclusions drawn are as follows.
 (1) For CV, on the windward side, the maximum value of the wind pressure coefficient
 of different window types does not appear at 0° (360°), but under the symmetrical
 condition of 22.5° (337.5°); there is a similar situation on the leeward side, where the
 minimum value of the coefficient appears in the symmetrical conditions of 157.5°
 (202.5°).
 (2) For CV and SV, the discharge coefficient increases with the increase in window open-
 ing, and the full opening of the sliding window has the highest discharge coefficient,
 which is 0.68 and 0.52, respectively. For medium and small openings, the discharge
 coefficient of the bottom-hung window opening inwards is the highest under CV,
 whereas that of the top-hung window opening inwards is the highest under SV.
 (3) Based on the evaluation of the ventilation performance of different window-opening
 forms, it is concluded that the sliding window with a full opening has the best venti-
 lation performance under CV, with a ratio of 1293.26, whereas the ventilation perfor-
 mance is the best under SV when the opening of the top-hung window opening in-
 wards is 45°, with a ratio of 51.97. In general, the two types of top-hung windows
Appl. Sci. 2021, 11, 8966 18 of 20

 have better ventilation performance under the two ventilation modes. The results of
 this study are useful for designers when selecting window types and designing win-
 dows with opening restrictors for office buildings.

 Author Contributions: Conceptualization, Y.W., Y.Y., T.Y. and Q.B.; methodology, Y.W. and Y.Y.;
 software, Y.W. and Y.Y.; validation, Q.B.; formal analysis, Y.W., Y.Y., T.Y. and Q.B.; investigation,
 T.Y.; resources, Q.B.; data curation, Q.B.; writing—original draft preparation, Y.W. and Y.Y.; writ-
 ing—review and editing, T.Y.; visualization, T.Y.; All authors have read and agreed to the published
 version of the manuscript.
 Funding: This research was founded by the Science and Technology Planning Project of Tianjin (No.
 18ZXGDGX00080).
 Institutional Review Board Statement: Not applicable.
 Informed Consent Statement: Not applicable.
 Data Availability Statement: Not applicable.
 Acknowledgments: This work was accomplished in the National Engineering Laboratory for Digi-
 tal Construction and Evaluation Technology of Urban Rail Transit.
 Conflicts of Interest: The authors declare no conflict of interest

 Nomenclature
 BHWI Bottom-hung window opening inwards
 BHWI-15° Bottom-hung window opening inwards at 15°
 BHWI-30° Bottom-hung window opening inwards at 30°
 BHWI-45° Bottom-hung window opening inwards at 45°
 BHWO Bottom-hung window opening outwards
 BHWI Bottom-hung window opening inwards
 BHWI-15° Bottom-hung window opening inwards at 15°
 BHWI-30° Bottom-hung window opening inwards at 30°
 BHWI-45° Bottom-hung window opening inwards at 45°
 BHWO Bottom-hung window opening outwards
 BHWO-15°Bottom-hung window opening outwards at 15°
 BHWO-30°Bottom-hung window opening outwards at 30°
 BHWO-45°Bottom-hung window opening outwards at 45°
 CFD Computational fluid dynamics
 CV Wind-driven cross-ventilation
 BHWI Bottom-hung window opening inwards
 BHWI-15° Bottom-hung window opening inwards at 15°
 BHWI-30° Bottom-hung window opening inwards at 30°
 BHWI-45° Bottom-hung window opening inwards at 45°
 CWO-30° Casement window opening outwards at 30°
 CWO-45° Casement window opening outwards at 45°
 Ventilation rate for wind-driven cross-ventilation (m /s)
 ′ Ventilation rate for temperature-driven single-sided ventilation (m /s)
 SV Temperature-driven single-sided ventilation
 SW Sliding window
 SW-1/3 Sliding window with 1/3 opening
 SW-2/3 Sliding window with 2/3 opening
 SW-1 Sliding window with full opening
 Human thermal sensation neutral temperature
 THWI Top-hung window opening inwards
 THWI-15° Top-hung window opening inwards at 15°
 THWI-30° Top-hung window opening inwards at 30°
 THWI-45° Top-hung window opening inwards at 45°
 THWO Top-hung window opening outwards
 THWO-15°Top-hung window opening outwards at 15°
Appl. Sci. 2021, 11, 8966 19 of 20

 THWO-30°Top-hung window opening outwards at 30°
 THWO-45°Top-hung window opening outwards at 45°

 References
1. Michael, A.; Demosthenous, D.; Philokyprou, M. Natural Ventilation for Cooling in Mediterranean Climate: A Case Study in
 Vernacular Architecture of Cyprus. Energy Build. 2017, 144, 333–345.
2. Yao, R.; Li, B.; Steemers, K.; Short, A. Assessing the natural ventilation cooling potential of office buildings in different climate
 zones in China. Renew. Energy 2009, 34, 2697–2705.
3. Moosavi, L.; Zandi, M.; Bidi, M. Experimental study on the cooling performance of solar-assisted natural ventilation in a large
 building in a warm and humid climate. J. Build. Eng. 2018, 19, 228–241.
4. Cheng, J.; Qi, D.H.; Katal, A.; Wang, L.Z.; Stathopoulos, T. Evaluating wind-driven natural ventilation potential for early
 building design. J. Wind Eng. Ind. Aerodyn. 2018, 182, 160–169.
5. Yu, Y.; Wang, B.; You, S.; Ye, T.; Zheng, W.; Wei, S.; Yang, S.; Wang, Y.; Li, K. The effects of manual airing strategies and
 architectural factors on the indoor air quality in college classrooms: A case study. Air Qual. Atmos. Health 2021,
 doi:10.1007/s11869-021-01074-y.
6. Dino, G.; Walter, M.; Günter, B.; Hrvoje, K. Wind-tunnel analysis of natural ventilation in a generic building in sheltered and
 unsheltered conditions: Impact of Reynolds number and wind direction. J. Wind Eng. Ind. Aerodyn. 2020, 207, 1–17.
7. Oropeza-Perez, I.; Ostergaard, P.A. Energy saving potential of utilizing natural ventilation under warm conditions—A case
 study of Mexico. Appl. Energy 2014, 130, 20–32.
8. Tong, Z.; Chen, Y.; Malkawi, A.; Liu, Z.; Freeman, R.B. Energy saving potential of natural ventilation in China: The impact of
 ambient air pollution. Appl. Energy 2016, 179, 660–668.
9. Xiaofeng, L. Design and Application of Natural Ventilation in Buildings; China Architecture & Building Press: Beijing, China, 2018.
10. David, E. Natural Ventilation of Buildings:Theory, Measurement and Design; John Wiley & Sons, Ltd: Hoboken, NJ, USA, 2011.
11. Allocca, C.; Chen, Q.; Glicksman, L.R. Design analysis of single-sided natural ventilation. Energy Build. 2003, 35, 785–795.
12. Abdullah, H.K.; Alibaba, H.Z. Window Design of Naturally Ventilated Offices in the Mediterranean Climate in Terms of CO2
 and Thermal Comfort Performance. Sustainability 2020, 12, 1–33.
13. Sacht, H.; Lukiantchuki, M.A. Windows Size and the Performance of Natural Ventilation. Procedia Eng. 2017, 196, 972–979.
14. Du, L.; Lau, S.-K.; Lee, S.E.; Danzer, M.K. Experimental study on noise reduction and ventilation performances of sound-proofed
 ventilation window. Build. Environ. 2020, 181, 1–9.
15. Grabe, J.V.; Svoboda, P.; Baeumler, A. Window ventilation efficiency in the case of buoyancy ventilation. Energy Build. 2014, 72,
 203–211.
16. Liang, W.; Jun, L.; Juan, Z.; Lei, H.; Xi, L.Y. Analysis of the influence of window opening modes on natural ventilation in living
 room. J. Chongqing Univ. 2011, 34, 75–79.
17. S., F.; M.S., D.W.; W.E., L.; R.L., J.; A.G., R.; P.F., L. A full-scale field study for evaluation of simple analytical models of cross
 ventilation and single-sided ventilation. Build. Environ. 2021, 187, 1–11.
18. Chen, Z.; Bai, L.; Li, F. Effects of external window form on residential building energy consumption. In Proceedings of the 4th
 International Conference on Manufacturing Science and Engineering (ICMSE 2013), Dalian, China, 30–31 March 2013; pp. 1619–
 1624.
19. Barlow, S.; Fiala, D. Occupant comfort in UK offices—How adaptive comfort theories might influence future low energy office
 refurbishment strategies. Energy Build. 2007, 39, 837–846.
20. Favarolo, P.A.; Manz, H. Temperature-driven single-sided ventilation through a large rectangular opening. Build. Environ. 2005,
 40, 689–699.
21. Heiselberg, P.; Svidt, K.; Nielsen, P.V. Characteristics of airflow from open windows. Build. Environ. 2001, 36, 859–869.
22. Yang, C.; Shi, H.; Yang, X.; Zhao, B. Research on Flow Resistance Characteristics with Different Window/Door Opening Angles.
 HVACR Res. 2010, 16, 813–824.
23. Liu, T.Q.; Lee, W.L. Influence of window opening degree on natural ventilation performance of residential buildings in Hong
 Kong. Sci. Technol. Built Environ. 2020, 26, 28–41.
24. Jin, R.Q.; Hang, J.; Liu, S.S.; Wei, J.J.; Liu, Y.; Xie, J.L.; Sandberg, M. Numerical investigation of wind-driven natural ventilation
 performance in a multi-storey hospital by coupling indoor and outdoor airflow. Indoor Built Environ. 2016, 25, 1226–1247.
25. Deng, H.Y.; Feng, Z.B.; Cao, S.J. Influence of air change rates on indoor CO2 stratification in terms of Richardson number and
 vorticity. Build. Environ. 2018, 129, 74–84.
26. Buratti, C.; Mariani, R.; Moretti, E. Mean age of air in a naturally ventilated office: Experimental data and simulations. Energy
 Build. 2011, 43, 2021–2027.
27. Yang, R.Q.; Zhang, H.; You, S.J.; Zheng, W.D.; Zheng, X.J.; Ye, T.Z. Study on the thermal comfort index of solar radiation
 conditions in winter. Build. Environ. 2020, 167, 106456.
28. He, Y.D.; Chen, W.H.; Wang, Z.; Zhang, H. Review of fan-use rates in field studies and their effects on thermal comfort, energy
 conservation, and human productivity. Energy Build. 2019, 194, 140–162.
29. de Dear, R.J.; Brager, G.S. Thermal comfort in naturally ventilated buildings: Revisions to ASHRAE Standard 55. Energy Build.
 2002, 34, 549–561.
Appl. Sci. 2021, 11, 8966 20 of 20

30. Yu, Z.; Fu, Y.; Chen, M. Research on Thermal Comfort Models for Naturally Ventilated Buildings. Build. Sci. 2017, 33, 176–182.
31. Su, X.; Zhang, X.; Gao, J. Evaluation method of natural ventilation system based on thermal comfort in China. Energy Build. 2009,
 41, 67–70.
32. General Administration of Quality Supervision, Inspection and Quarantine of the People’s Republic of China. GB/T 18883-2002
 Indoor Air Quality Standard; China Standards Press: Beijing, China, 2002.
33. Li, Z. Analysis and Research on Resistance Characteristics of Building Windows. Master’s Thesis, Chang’an University, Xi’an,
 China, 2012.
34. Qing, L. Study on the Influence of Door and Window Opening on Indoor Natural Ventilation Environment. Master’s Thesis,
 Chongqing University, Chongqing, China, 2014.
35. Yao, M.; Zhao, B. Measurement of natural ventilation rate of residences in Beijing, China. Procedia Eng. 2017, 205, 3435–3440.
36. Zhangwu, X.; Qingyuan, Y.; Shiwei, H.; Yagang, Z. Influence of neighbouring tenants’ windowing conditions to the room
 ventilation. Shanxi Archit. 2015, 41, 121–122.
37. Wen, L. Experimental and Simulation Study on Single-Sided Natural Ventilation Caused by Buoyancy. Master’s Thesis, Hunan
 University, Changsha, China, 2008.
38. Fujun, W. Computational Fluid Dynamics Analysis; Tsinghua University Press: Beijing, China, 2004.
39. Tominaga, Y.; Mochida, A.; Yoshie, R.; Kataoka, H.; Nozu, T.; Yoshikawa, M.; Shirasawa, T. AIJ guidelines for practical
 applications of CFD to pedestrian wind environment around buildings. J. Wind. Eng. Ind. Aerodyn. 2008, 96, 1749–1761.
40. Meng, F.Q.; He, B.J.; Zhu, J.; Zhao, D.X.; Darko, A.; Zhao, Z.Q. Sensitivity analysis of wind pressure coefficients on CAARC
 standard tall buildings in CFD simulations. J. Build. Eng. 2018, 16, 146–158.
41. Montazeri, H.; Blocken, B. CFD simulation of wind-induced pressure coefficients on buildings with and without balconies:
 Validation and sensitivity analysis. Build. Environ. 2013, 60, 137–149.
42. Nicol, J.F.; Humphreys, M.A. A stochastic approach to thermal comfort—Occupant behavior and energy use in buildings. Ashrae
 Trans. 2004, 110, 554–568.
43. ASHRAE. ANSI/Standard 55-2013 Thermal Environment Conditions for Human Occupancy; ASHRAE: Atlanta, GA, USA, 2013.
You can also read